
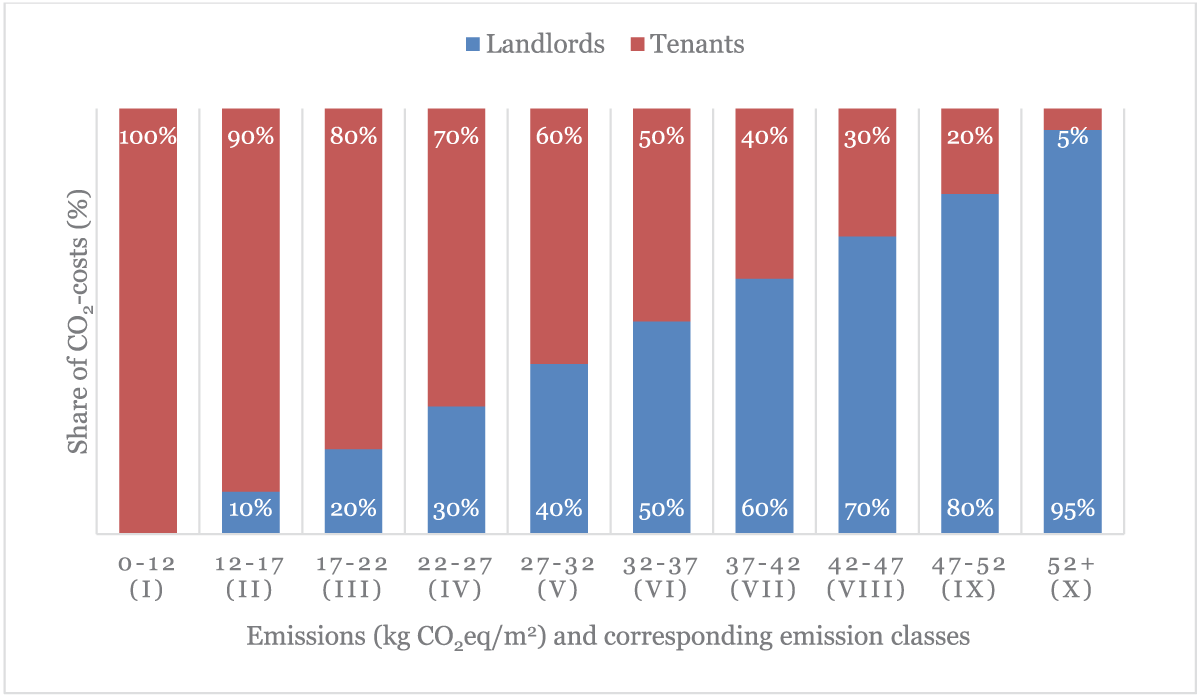
Figure 1
10-tier model of the CO2KostAufG based on the annual CO2 emissions per living space in kg CO2eq/m². Own Figure based on CO2KostAufG (2022).
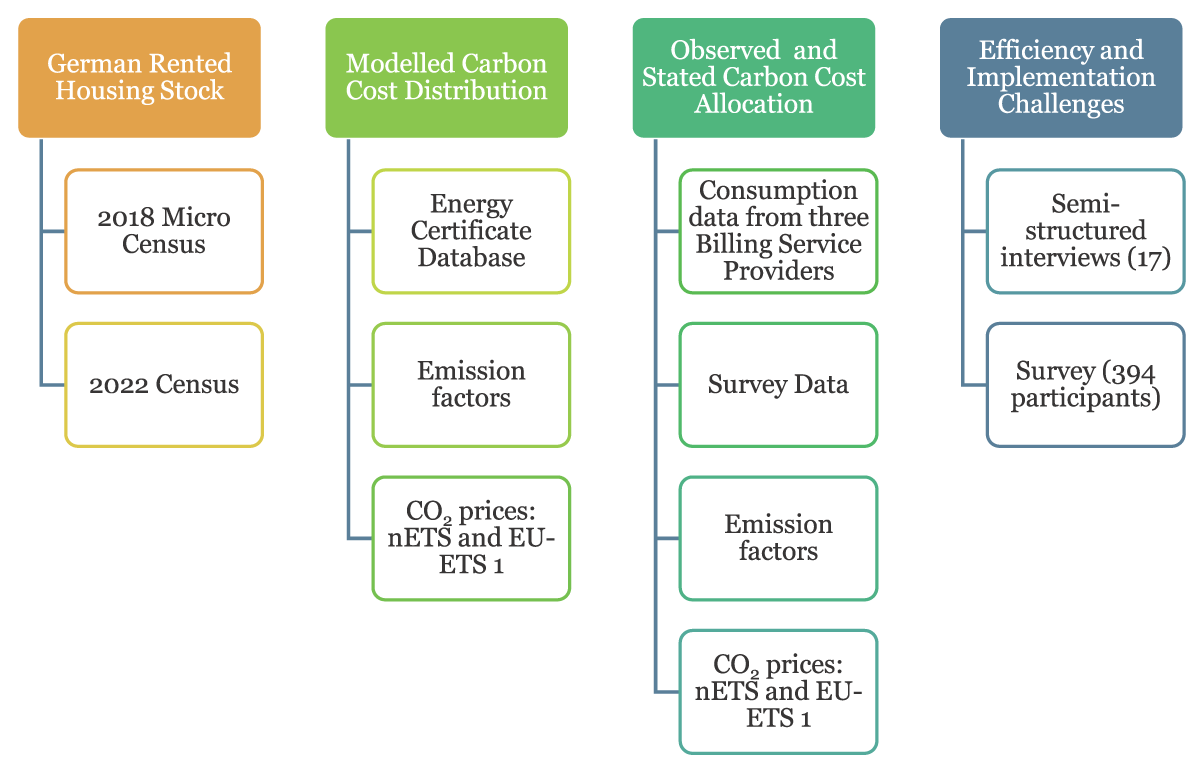
Figure 2
Mixed-methods approach of this study. Own Figure.
Table 1
Average living space (Source: 2018 Micro Census (Statistisches Bundesamt 2019)), extrapolation of total living space by heating type (Source: Census 2022 (Statistisches Bundesamt 2023)). All numbers are rounded.
| TYPE | AVERAGE LIVING SPACE [m2] | TOTAL LIVING SPACE [MIO m2] | ||||
|---|---|---|---|---|---|---|
| ALL | NATURAL GAS | HEATING OIL | DISTRICT HEATING | OTHER HEATING TYPES | ||
| MFHs | 73.9 | 1,322.3 | 796.2 | 135.9 | 329.9 | 60.3 |
| SFHs | 121.3 | 200.8 | 117.1 | 46.9 | 11.7 | 25.1 |
| TFHs | 92.6 | 190.7 | 103.3 | 57.3 | 7.6 | 22.5 |
Table 2
Emission factors as published by BAFA (2023). CO2-prices for district heating based on average EU-ETS 1 price in 2023 (Umweltbundesamt 2024b), and for natural gas and heating oil on the nETS price (BEHG 2019).
| ENERGY SOURCE | EMISSION FACTOR [t CO2/MWh] | CO2 PRICE [€/t CO2eq] |
|---|---|---|
| Natural Gas | 0.18 (heating value) 0.201 (calorific value) | 30.00 |
| Heating Oil Light | 0.266 (calorific value) | 30.00 |
| District Heating | 0.28 (calorific value) | 83.66 |
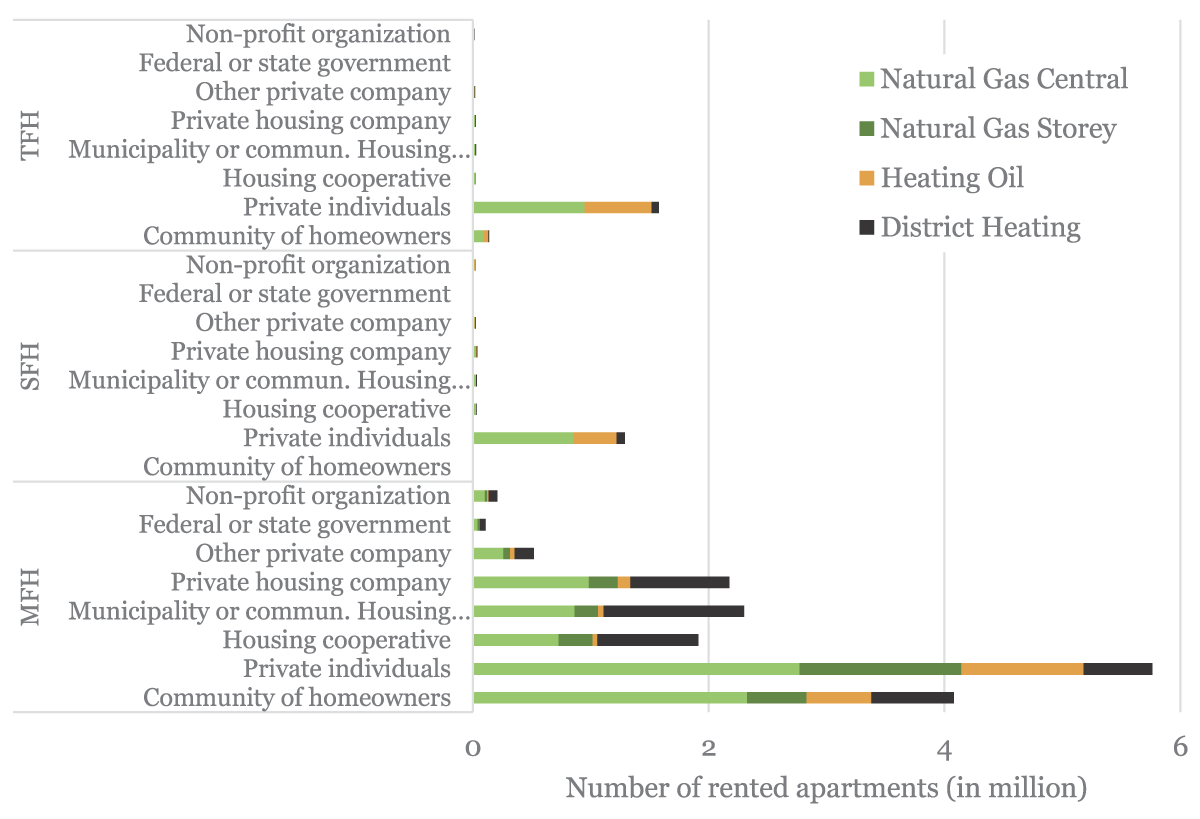
Figure 3
Number of rented apartments (in millions) in Germany by building type and ownership type, categorized by heating sources (Source: Statistisches Bundesamt 2023).
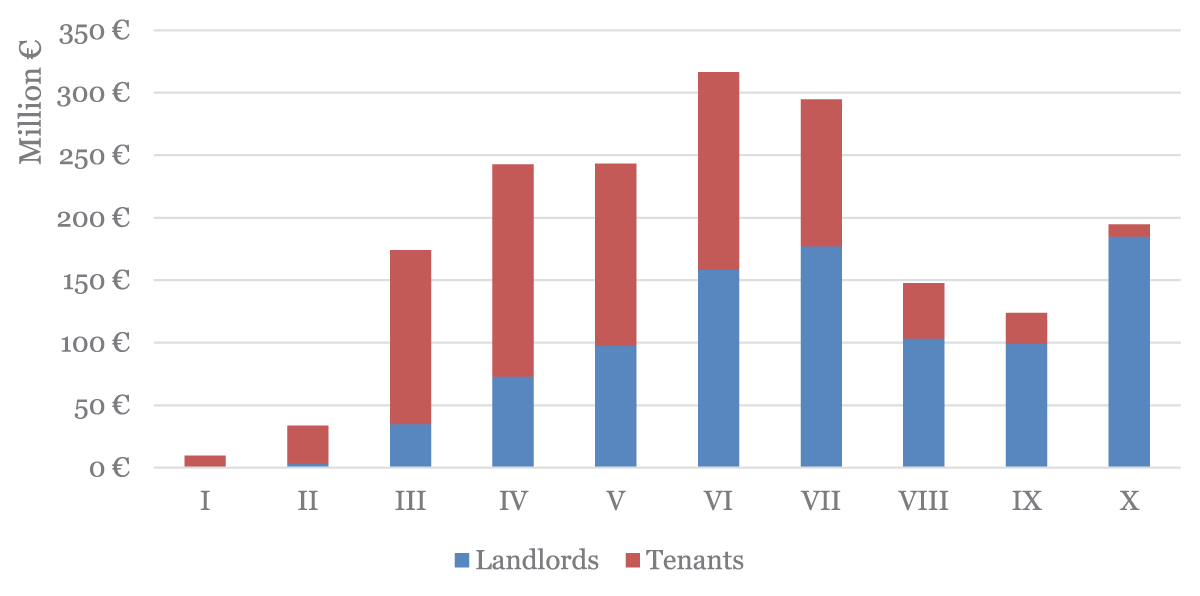
Figure 4
Estimated CO2 costs by emission tier covered by landlords and tenants for German rented multi-family dwellings in 2023 based on energy performance certificates (source: DIBt).
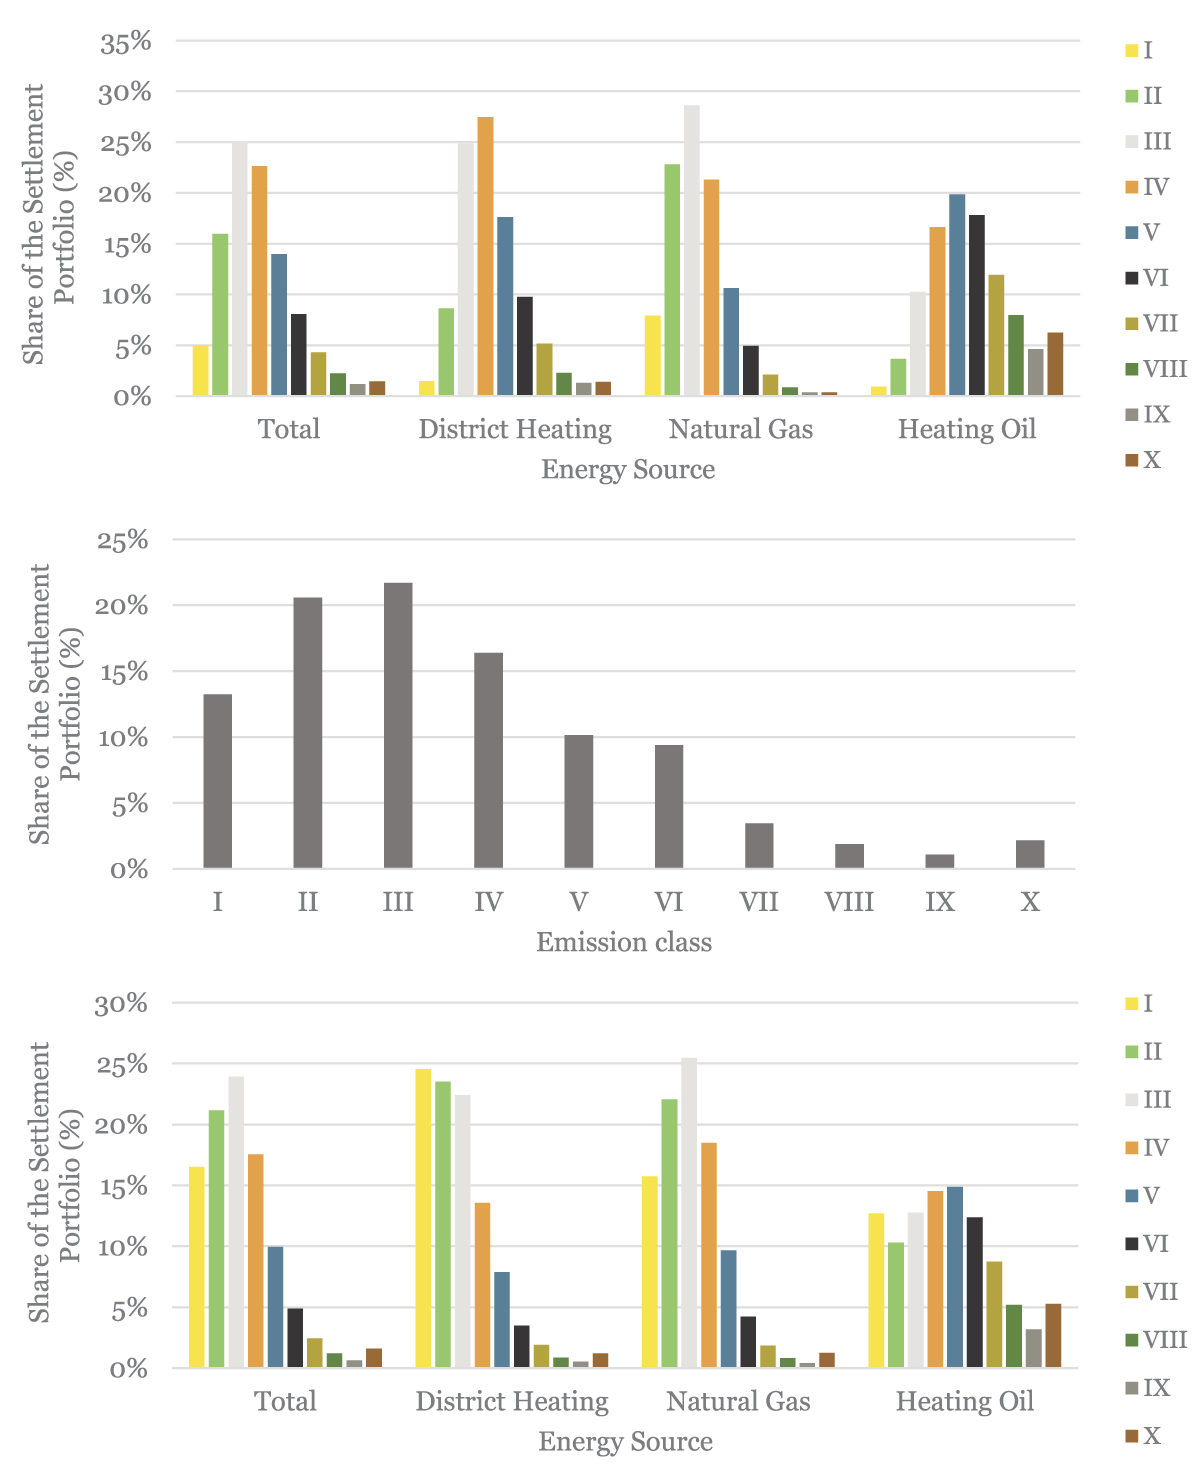
Figure 5
Breakdown of the rented living space by emission levels for the portfolios of three major German billing service providers (source: billing service provider data).
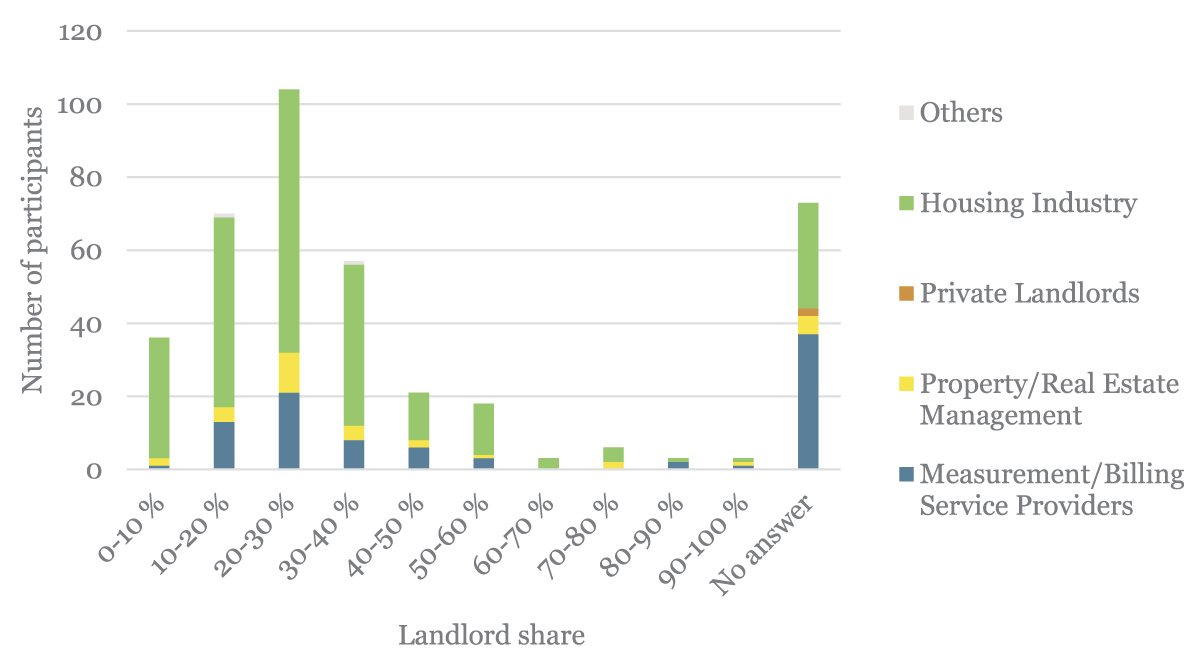
Figure 6
Estimated share of CO2 costs covered by landlords for multi-family buildings in 2023 based on the survey responses (source: survey).
Table 3
Overview on the CO2 cost distribution between landlords and tenants.
| ENERGY CERTIFICATES | BILLING SERVICE PROVIDERS | SURVEY | |
|---|---|---|---|
| Share Landlords | 52% (only MFH), 60% (MFH, SFH, TFH) | 26%, 27%, 36% (only MFH) | 33% |
| Share Tenants | 48% (only MFH), 40% (MFH, SFH, TFH) | 74%, 73%, 64% (only MFH) | 67% |
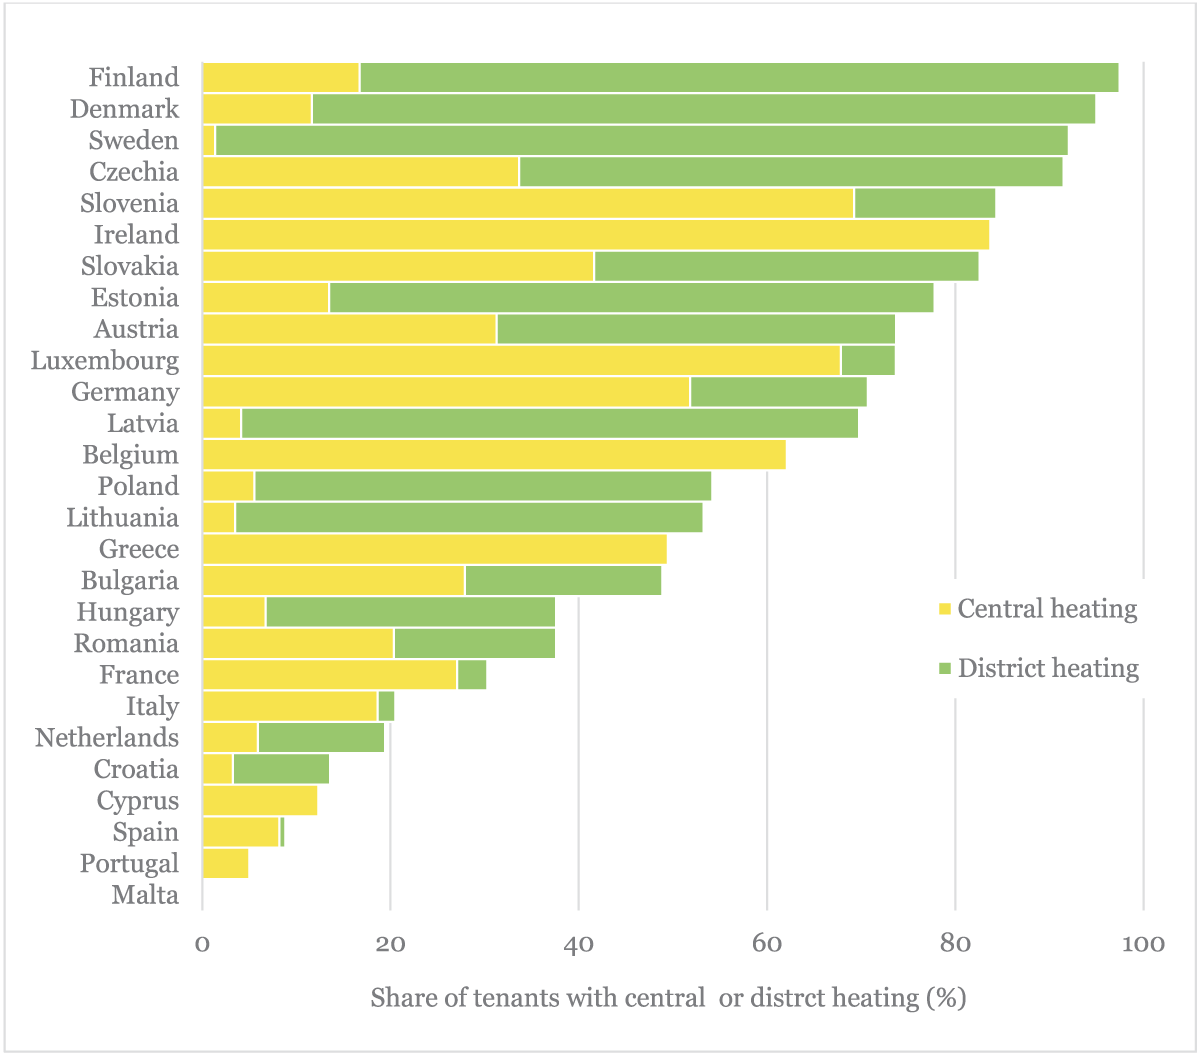
Figure 7
Share of tenant households with central heating systems based on EU-SILC 2023 microdata (Eurostat 2024b), tenant households include “Tenants, rent at market price”, “Tenant, rent at reduced price”, and “Tenant, rent free”. According to Eurostat rules, Sweden, Latvia, and Croatia (for central heating) as well as Romania, Norway, Spain, and Croatia (for district heating) should be flagged due to a low number of observations (20–49 observations). Additionally, for district heating, Belgium, Ireland, Greece, and Portugal cannot be shown due to a low number of observations (<20 observations).