
Introduction
Carbon pricing is a widely used instrument for climate change mitigation and has proven effective to reduce carbon emissions. It is seen as indispensable for reaching the goals of the Paris climate agreement by internalizing externalities and spurring low-carbon tech and investment (see Hepburn, Stern & Stiglitz 2020; Löschel, Sturm & Vogt 2021; IPCC 2022). For example, a meta-analysis of carbon pricing schemes finds that 17 of 21 schemes have delivered immediate emission cuts of 5–21%, despite the low level of prices in most instances (Döbbeling-Hildebrandt et al. 2024). Similarly, Sen et al. (2024) estimate carbon pricing delivers 8–12% average per capita CO2 reductions across 43 countries, reaching 19–23% after 10 years via fuel switching independent of renewables policies. Looking at the EU Emissions Trading System (EU-ETS 1), firm-level evidence using large, matched samples of regulated and matched non-regulated manufacturing firms show it cut CO2 emissions by 14–16% without harming economic activity (Colmer et al. 2025). This development was driven by energy-saving investments that lowered emissions intensity rather than shifting production abroad. Moreover, EU-ETS 1 emissions from power and industry installations are around 50% below 2005 levels and on track to achieve the 2030 target of –62% emissions (European Commission 2025). In Germany, the national Emissions Trading System (nETS) and the EU-ETS 1 combined have generated record revenues exceeding €21 billion in 2025, funding climate subsidies and spurring fuel efficiency (Umweltbundesamt 2026).
However, distributional effects pose a key challenge for social fairness and acceptance of carbon pricing, as these policies often exhibit regressive impacts that disproportionately burden low-income households through higher fossil fuel costs. For instance, in France, Berry (2019) quantifies that a carbon tax of €30.5/tCO2 had a 2.7 times greater impact on the poorest 10% than on the wealthiest 10%, and 1.5 times greater than on the average household. Even within the same income group, carbon pricing effects vary substantially due to diverse building stocks. CO2 costs particularly hit households with structurally high fossil energy consumption or lower incomes hardest, according to Burger et al. (2022) and Kalkuhl et al. (2024). These fairness concerns contribute to carbon pricing, often lacking majority public support and polls typically show only 30–40% approval, though support rises 20–25% with revenue recycling to low-income rebates (Maestre-Andrés et al. 2019). A German study of 15,000 households by Kaestner et al. (2025) found energy efficiency-based cost sharing most preferred (51% support) over uniform pricing (44%), with preferences unaffected by revenue use or carbon price levels (€25–130/tCO2).
In the buildings sector, the landlord-tenant problem presents a significant barrier to energy efficiency and carbon pricing effectiveness (Kühn et al. 2024; Kaestner et al. 2025). Landlords’ incentives to minimize upfront maintenance costs often conflict with tenants’ interest in retrofits that lower energy bills (Bird & Hernandez 2012; Gillingham et al. 2012). This principal-agent dilemma arises because landlords control investment decisions and tenants typically bear the heating costs, leading to split incentives and underinvestment in efficiency measures (see Bird & Hernandez 2012; Gillingham et al. 2012; Ástmarsson, Jensen & Maslesa 2013; Horng & Novikova 2018). These barriers are particularly severe in low-income rental housing as landlords capture few of the benefits from energy efficiency investments while tenants lack authority over building upgrades (Bird & Hernández 2012). As a result, landlords may delay renovations or pass costs to tenants via higher rents, exacerbating housing cost pressure (Ástmarsson, Jensen & Maslesa 2013; Behr et al. 2024). Germany faces acute challenges here, with the highest share of renters in the EU (53%) (Eurostat 2024a), comparably high heating emissions from buildings and heating and a buildings sector that continues to miss its climate targets (Umweltbundesamt 2024a; Expertenrat für Klimafragen 2025). Consequently, energy retrofit rates in German residential buildings have stagnated below 1% for over a decade despite substantial subsidy programs for energy-efficient retrofits (Galvin 2024; Umweltbundesamt 2019). Notably, when landlords cover heating costs, they invest more in efficiency (Melvin 2018).
International experience suggests that split incentives are addressed in many countries through a combination of regulatory, financial, and tenancy-law instruments. Castellazzi, Bertoldi and Economidou (2017) give an overview across approaches in European countries. Regulatory approaches address split incentives by shifting responsibility for energy performance to property owners through minimum energy performance standards, while reforms to rent and condominium laws can enable cost-sharing arrangements, green leases, and decision-making processes that facilitate energy renovations. Information-based instruments, such as energy performance certificates and individual metering, aim to reduce information asymmetries, improve awareness of energy consumption and costs, and provide incentives for both landlords and tenants to support efficiency improvements. Financial solutions seek to overcome upfront investment barriers through subsidies, tax incentives, and innovative financing mechanisms such as on-bill financing and Property Assessed Clean Energy (PACE), which can align investment incentives by linking repayment to energy savings or the property rather than the individual owner. Voluntary mechanisms, particularly green leases, attempt to overcome split incentives by allowing landlords and tenants to share the costs and benefits of energy efficiency investments, although their adoption remains limited in many European contexts. Beyond these instruments, countries have also experimented with different tenancy-law arrangements to address the allocation of energy costs. Sweden’s inclusive rent system shifts heating costs to landlords, strengthening incentives for energy-efficiency retrofits, although it may weaken tenants’ incentives to conserve energy (Reutter 2025).
Germany’s Carbon Dioxide Cost Allocation Act (CO2KostAufG 2022) represents a novel regulatory response to the landlord–tenant dilemma by explicitly reallocating carbon price burdens for space heating between landlords and tenants. Introduced in 2023, the law links the distribution of heating-related CO2 costs between landlords and tenants to building-level emissions performance, with the aim of strengthening renovation incentives while limiting regressive impacts on tenants. As such, the CO2KostAufG constitutes a rare example of a rule-based, ex-post incidence adjustment embedded within an emissions trading framework, and is of particular relevance for the broader EU debate on socially balanced carbon pricing and the implementation of EU-ETS 2 in buildings. This paper presents a process evaluation of the German CO2 cost-splitting scheme. Given that the scheme was only introduced recently, it is too early to assess its long-term impacts, such as investments in building energy efficiency or renewable heating systems. Instead, the paper examines the implementation of the scheme, focusing on whether the cost-splitting provisions are applied as intended, the challenges encountered by market participants, and the resulting distribution of CO2 costs between landlords and tenants.
The German Carbon Dioxide Cost Allocation Act
The German Carbon Dioxide Cost Allocation Act took effect in January 2023 and was first applied in 2024 to the previous heating period 2023 (CO2KostAufG 2022). The law operates alongside Germany’s nETS and the EU-ETS 1, which jointly price fossil heating fuels such as natural gas (nETS), heating oil (nETS), and district heating (EU-ETS 1, nETS for smaller installations).
The policy aims to promote a fairer distribution of CO2 costs in rental buildings while addressing the landlord–tenant split incentive. Its objectives are to encourage energy-efficient renovations and the adoption of low-emission heating systems by landlords, preserve incentives for energy-efficient behavior by tenants, and ultimately reduce heating-related emissions in the building stock. To this end, the law introduces a cost-sharing mechanism that links the allocation of carbon costs to the realized emissions performance of individual buildings.
Under the CO2KostAufG, CO2 costs are distributed using a 10-tier model based on annual CO2 emissions per square meter of living space. Emissions are calculated using reported fuel consumption, building living space, and fuel-specific emission factors. Buildings with higher emissions intensity are assigned classes, in which landlords bear a larger share of CO2 costs, whereas lower-emission buildings shift a greater share of costs to tenants (Figure 1). At the extremes of the model, tenants bear the full CO2 costs in the best-performing class I, while landlords cover up to 95% of the costs in the worst-performing class X.
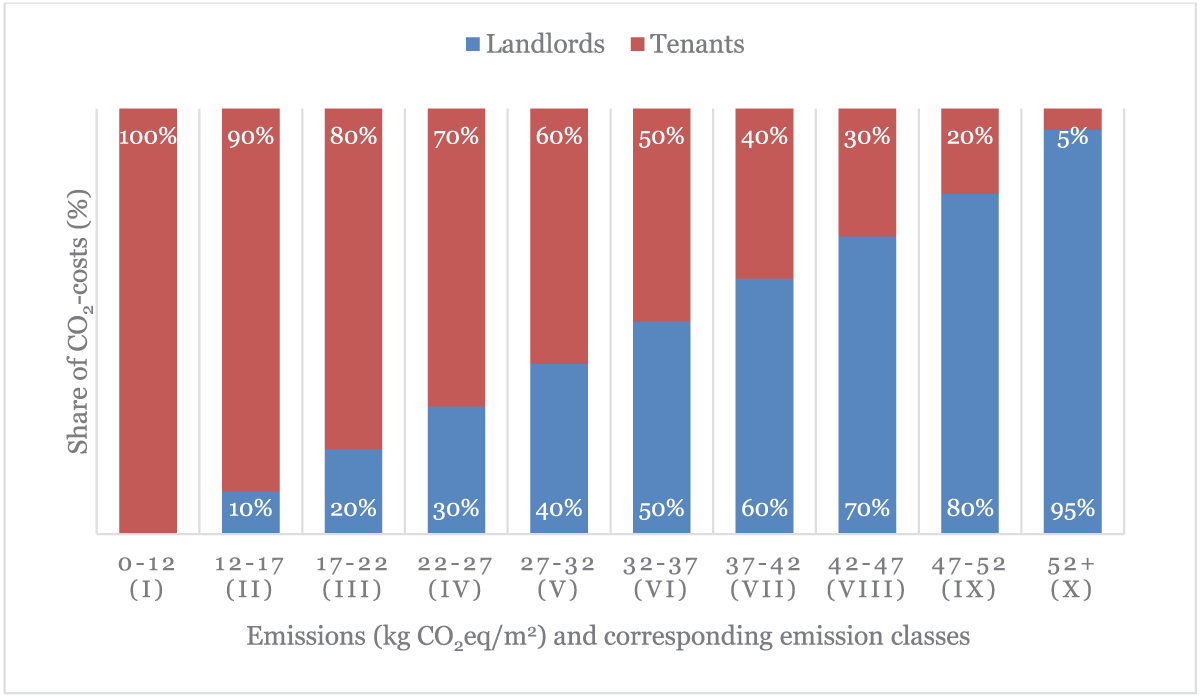
Figure 1
10-tier model of the CO2KostAufG based on the annual CO2 emissions per living space in kg CO2eq/m². Own Figure based on CO2KostAufG (2022).
The CO2KostAufG contains several exemptions that limit or exclude landlords’ cost-sharing obligations. Under § 9(1), the landlord’s share of CO2 costs is halved when legal or regulatory constraints restrict energy efficiency improvements, such as in listed buildings, areas subject to preservation statutes, or where municipal regulations mandate district heating and limit landlords’ control over the heating system. In addition, the law does not apply to CO2 costs from fuels invoiced before 2023, irrespective of the actual consumption period (§ 11(2)). This applies mostly to heating oil purchases before 2023. Finally, buildings newly connected to district heating after the onset of 2023, are fully exempt from the cost allocation mechanism (§ 2(3)).
Methodology
This analysis used a mixed-methods approach which is visualized in Figure 2. It consists of four methodological steps: the characterization of the German rental housing stock, the calculation of the modelled and observed CO2 cost allocation between landlords and tenants, and the analysis of efficiency of the approach and implementation challenges.
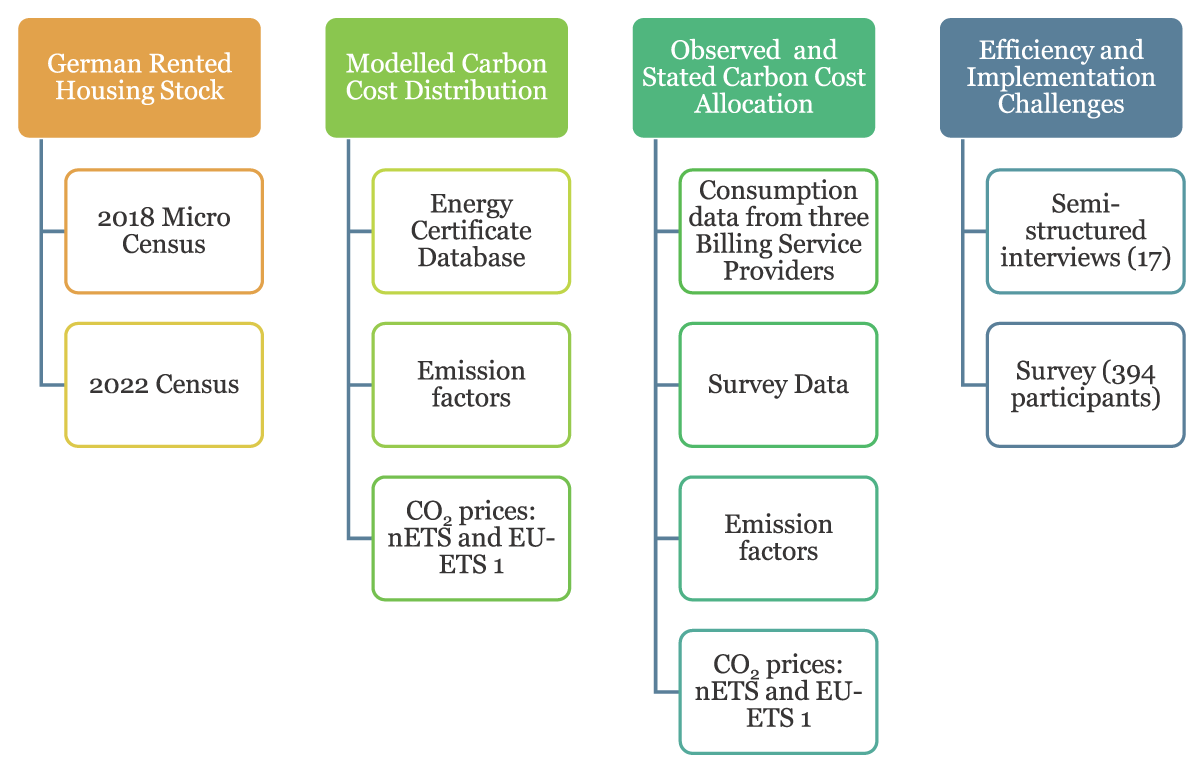
Figure 2
Mixed-methods approach of this study. Own Figure.
As the CO2 Cost Allocation Act entered into force only in 2023, the evaluation focuses on the early implementation of the legislation. We combine quantitative and qualitative methods to assess three complementary dimensions. First, the operational functioning of the allocation mechanism is analysed by examining whether the legislation is being implemented within existing heating cost billing procedures and identifying practical implementation challenges. Second, the distributional effects of the legislation are assessed by comparing the expected allocation of CO2 costs with the observed allocation derived from billing service providers and stakeholder information. Third, stakeholder interviews and the online survey are used to evaluate the practical applicability of the legislation and to identify implementation barriers perceived by landlords, property managers and billing service providers.
Characterization of German rented housing stock
The data of the Census 2022 (Statistisches Bundesamt 2023) is used to characterize the German rental housing sector across different building types (single family homes, two-family homes and multi family homes) and ownership structures (Non-profit organizations, federal state or government, private housing company, other private company, municipality or community housing, housing cooperatives, private individuals, community of homeowners). The data is used to provide a quantitative overview of rental housing units by housing type, energy carrier used for heating and ownership type. This information feeds into the following steps to estimate the distribution of carbon costs across the German rental housing sector.
Modelled cost distribution in 2023
To estimate the distribution of costs, the living space is extrapolated according to building type and heating type, using the following data sources:
Based on data from the 2022 census and the 2018 microcensus, the total area of the rented stock is estimated according to building type and energy source (Table 1).
The distribution of energy consumption in the respective segments is estimated based on the distribution of energy performance certificates (dena 2025). For multi-family houses (MFH), consumption certificates are used as a basis. For single-family houses (SFH), demand certificates are used, with a correction factor applied. For this purpose, the demand values from the energy performance certificates are multiplied by the correction factors from Loga & Stein (2020).
The emission factors shown in Table 2 are used to calculate the CO2 classes. For natural gas and heating oil, this corresponds to the emission factors used in the calculations according to CO2KostAuftG. For district heating, the CO2 costs are distributed based on the emission factor of the respective district heating network. An average value based on billing service data from 2023 for district heating was used for the extrapolation.
For CO2 costs, a price of €30/tCO2 was used for buildings heated with natural gas and heating oil, which corresponds to the price under the Fuel Emissions Trading Act (BEHG) in 2023. In the area of district heating, it was taken into account that this is largely covered by the existing EU Emissions Trading System (EU-ETS 1), where the price was higher during the period under review.
The shares of landlords are halved in three cases: (1) when monument protection regulations apply, (2) when preservation statutes are in place, and (3) when municipal statutes require the use of district heating. Milieu protected areas and obligations for the use of district heating are regulated by the municipalities. Nationwide statistics were difficult to determine, as the designation and documentation of these protected zones are handled at the municipal level and lack uniform national tracking (see Gutschmidt 2025; Steinbacher & Krass 2023). Although the share of residential buildings under monument protection was available, information on the distribution across energy carriers and the share among rented buildings were unknown (Diefenbach et al. 2010). Thus, these exceptions had to be disregarded in the analysis due to the lack of available data.
The emissions and corresponding costs were calculated for each emission class and energy source, CO2 costs were allocated between tenants and landlords in accordance with the regulations of the CO2KostAufG, and the total CO2 cost distributions were aggregated to compute the overall CO2 cost distribution across Germany.
Table 1
Average living space (Source: 2018 Micro Census (Statistisches Bundesamt 2019)), extrapolation of total living space by heating type (Source: Census 2022 (Statistisches Bundesamt 2023)). All numbers are rounded.
| TYPE | AVERAGE LIVING SPACE [m2] | TOTAL LIVING SPACE [MIO m2] | ||||
|---|---|---|---|---|---|---|
| ALL | NATURAL GAS | HEATING OIL | DISTRICT HEATING | OTHER HEATING TYPES | ||
| MFHs | 73.9 | 1,322.3 | 796.2 | 135.9 | 329.9 | 60.3 |
| SFHs | 121.3 | 200.8 | 117.1 | 46.9 | 11.7 | 25.1 |
| TFHs | 92.6 | 190.7 | 103.3 | 57.3 | 7.6 | 22.5 |
Table 2
Emission factors as published by BAFA (2023). CO2-prices for district heating based on average EU-ETS 1 price in 2023 (Umweltbundesamt 2024b), and for natural gas and heating oil on the nETS price (BEHG 2019).
| ENERGY SOURCE | EMISSION FACTOR [t CO2/MWh] | CO2 PRICE [€/t CO2eq] |
|---|---|---|
| Natural Gas | 0.18 (heating value) 0.201 (calorific value) | 30.00 |
| Heating Oil Light | 0.266 (calorific value) | 30.00 |
| District Heating | 0.28 (calorific value) | 83.66 |
Observed CO2 cost distribution in 2023
Thirdly, to assess the actual CO2 cost allocations, 2023 billing service data from the three major providers was analysed. The methodology for calculating emissions and costs by emission level, and the allocation of costs follows the same approach as for the modelled consumption.
Stated CO2 cost distribution in 2023
Complementing the two approaches presented above, a third approach derives the distribution of CO2 costs from stakeholder assessments collected in a survey, where respondents estimated the percentage shares of total CO2 costs in their portfolio. The survey was distributed via email to major German associations representing metering and billing services, private landlords, housing and real estate companies, and property management firms. These associations were asked to forward the survey to their member companies, with responses collected between March 27 and April 25, 2025.
A total of 394 participants completed the survey, including 266 from the housing industry, 92 from billing and metering service providers, and 32 from property and real estate management companies. Overall, the survey thus provides a solid picture of the opinions of key stakeholder groups in the housing and real estate industry, billing and metering service providers, and property management companies, allowing reliable conclusions to be drawn for this sector. However, participation by private small landlords was extremely low, with only two responses. Given their significant share of the rental housing market, this represents a limitation in terms of representativeness, especially when it comes to assessing feasibility, the information situation, or challenges for this specific group. Their perspective could therefore only be indirectly reflected in this survey via the building and property management companies.
Efficiency and implementation challenges
To analyze the efficiency and implementation challenges of the CO2 cost allocation act, 17 expert interviews were conducted in video calls covering the following stakeholder groups:
Billing service providers, responsible for adapting their systems and processes to the new requirements.
Landlords, as they must contribute to the CO2 costs under the regulation and ensure that the CO2 costs are distributed in accordance with the step function or coordinate the process with the billing service providers.
Property managers, as they either take over the operational implementation of the requirements directly in the course of heating cost billing or coordinate communication with billing service providers.
Tenants, as they bear a share of the CO2 costs under the CO2KostAufG. In addition, the costs of implementing the allocation are passed on to tenants as part of the heating cost billing.
The interviews were used to identify barriers to implementation and to better understand deviations from the intended policy design. A particular focus was on explaining why the statutory cost-splitting mechanism is not applied in some rental relationships.
The interviews aimed to capture the practical experiences of relevant stakeholders with the implementation of the CO2 cost-splitting scheme, including barriers, uncertainties, and deviations from the intended regulatory design. Given the recent introduction of the scheme, the interviews focused on implementation processes rather than policy outcomes, providing qualitative insights into how the legislation was applied in practice and the reasons why the cost split was not implemented in some cases.
Results and Discussion
Characterization of German rented housing stock
Figure 3 provides an overview of the distribution of rented units by building type, main energy carrier used for heating and ownership type. The largest group of tenancies is found in multi-family homes (MFHs) (83%), followed by two-family homes (TFHs) (10%) and single-family homes (SFHs) (8%). Regarding heating types considered under the CO2KostAufG, the dominating energy carrier is natural gas heating (60%), as central (47%) or individual heating units (13%), especially in MFHs. District heating makes up 22%, mostly in MFHs. Heating oil makes up for 13% of the overall rented units in Germany, with the highest share in TFHs (30%) and SFHs (23%). Moreover, private individuals are by far the largest landlord group in all ownership types.
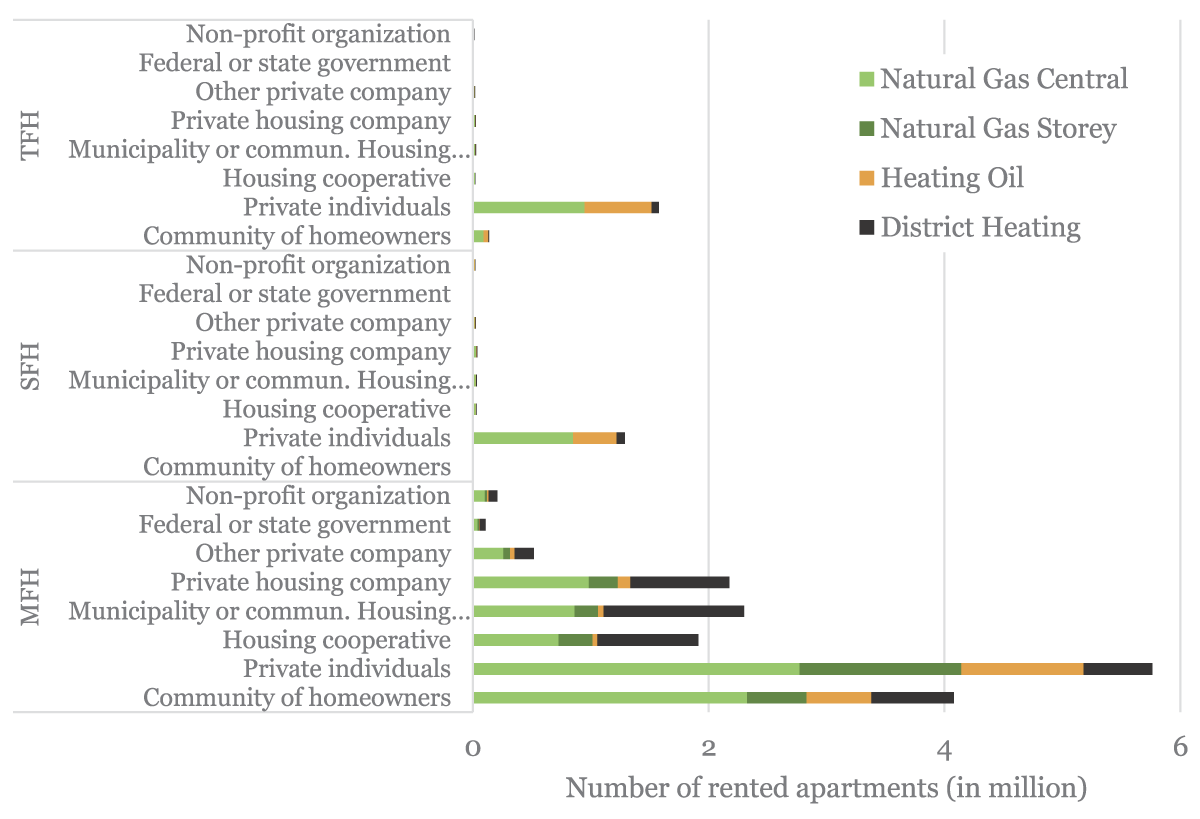
Figure 3
Number of rented apartments (in millions) in Germany by building type and ownership type, categorized by heating sources (Source: Statistisches Bundesamt 2023).
CO2 cost distribution
Modelled distribution
Figure 4 shows the results of the modelled distribution of CO2 costs using energy cost certificates. The results show that across all tenancies, landlords are modelled to account for approximately 52% of the costs for multi-family dwellings, while tenants cover approximately 48% of the costs.
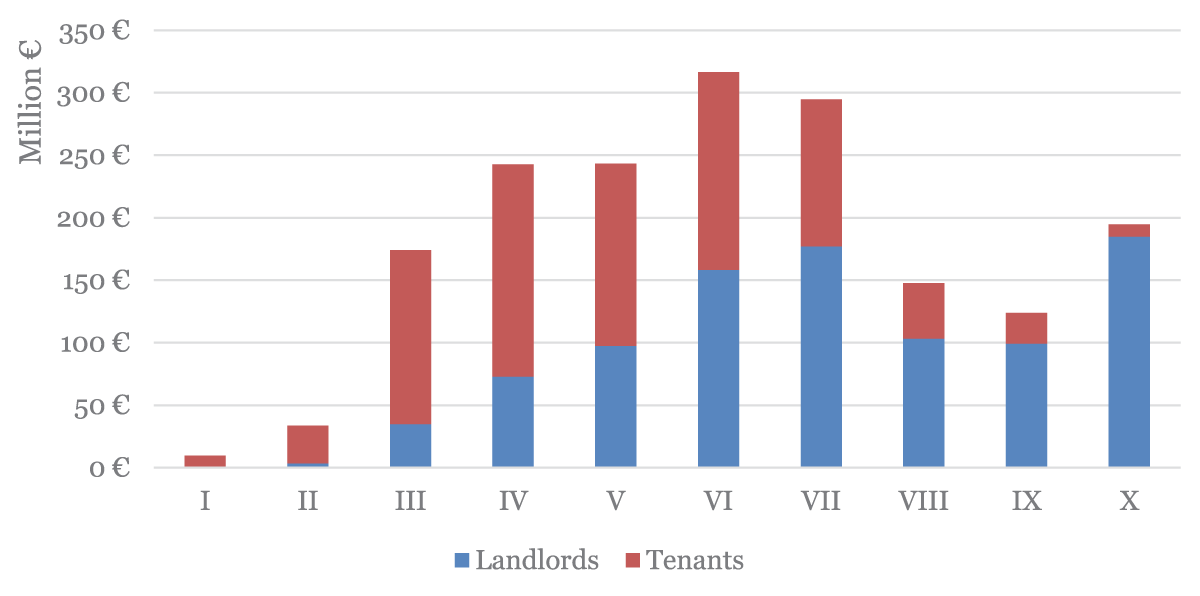
Figure 4
Estimated CO2 costs by emission tier covered by landlords and tenants for German rented multi-family dwellings in 2023 based on energy performance certificates (source: DIBt).
Calculated distribution based on data from billing service providers
Figure 5 shows the distribution of buildings by emission class based on the data of three different billing service providers. The figure shows that a large proportion of buildings fall into the first classes, particularly for natural gas and district heating. Overall, the evaluation results in CO2 cost shares for landlords of 26%, 27%, and 26%.
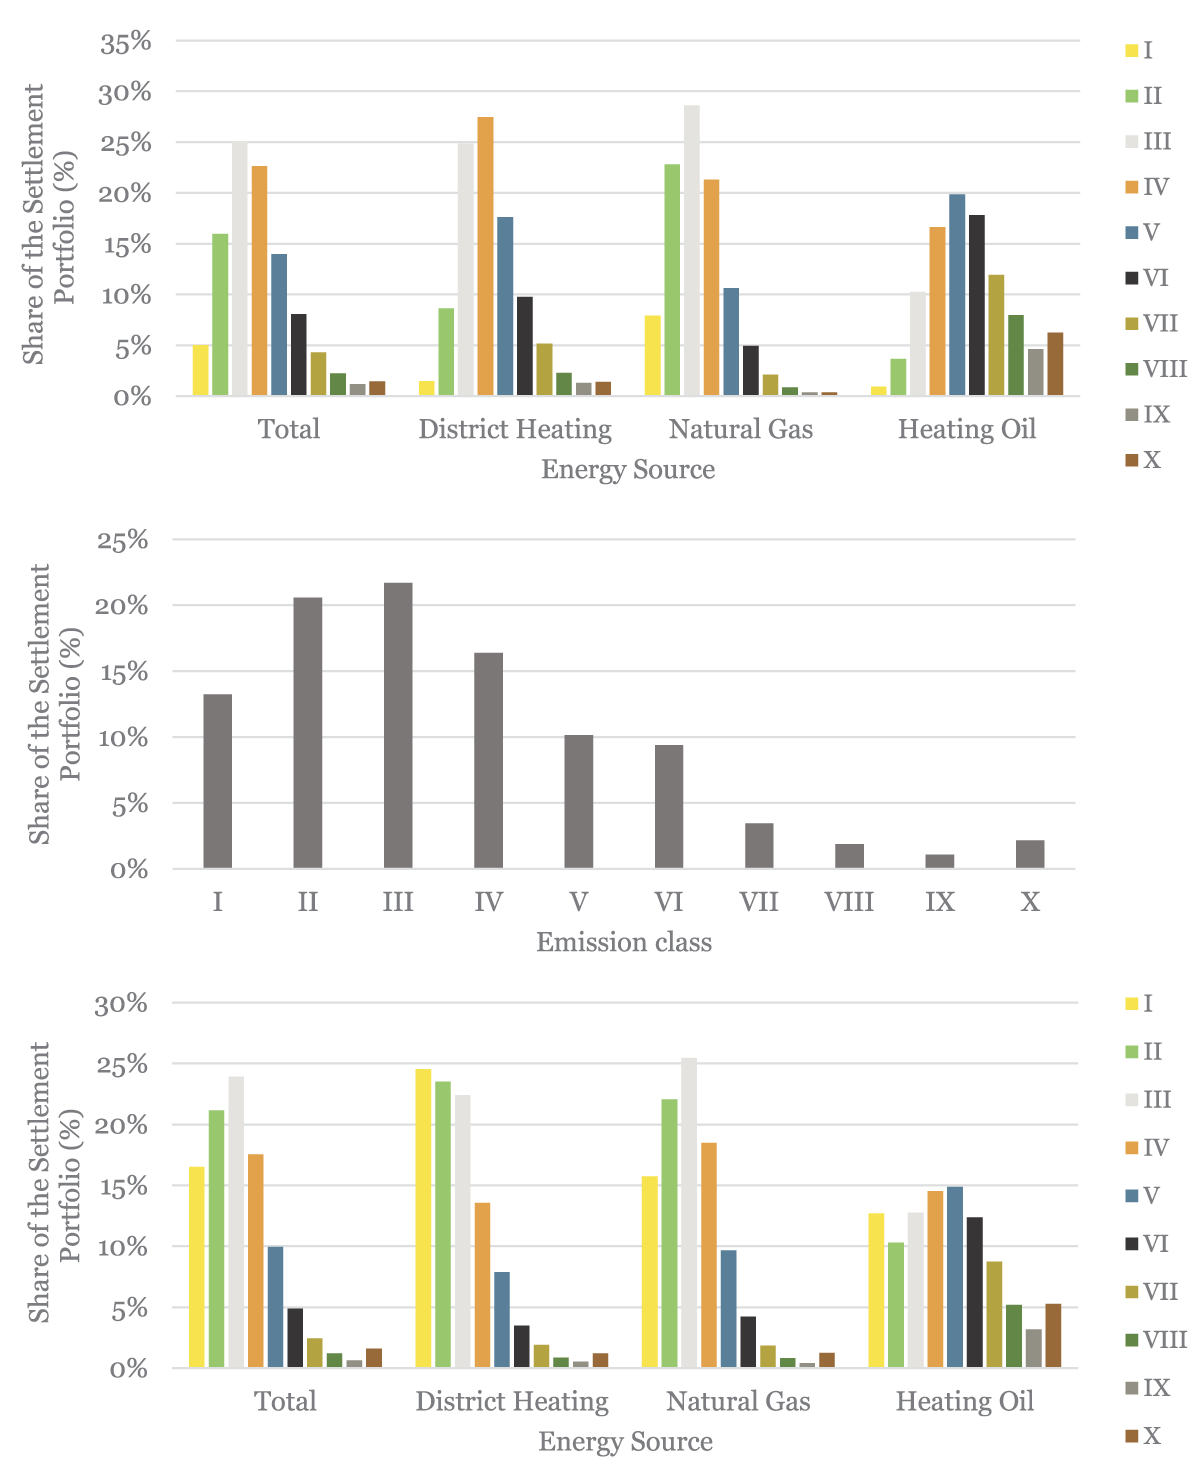
Figure 5
Breakdown of the rented living space by emission levels for the portfolios of three major German billing service providers (source: billing service provider data).
Distribution based on the survey
In the survey, participating companies provided information on the estimated cost distribution in their managed building portfolios (Figure 6). The most frequently selected response category was a landlord share of 20–30%. Over 83% stated that their portfolio falls into one of the first four emission classes of the CO2KostAufG. Less than 5% reported landlord shares of over 60%. This results in a total landlord share of 33%.
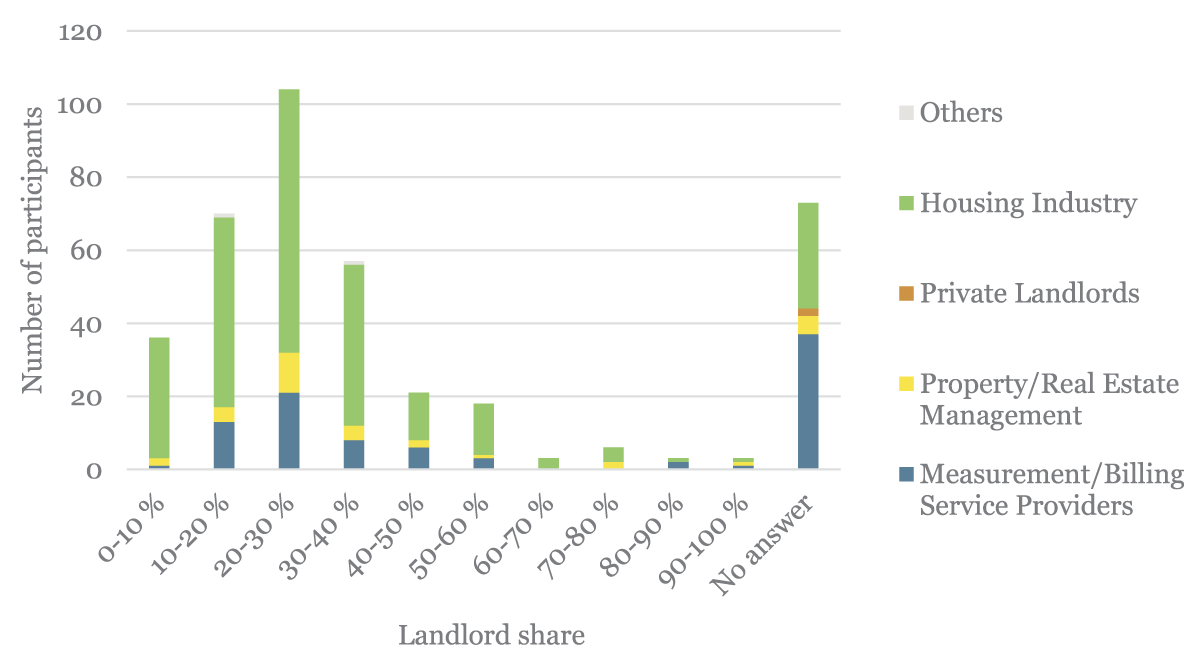
Figure 6
Estimated share of CO2 costs covered by landlords for multi-family buildings in 2023 based on the survey responses (source: survey).
Comparative overview
A comparison of the results of the shares calculated in the previous sections shows that the modelled distribution based on energy performance certificates yields a significantly higher share of CO2 costs borne by landlords than the other two data sources used (Table 3). This suggests that, on average, energy performance certificates record higher energy consumption than the consumption data from 2023.
Table 3
Overview on the CO2 cost distribution between landlords and tenants.
| ENERGY CERTIFICATES | BILLING SERVICE PROVIDERS | SURVEY | |
|---|---|---|---|
| Share Landlords | 52% (only MFH), 60% (MFH, SFH, TFH) | 26%, 27%, 36% (only MFH) | 33% |
| Share Tenants | 48% (only MFH), 40% (MFH, SFH, TFH) | 74%, 73%, 64% (only MFH) | 67% |
Table 3 reveals substantial discrepancies between the modelled and observed distribution of CO2 costs between landlords and tenants. The following section analyses the underlying reasons for these differences and distinguishes between temporary and systematic effects.
Methodological implications of weather normalization for policy calibration
The discrepancy between the modelled and observed distribution of CO2 costs shown in Table 3 can be explained by two fundamentally different mechanisms. The first is temporary and results from unusually low heating demand during the 2022–2023 energy crisis (see Roth & Schmidt 2023; Jamissen et al. 2024), although Singhal et al. (2026) found a large intention-to-action gap in reducing heating consumption. This effect influences the annual distribution of buildings across the emission classes of the CO2KostAufG but is not expected to persist over longer time periods. They therefore do not fundamentally affect the validity of the policy calibration.
The second mechanism is systematic and results from the methodology used to weather-normalize energy consumption in German consumption-based energy performance certificates (EPCs). Consumption-based EPCs are designed to compare the intrinsic energy performance of buildings independently of the weather conditions during the observation period. To achieve this, measured annual heating energy consumption is adjusted using climate correction factors (Klimafaktoren) published by the German Meteorological Service (DWD).
This approach is appropriate provided that the reference climate remains representative of the climatic conditions under which the corrected energy consumption is interpreted. Under this assumption, weather-normalized consumption provides an approximately unbiased estimate of the long-term operational energy consumption of the building stock. However, this assumption is increasingly violated as a consequence of climate change. Germany has experienced a sustained increase in winter temperatures over recent decades, resulting in substantially lower heating demand than during the reference period used to derive the DWD climate correction factors, which, in turn, were used to define the ten levels of CO2-cost sharing within the CO2KostAufG. Lower real energy consumption as a consequence of climatic warming therefore leads to buildings systematically entering CO2-cost-sharing levels where the tenants have to pay a higher share of the CO2-costs.
Importantly, this finding does not imply a weakness of the operational design of the CO2KostAufG. The legislation intentionally allocates CO2 costs on the basis of realised annual fuel consumption obtained from the existing heating cost billing process. This considerably simplifies implementation, avoids additional weather normalization during billing, and ensures that the allocated costs correspond to the CO2 emissions that actually occurred during the billing period. Over multiple years, warmer and colder winters naturally average out in the operational data. The systematic bias therefore arises exclusively in the ex-ante calibration of the expected cost distribution and not in the practical implementation of the legislation.
Efficiency and implementation challenges
Our evaluation finds that the system works well in segments where it builds on existing heating cost sub-metering and billing procedures. These are established in Germany under the German Heating Cost Ordinance (Verordnung über die verbrauchsabhängige Abrechnung der Heiz- und Warmwasserkosten 1981) and are widely used in the EU under the Energy Efficiency Directive. This means that in many apartment buildings, specialized billing companies already allocate costs between dwellings. As a result, carbon costs can often be split automatically as part of the existing processes.
Problems mainly arise in flats with individual heating units in each dwelling and in rented single- or two-family homes. In these cases, standardised billing structures are not in place, making it difficult to split carbon costs between landlords and tenants. Tenants in these cases can claim part of the carbon costs back from their landlord, but in practice this rarely happens: most tenants are unaware of their rights, the calculation is complex, and even when done correctly it creates significant administrative effort both for tenants and landlords.
Importantly, these building types account for only a minority of rented homes (See Figure 3). This means that the issues for these segments should be addressed, however they do not undermine the overall functioning of the system across the rental market.
Application to other EU Countries
For an EU-wide perspective, the EU-SILC 2023 microdata provides information linking tenancy status with heating type used in the dwelling. This allows a preliminary assessment of which countries might be more amenable to implementing a similar system. Figure 7 presents the share of tenant households that live in dwellings with central and district heating across EU member states.
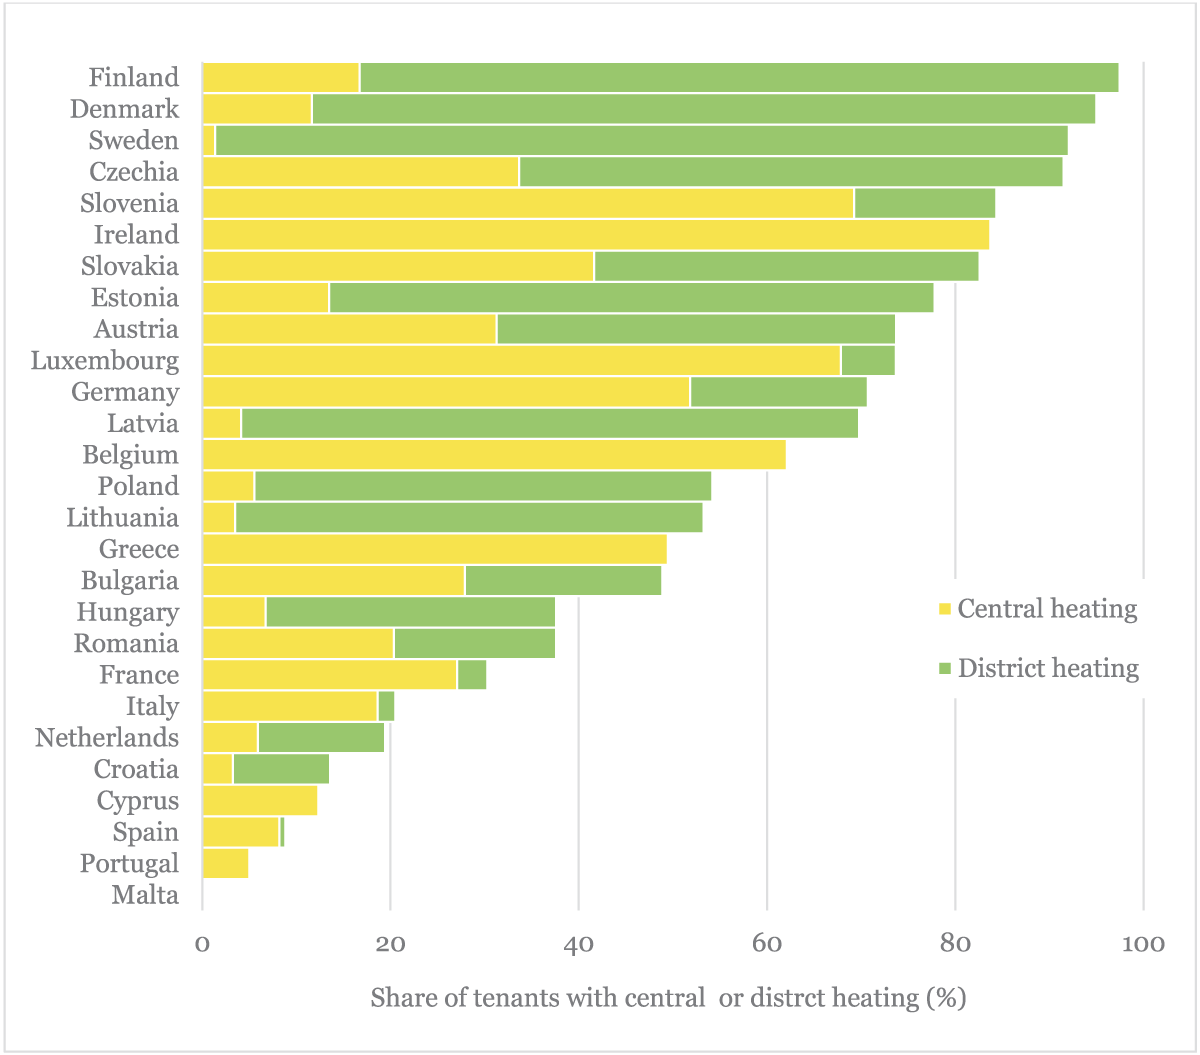
Figure 7
Share of tenant households with central heating systems based on EU-SILC 2023 microdata (Eurostat 2024b), tenant households include “Tenants, rent at market price”, “Tenant, rent at reduced price”, and “Tenant, rent free”. According to Eurostat rules, Sweden, Latvia, and Croatia (for central heating) as well as Romania, Norway, Spain, and Croatia (for district heating) should be flagged due to a low number of observations (20–49 observations). Additionally, for district heating, Belgium, Ireland, Greece, and Portugal cannot be shown due to a low number of observations (<20 observations).
From this analysis, it becomes evident that countries with high proportions of tenancies with central heating systems and district heating would likely find it easier to implement a CO2 cost allocation system similar to Germany. Conversely, countries with predominantly individual storey heating, such as Spain, Portugal, and Malta, may face higher implementation challenges, as heating costs are directly borne by individual households and there is a limited existing infrastructure for distributing CO2 costs collectively.
This result suggests that while the German model is promising, its direct transferability depends on housing structure, tenancy rates, and existing heating infrastructure. Further research is needed to quantify the potential applicability and identify country-specific barriers.
Conclusions
Our analysis shows that the German approach to splitting carbon costs in rented residential buildings is applied across most segments of the rental market. A key factor behind its successful implementation is that the scheme is integrated into existing sub-metering and billing procedures, minimizing additional administrative effort. However, this integration also means that the cost split is based on actual energy consumption rather than standardized consumption levels. As a result, landlords may bear a larger share of the CO2 costs when tenants consume relatively little heating energy—for example, because they underheat their homes due to energy poverty.
However, the mechanism performs less effectively in certain market segments, particularly in single-family homes and buildings with individual gas heating systems in each flat. In these cases, the administrative procedures and allocation rules have shown to be less suitable, indicating that the design of the mechanism does not fully accommodate all building and heating system configurations.
A key finding of the evaluation concerns the equity of the programme: The distribution of carbon costs between tenants and landlords differs substantially from the original policy objective. The legislation aimed to achieve an approximately equal split of total carbon costs across the rental sector. In practice, however, tenants currently bear around 70% of the total carbon cost burden.
Two main factors explain this discrepancy. First, the sharp increase in energy prices led many households to reduce heating demand. As a result, a larger share of buildings now falls into lower-emission categories within the cost-sharing scheme, where tenants are responsible for a higher proportion of the carbon costs. Second, technical limitations in the weather correction procedures used in German energy performance certificates affect the modelled cost distribution and therefore distort the allocation of carbon cost shares.
Overall, the German model provides an interesting policy approach for other countries seeking to introduce carbon cost sharing between landlords and tenants. However, successful transfer requires careful consideration of national billing practices, building stock characteristics, and the design of building energy certification systems.
Acknowledgements
The authors thank Nelly Unger for her support with the EU-SILC data.