
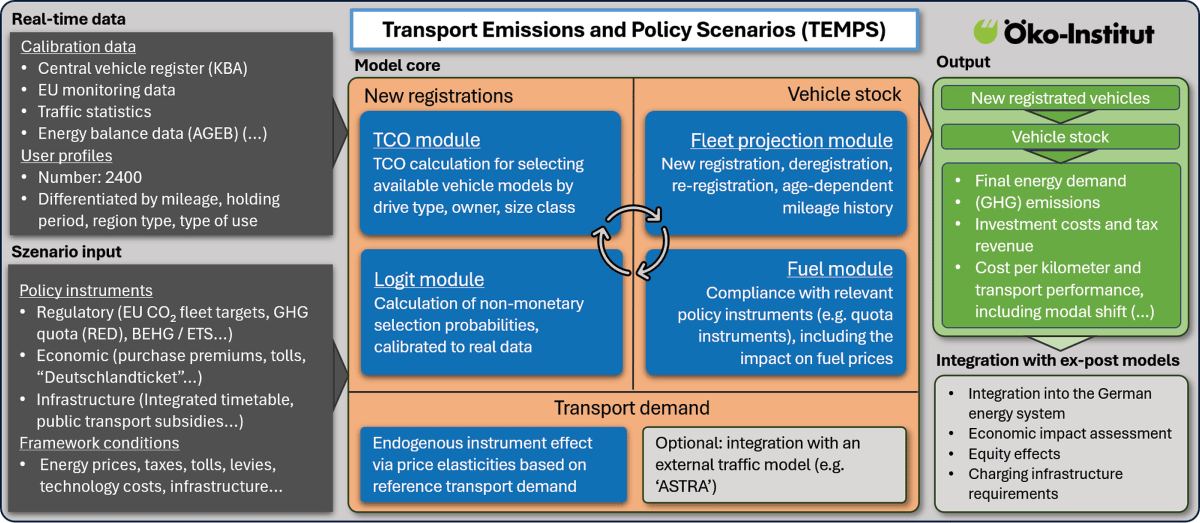
Figure 1
Overview of the structure of the TEMPS model.
Table 1
Components of the TCO-calculation.
| INVESTMENT COSTS | RUNNING COSTS |
|---|---|
|
|
Table 2
Key data sources used by the TEMPS model.
| NAME DATA SET | USE IN MODEL | SOURCE |
|---|---|---|
| MOP | User profiles | KIT 2021 |
| MiD 2017 | User profiles | Infas 2018 |
| KiD 2010 | User profiles | BMVI 2010 |
| Fahrleistungserhebung 2014 | User profile mileage | BASt 2015 |
| Energiebilanz für Deutschland | Calibration of final energy demand | AGEB 2025 |
| Verkehr in Zahlen | Traffic demand | KBA 2024 |
| EU-Monitoring-Datenbank | Calibration of new registrations | EEA 2025b |
| Zentrales Fahrzeugregister | Vehicle stock and age structure, survival curves | KBA n.d. |
| Techno-economic assumptions of the PRIMES-TREMOVE transport model | Technology costs of vehicles | JRC 2024 |
| Mineralölstatistik | Short-term validation of energy demand | BAFA 2025 |
| Automatische Dauerzählstellen | Short-term validation of transport demand | BASt 2026 |
| Rahmendaten Projektionsbericht | Energy prices, GDP, population, deflator | UBA 2026b |
| Fuel Quality Directive | Emission factors | EEA 2025a |
| Generalzolldirektion | Renewable fuel volumes | GZD 2026 |
Table 3
Relative deviation of emissions from newly registered vehicles in Germany versus EU.
| 2018 | 2019 | 2020 | 2021 | 2022 | 2023 | 2024 | |
|---|---|---|---|---|---|---|---|
| Relative deviation in % | 7.9 | 6.2 | 4.7 | –1.7 | –3.6 | 5.1 | 9.6 |
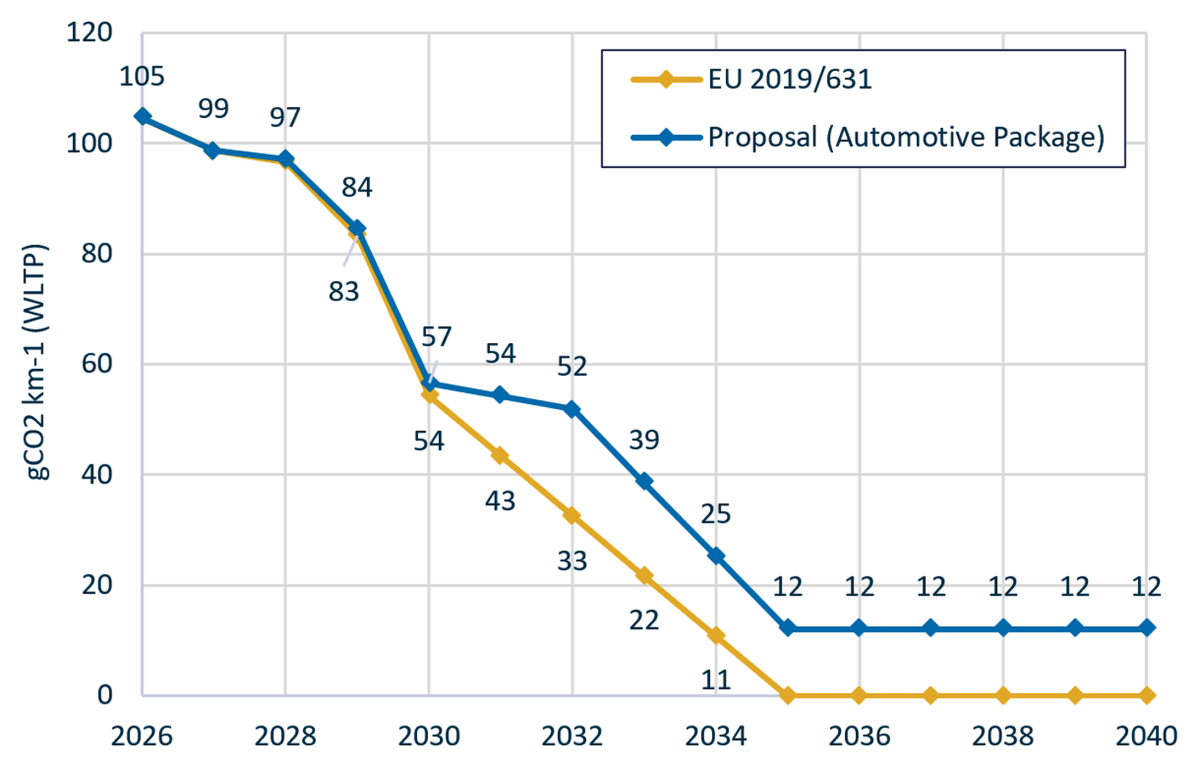
Figure 2
EU CO2 emission standard pathways in Germany for regulation and proposal applied in TEMPS.
Table 5
Difference in the price adjustment parameter C between BEV and ICEV in scenario REF and AP.
| PARAMETER | 2030 | 2031 | 2032 | 2033 | 2034 | UNIT |
|---|---|---|---|---|---|---|
| ΔC REF | 1,821 | 4,280 | 6,262 | 10,582 | 6,262 | EUR2024 |
| ΔC AP | 914 | 1,366 | 914 | 2,268 | 1,815 | EUR2024 |
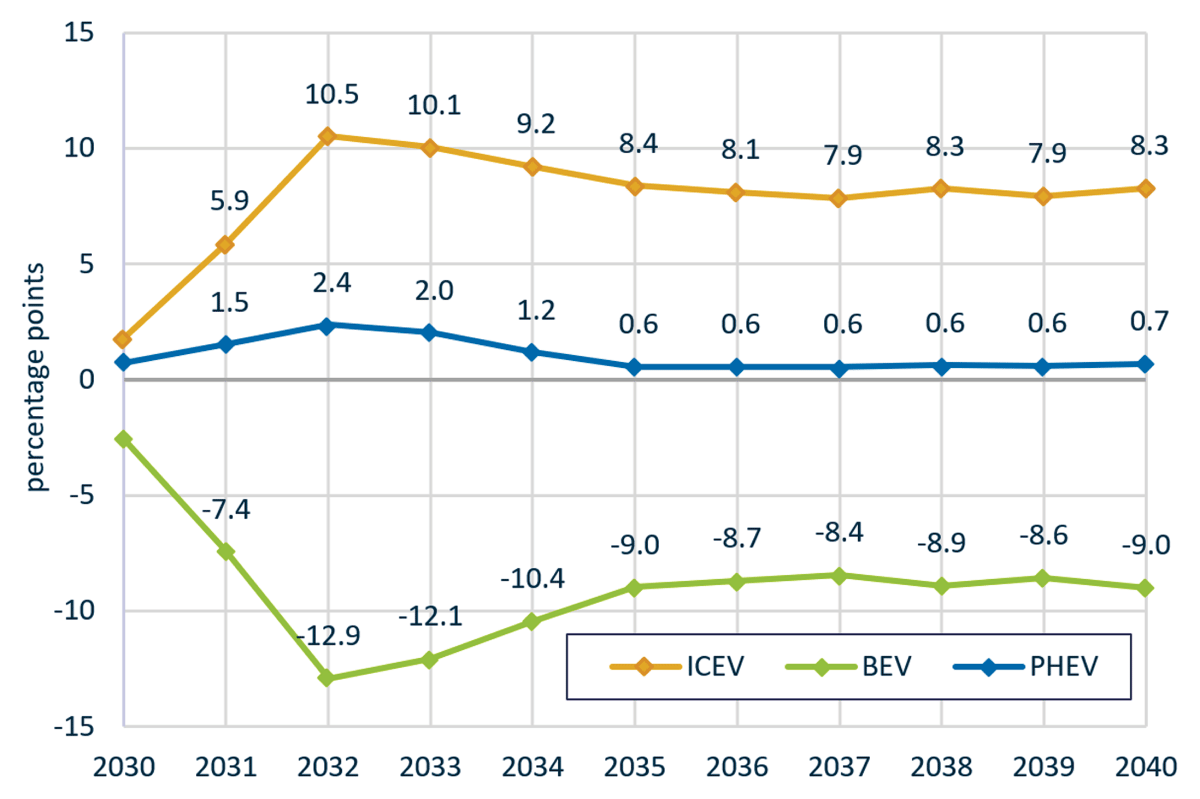
Figure 3
Difference of the powertrain share of newly registered cars (scenario AP vs. REF).
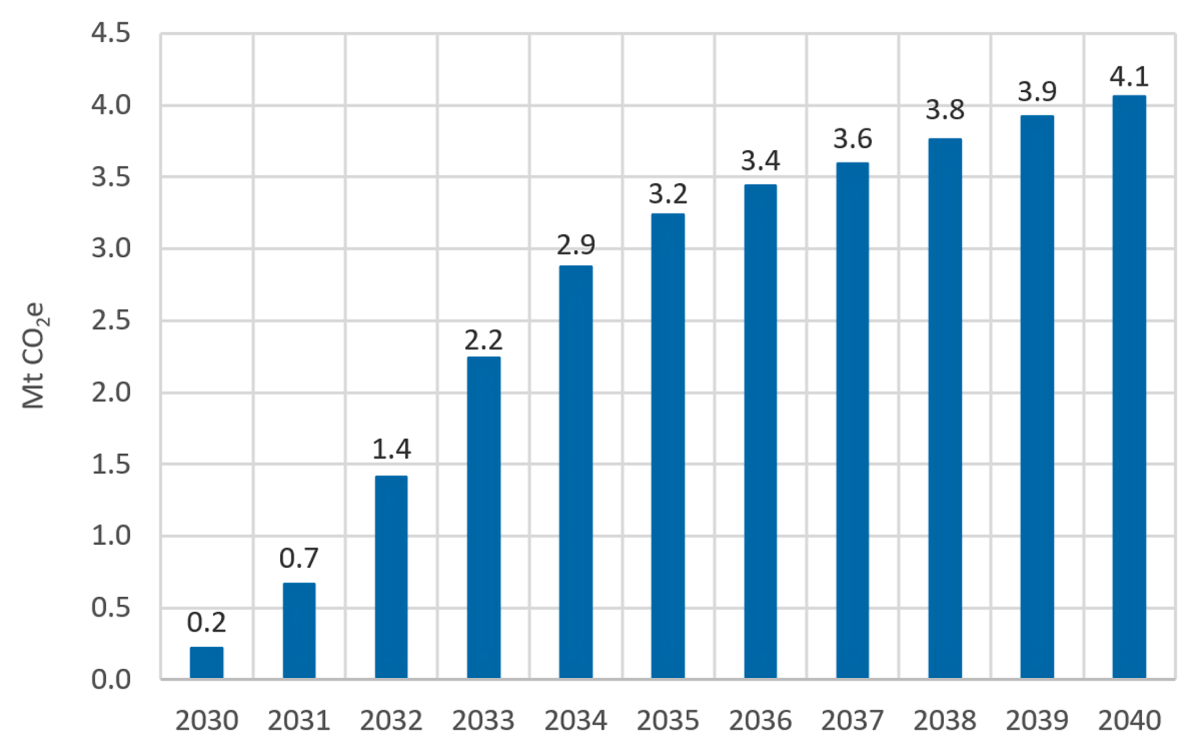
Figure 4
Difference in GHG emissions of the German transport sector between scenario REF and AP.
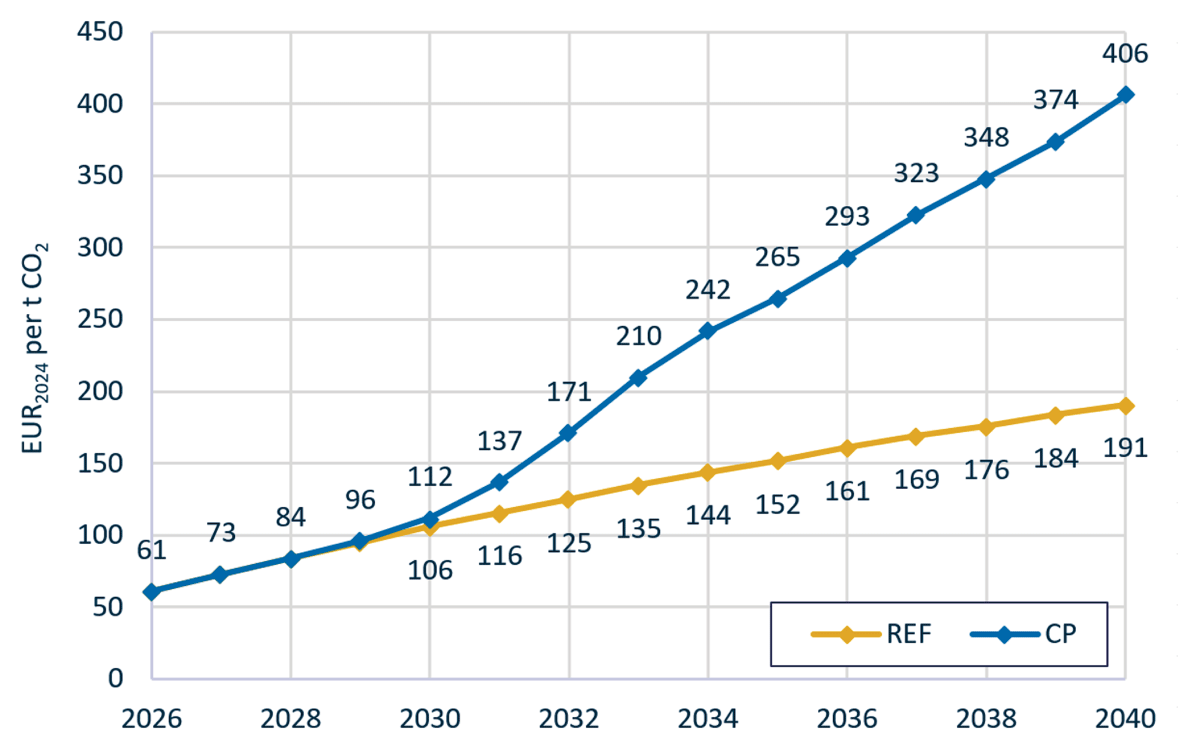
Figure 5
CO2 price pathways of scenarios REF/AP and CP.