
Introduction
European Climate Law obliges the European Union to achieve climate neutrality by 2050 and mandates a reduction in greenhouse gas emissions of at least 55% by 2030 compared with 1990 levels (European Union 2021). With 27% of total EU greenhouse gas (GHG) emissions in 2023, domestic transport has become the largest emitting sector (EEA 2026). In this context, the CO2 emission standards for cars and vans under Regulation 2019/631 (2019) represent a key policy instrument for electrification and emission reduction in light-duty vehicle transport. The regulation defines fleet-wide CO2 reduction targets for vehicle manufacturers and requires that all new passenger cars registered from 2035 onwards be zero-emission vehicles under the Fit for 55 policy framework. Despite this regulatory framework, projections from several Member States indicate that emission reductions in domestic transport are likely to be insufficient to meet the national targets defined under the Effort Sharing Regulation (ESR), which sets binding annual greenhouse gas reduction targets for sectors not covered by the EU Emissions Trading System (EC 2025a). In Germany, the transport sector has consistently failed to meet its annual CO2 reduction targets as defined in the German Federal Climate Change Act (KSG 2021). According to emission projections from 2025, the transport sector is expected to exceed its emission budget for the years 2021–2030 by 169 Mt CO2e (UBA 2025a). In addition, Germany is projected to exceed its ESR target by 224 Mt CO2e by 2030.
At the same time, a controversial debate has emerged regarding a potential weakening of the CO2 emission standards for passenger cars and vans for the years 2030 and 2035 due to the current economic challenges of the automotive industry in Europe. Proposals to relax these targets – whether through delayed phase-out timelines, expanded crediting mechanisms and flexibilities, or the introduction of certificates for e-fuels – could significantly affect market dynamics, investment certainty in zero emission vehicle technologies, and the trajectory of emission reductions. On 16 December 2025, the European Commission presented a proposal to amend Regulation (EU) 2019/631 (EC 2025b) as part of the Automotive Package (EC 2025a). The proposal introduces additional flexibilities for manufacturers in meeting the 2030 and 2035 targets, “super credits” for small zero emission vehicles “Made in the EU”, and a reduced level of ambition for the 2030 target for vans (for details see Section 3.1). This weaker regulatory pathway for the transformation towards zero emission vehicles could necessitate higher CO2 prices to compensate for the reduced mitigation effect of the CO2 emission standards, as modelling studies show that less stringent complementary policies lead to substantially higher required carbon price levels to achieve comparable emission reductions (Günther et al. 2026). This could, in turn, lead to distributional and social challenges associated with rising fuel costs, particularly for low-income households, as a large body of empirical literature shows that carbon pricing often has uneven and frequently regressive impacts across income groups (Ohlendorf et al. 2021). These effects are particularly relevant in the transport sector, where higher fuel prices directly affect household expenditure and mobility behaviour. At the same time, technology lock-in effects may arise, as lower-income households often face greater financial constraints in adopting low-emission vehicle technologies (CE Delft 2022; adelphi consult; Oeko-Institut; WiseEuropa; Center for the Study of Democracy 2023).
This paper uses the scenario model TEMPS (Transport Emissions and Policy Scenarios) to analyse the implications of the weakened regulatory pathway proposed by the European Commission. The analytical approach has four main elements. First, it translates the Commission proposal into an annual trajectory of effective fleet-average CO2 emission limits for Germany, documenting the assumptions required to operationalise the proposed flexibilities. Second, it provides a detailed description of the TEMPS modelling framework and, in particular, of the model mechanisms used to represent compliance with fleet-average CO2 emission standards through endogenous, revenue-neutral vehicle price adjustments. Third, it applies the model to quantify the effects of weakening the standards on vehicle pricing, powertrain choice and tank-to-wheel greenhouse gas emissions. Fourth, it derives a specific compensation pathway by iteratively adjusting the CO2 price until the additional emissions resulting from the weakened standards are offset in Germany through 2040. The analysis does not provide a comprehensive comparison of alternative policy mixes but isolates the interaction between fleet standards and carbon pricing under otherwise unchanged scenario assumptions. The description of the TEMPS model mechanics focuses on passenger cars. Light commercial vehicles are also represented in the model and are included in the reported emission and CO2 price results.
Modelling framework
Purpose and scope
The scenario model TEMPS enables long-term projections of vehicle stock development, final energy demand, and GHG emissions in the German transport sector until 2050. The model incorporates a wide range of policy and techno-economic framework conditions (e.g. EU CO2 emission standards, the Renewable Energy Directive and its national implementation as GHG quota, and cost reductions of new powertrain technologies), allowing detailed projections and the assessment of policy impacts on fleet composition, energy use, transport activity, and GHG emissions. TEMPS is used in scenario analyses to evaluate strategies for achieving climate policy targets and to support policy advice. A key application is the projection of GHG emissions in the German transport sector for official reporting by the federal government to the European Union (Oeko-Institut 2025), as well as for policy advisory work and the development of both prognostic and target scenarios, such as electrification strategies in road freight transport (Oeko-Institut 2023) and transformation pathways towards a climate-neutral Germany by 2045 (UBA 2025b). The model focuses on transport emissions as defined in the sectoral logic of the German Climate Change Act (KSG). Consequently, GHG emissions are modelled under a tank-to-wheel perspective for domestic transport, i.e. for road and rail transport, coastal and inland shipping, and domestic aviation. Transport activity is reported according to the territorial principle (i.e. domestic activity), while vehicle stock data follow the residency principle (vehicles registered in Germany). To meet the requirements for open data and open code, a phased release of the code is planned but has not yet been implemented.
Model architecture and components
TEMPS is a simulation model that combines a total cost of ownership (TCO) model with a logit model within an agent-based framework, explicitly accounting for political, technical, and economic constraints. An overview of the model structure is provided in Figure 1. As the impact of the EU CO2 emission standards is determined through the modelling of new vehicle registrations, this paper focuses on this component of the modelling methodology.
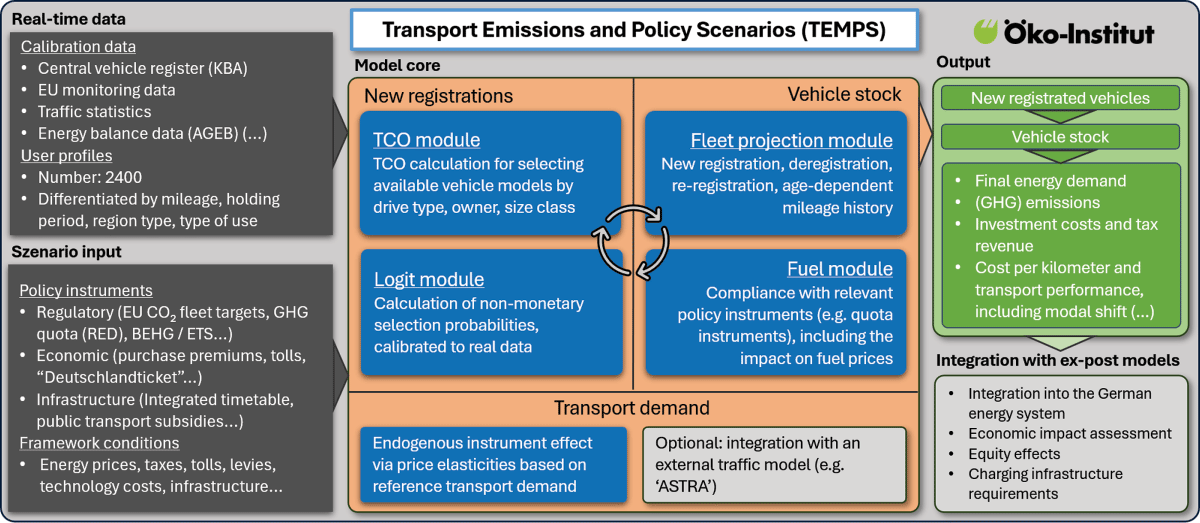
Figure 1
Overview of the structure of the TEMPS model.
The core elements of the new-registration module are the TCO model and a calibrated logit model, which together represent purchase decisions for passenger cars, light commercial vehicles, and trucks across 2,400 usage profiles. The cost components considered in the TCO model are listed in Table 1 and are calculated separately for each profile.
Table 1
Components of the TCO-calculation.
| INVESTMENT COSTS | RUNNING COSTS |
|---|---|
|
|
Importance is attached to the purchase price, which is also treated as an iterative variable in relation to compliance with CO2 emission standards. For each profile, all TCO components are aggregated and discounted over the vehicle holding period. Subsequently, the most cost-effective vehicle model is identified for each powertrain technology. The Logit model complements the TCO model by covering powertrain-specific factors such as comfort, habit and popularity that are not captured by monetary parameters. Equation (1) describes the function used to determine the selection probability for each powertrain technology. P denotes the probability that user profile j purchases vehicle x with powertrain type i, while val(x) represents the value function derived from the TCO of the respective vehicle.
The value function included in the equation depends, inter alia, on the logit parameters, the owner group (commercial or private), and the planned mileage profile of the purchasers. The logit parameters are not derived from external sources but are calibrated endogenously by fitting the model to observed vehicle registration data, ensuring that simulated technology shares reproduce recent market outcomes. For emerging powertrain technologies, it is assumed that their attractiveness gradually converges to that of established technologies in the long term. Based on the resulting selection probabilities, the powertrain and efficiency structure of new vehicle registrations can be determined. Vehicle stock dynamics are subsequently derived using survival curves, which form the basis for calculating final energy demand and GHG emissions, as well as all other output parameters. Other transport modes such as rail, shipping, aviation, buses, motorcycles, bicycles, and walking are modelled based on trends in powertrain development and efficiency improvements.
Changes in the average per-kilometre costs of transport modes (resulting from policy instruments or other measures) lead to modal shifts in TEMPS using cross-price elasticities between transport modes. Total transport demand responds to price changes according to a price elasticity of –0.3 (IVT 2004). Travel demand shifts to other modes of transport, particularly public transport as well as walking and cycling; transport avoidance is also considered. TEMPS can also exogenously integrate transport activity data from other models; however, this option is not pursued in the present analysis. Further details on model components beyond the scope of this paper are documented in the official model description (Oeko-Institut 2026).
Data sources
To ensure high quality and precision in the modelling results, TEMPS uses a wide range of data and statistics for detailed representation of the current market, calibration of key model parameters such as logit factors, and forecasting of energy and technology costs. Table 2 lists some of the key data sets and their use in the model.
Table 2
Key data sources used by the TEMPS model.
| NAME DATA SET | USE IN MODEL | SOURCE |
|---|---|---|
| MOP | User profiles | KIT 2021 |
| MiD 2017 | User profiles | Infas 2018 |
| KiD 2010 | User profiles | BMVI 2010 |
| Fahrleistungserhebung 2014 | User profile mileage | BASt 2015 |
| Energiebilanz für Deutschland | Calibration of final energy demand | AGEB 2025 |
| Verkehr in Zahlen | Traffic demand | KBA 2024 |
| EU-Monitoring-Datenbank | Calibration of new registrations | EEA 2025b |
| Zentrales Fahrzeugregister | Vehicle stock and age structure, survival curves | KBA n.d. |
| Techno-economic assumptions of the PRIMES-TREMOVE transport model | Technology costs of vehicles | JRC 2024 |
| Mineralölstatistik | Short-term validation of energy demand | BAFA 2025 |
| Automatische Dauerzählstellen | Short-term validation of transport demand | BASt 2026 |
| Rahmendaten Projektionsbericht | Energy prices, GDP, population, deflator | UBA 2026b |
| Fuel Quality Directive | Emission factors | EEA 2025a |
| Generalzolldirektion | Renewable fuel volumes | GZD 2026 |
Implementation of EU CO2 emission standards
Legal framework and assumptions
The currently valid legal framework of the EU CO2 emission standards for passenger cars and vans (EU 2019/631) establishes binding reduction targets for the specific CO2 emissions of newly registered vehicles, expressed in grams per kilometre (g CO2 km–¹). The targets for passenger cars are defined in five-year intervals up to 2035 (2025: –15%, 2030: –55%, 2035: –100%) and are referenced to the average emissions of new vehicle registrations in the baseline year 2021 (116 g CO2 km–¹), measured according to the Worldwide Harmonized Light-Duty Vehicles Test Procedure (WLTP). Vans follow the same emission reduction pathway except for a slightly lower 2030 target (–50%).
In December 2025, the EU Commission presented its Automotive Package (EC 2025b) with proposed amendments to the CO2 emission standards for cars and vans (EC 2025c) being one of the main elements of the legal package. These amendments include additional flexibilities for manufacturers in reaching the 2030 and 2035 targets, the introduction of “super credits” for small zero-emission cars (up to 4.2 metres in vehicle length) that are “Made in the EU”, and lowering the level of ambition for the 2030 target for light commercial vehicles. The additional flexibility for the 2030 target foresees that manufacturers need to reach the 2030 target for the average of the years 2030 to 2032. Consequently, overshooting the target in 2030 can be compensated for in years 2031 and/or 2032. The additional flexibility for the 2035 target allows manufacturers to reduce their fleet emissions to –90%, while the remaining 10% will need to be compensated for using low-carbon steel “Made in the EU” (maximum compensation up to 7%) in the vehicle production process or renewable fuels (maximum compensation up to 3%). Moreover, the proposal foresees that small zero-emission cars “Made in the EU” gain “super credits” by counting these vehicles as 1.3 vehicles when calculating manufacturers’ fleet emissions. Lastly, the proposal reduces the 2030 target for light commercial vehicles to –40%.
In TEMPS, the proposed amendments are incorporated as follows. For the additional flexibility for the 2030 target, the level of overshooting equals – in relative terms – the level of overshooting for the year 2025, both for cars (4%) and light commercial vehicles (13%) (ICCT 2026). This overshooting is assumed to be compensated in 2032 while the 2030 target is assumed to be exactly met in 2031. For the additional flexibility for the 2035 target, the maximum compensation of 10% is assumed to be reached resulting in a 2035 target of –90%. For the “super credits”, the share of small zero-emission cars “Made in the EU” in the total number of newly registered small zero-emission vehicles in Germany is assumed to be 50% in 2027. For the scenario modelling, this assumed share for 2027 is based on an analysis of the TOP50 new zero-emission car model registrations in Germany in 2025. In 2025, the share of small zero-emission cars produced in EU factories in all TOP50 new small zero-emission cars was 42%. This share is assumed to increase linearly from 50% in 2027 to 80% in 2034. This results in an implied factor for all newly registered small zero-emission cars in the average emission calculation to be 1.15 in 2027 up to 1.24 in 2034. Vehicle manufacturers are required to comply with EU-wide emission targets. The relative deviation of emission from newly registered cars in Germany versus EU average is shown in Table 3. Except for 2021 and 2022, the average emissions in Germany have been above the EU average (ICCT 2025). As reliable assumptions regarding future developments cannot be made, the most recently available value is assumed to remain constant.
Table 3
Relative deviation of emissions from newly registered vehicles in Germany versus EU.
| 2018 | 2019 | 2020 | 2021 | 2022 | 2023 | 2024 | |
|---|---|---|---|---|---|---|---|
| Relative deviation in % | 7.9 | 6.2 | 4.7 | –1.7 | –3.6 | 5.1 | 9.6 |
Considering all mentioned aspects, an effective CO2 emission standard pathway can be derived for newly registered cars in Germany according to the regulation EU 2019/631 and the proposed amendment (Figure 2) as used in the following scenario analysis. Relevant differences between the scenarios arise from 2030 onwards, so that the period from 2030 onwards is examined for the following analyses.
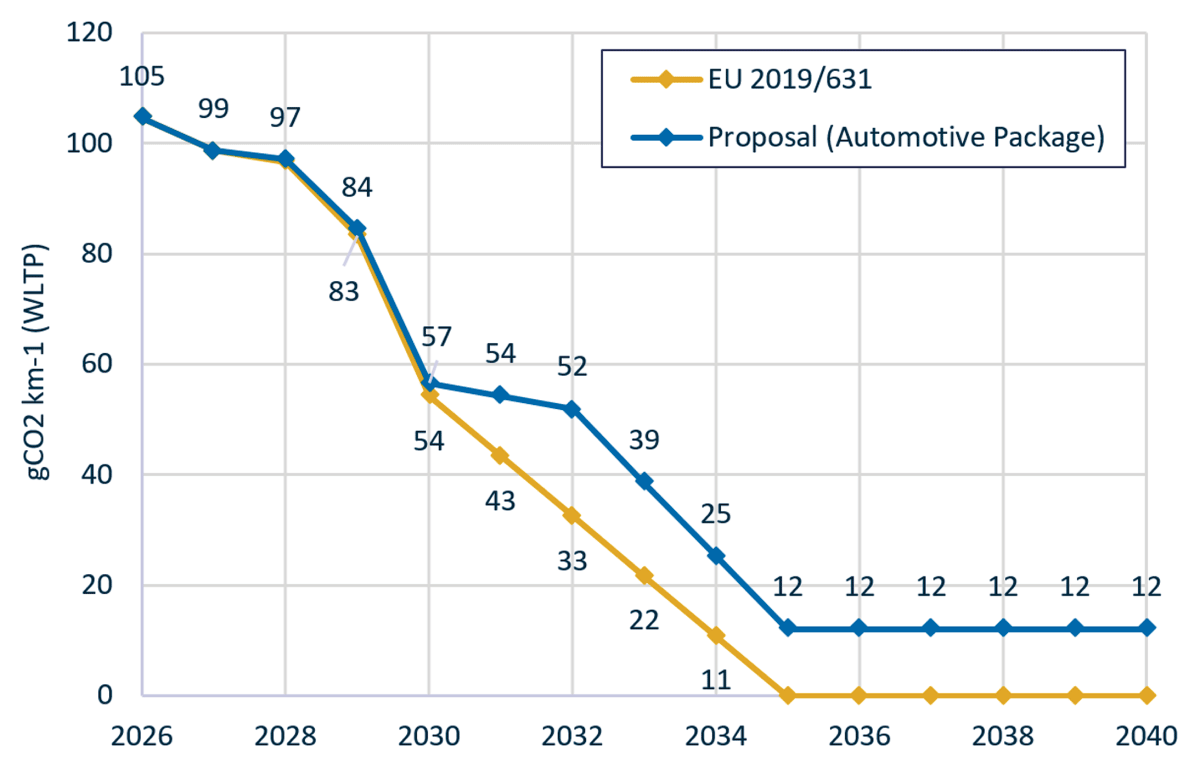
Figure 2
EU CO2 emission standard pathways in Germany for regulation and proposal applied in TEMPS.
It is assumed that vehicle manufacturers will comply with the EU fleet emission targets to avoid regulatory penalties. Furthermore, manufacturers are assumed to influence compliance with emission fleet limits through revenue-neutral price adjustments if the modelled vehicle fleet is failing to meet the targets. Specifically, sales of high-emission vehicles are assumed to be moderated through price surcharges, while sales of low-emission vehicles are stimulated through price reductions, such that the resulting average fleet emissions correspond to the regulatory target value. The TEMPS model calculates the average emissions of the entire fleet of newly registered vehicles in Germany. No differentiation is made between individual manufacturers or manufacturer pools.
Model formulation
For each modelling year, TEMPS first applies the TCO and logit models (see Section 2.2) to determine, using a bottom-up approach, the powertrain and efficiency choices for new vehicle registrations and the resulting average fleet emissions Efleet (g CO2 km–1), as shown in Equation (2). Here P denotes the logit choice probability of powertrain j with efficiency level ϑ for profile i, s is the statistic weighting factor of profile i and E the specific emissions of the respective powertrain.
The emission difference ΔE (g CO2 km–1) relative to the target value for the respective year is then calculated using Equation (3), considering the relative deviation in emissions from newly registered vehicles in Germany compared with the EU average δDE (see Table 3). To reduce computational effort, a tolerance threshold of τ = 0.3 g CO2 km–1 is applied.
If ΔE > 0, an iterative procedure is initiated to achieve compliance with the target limits, implemented through an agent-based approach based on representative usage profiles. For each profile i, all available propulsion options j and efficiency variants ϑ are evaluated. For every combination of these parameters, a price adjustment C (EUR) is calculated using the iteration factor f (EUR g CO2–¹), which is determined within the iterative process as shown in Equation (4).
The price adjustment parameter C is incorporated into the purchase price, thereby altering the TCO for all usage profiles. Subsequently, the new-registration modelling is recalculated using the TCO and logit models. As a result of the adjusted prices, the usage profiles select different vehicle efficiencies or powertrain options, leading to a new average fleet emission value Efleet. These steps are repeated iteratively until the fleet emission targets are met. At the same time, it is ensured that the applied surcharges and rebates balance out in aggregate, so that the manufacturers’ influence on fleet emissions remains revenue neutral to prevent an exogenous change in aggregate manufacturer revenues. It can be interpreted as a stylised representation of cross-subsidisation between higher- and lower-emission vehicles. The mechanism does not aim to reproduce the strategy of an individual manufacturer but assumes that manufacturers avoid penalties by adjusting relative vehicle prices in a way that increases ZEV registrations.
Scenario design
Three scenario simulations (REF, AP, and CP) are conducted using the TEMPS model. The scenario REF is based on the “MMS” scenario from the German Projection Report 2026 (UBA 2026a), which serves the reporting obligations under the EU Governance Regulation and the German Federal Climate Change Act. REF adopts the report’s underlying framework assumptions (UBA 2026b) and policy instruments (UBA 2026c). In scenario AP the objective is to analyse the effects of weakening the EU CO2 emission standards in line with the proposal by the European Commission on emissions and fleet composition (automotive package). Subsequently in scenario CP, a CO2 price pathway is determined iteratively that compensates for the change in emissions resulting from the modified fleet emission limits. The definition of the scenarios is presented in Table 4. It should be noted that the resulting CO2 price pathway is only one compensation possibility. Other policy mixes involving charging infrastructure, purchase incentives, public transport investment, transport-demand measures, differentiated road pricing, renewable fuels or combinations of these instruments could also partly compensate for the additional emissions. Their effectiveness, costs and distributional implications are not compared in this study. The modelling range is 2026 to 2040 in annual resolution. As outlined in the research objective, the analysis focuses on passenger cars. Nevertheless, the modelling also captures the effects of the regulation on vans, which are reflected in the resulting emissions and CO2 price trajectories.
Results
Compliance with the CO2 emission standards in TEMPS is achieved, as described above, through price surcharges and rebates applied to vehicle purchase prices. A weakening of the standards, as implemented in Scenario AP, therefore results in a weaker activation of this mechanism. Table 5 presents the difference of the model-endogenous price adjustment parameter C between battery electric vehicles (BEV) and internal combustion engine vehicles (ICEV) for scenarios REF and AP.
Table 5
Difference in the price adjustment parameter C between BEV and ICEV in scenario REF and AP.
| PARAMETER | 2030 | 2031 | 2032 | 2033 | 2034 | UNIT |
|---|---|---|---|---|---|---|
| ΔC REF | 1,821 | 4,280 | 6,262 | 10,582 | 6,262 | EUR2024 |
| ΔC AP | 914 | 1,366 | 914 | 2,268 | 1,815 | EUR2024 |
The price adjustment parameter C directly affects the total cost of ownership (TCO) through the purchase price component. As ΔC decreases, the purchase price difference between ICEV and BEV is reduced, thus lowering the TCO of ICEV relative to BEV. As a result, ICEV become more attractive in the cost-based vehicle choice of the usage profiles. This leads to a markedly different powertrain composition of newly registered passenger cars in Scenario AP. Figure 3 illustrates the resulting changes in the shares of ICEV, BEV, and plug-in hybrid vehicles (PHEV), expressed in percentage points relative to Scenario REF.
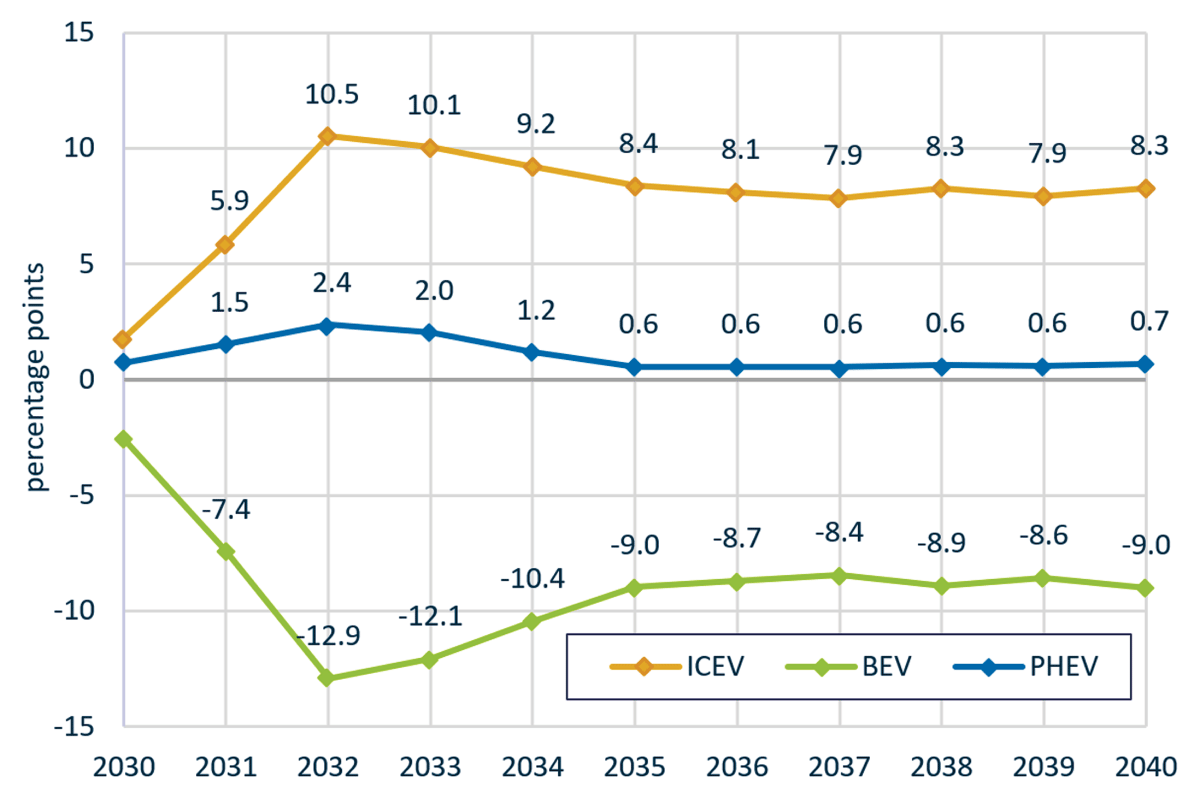
Figure 3
Difference of the powertrain share of newly registered cars (scenario AP vs. REF).
The largest deviation occurs in 2032, when BEV registrations are 13 percentage points lower and ICEV registrations are simultaneously 11 percentage points higher than in REF. In the following years, the magnitude of the changes in the new-registration structure decreases slightly and then stabilises at a relatively constant level. The subsequent increase in BEV and PHEV shares correlates with the difference between the fleet emission limit trajectories in scenarios REF and AP. In addition to this shift in powertrain shares, the reduced price adjustment parameter on ICEV also affects the efficiency composition of newly registered combustion vehicles. Within the TCO optimisation across vehicle options, some user profiles select less efficient ICEV variants with lower purchase prices, even though these vehicles incur higher fuel costs over the holding period. Consequently, the average efficiency of newly registered ICEV declines in Scenario AP, which further contributes to higher emissions. The effect peaks in 2033 with +4.4 g CO2 km–1. The resulting changes in the structure and efficiency of new vehicle registrations cumulatively affect the composition of the passenger car fleet over time and, consequently, its GHG emissions. The emission difference between scenarios AP and REF emerges from 2030 onwards and increases to 4.1 Mt CO2e in 2040 (Figure 4). Over the entire modelling period, this corresponds to cumulative additional emissions of 29.4 Mt CO2e.
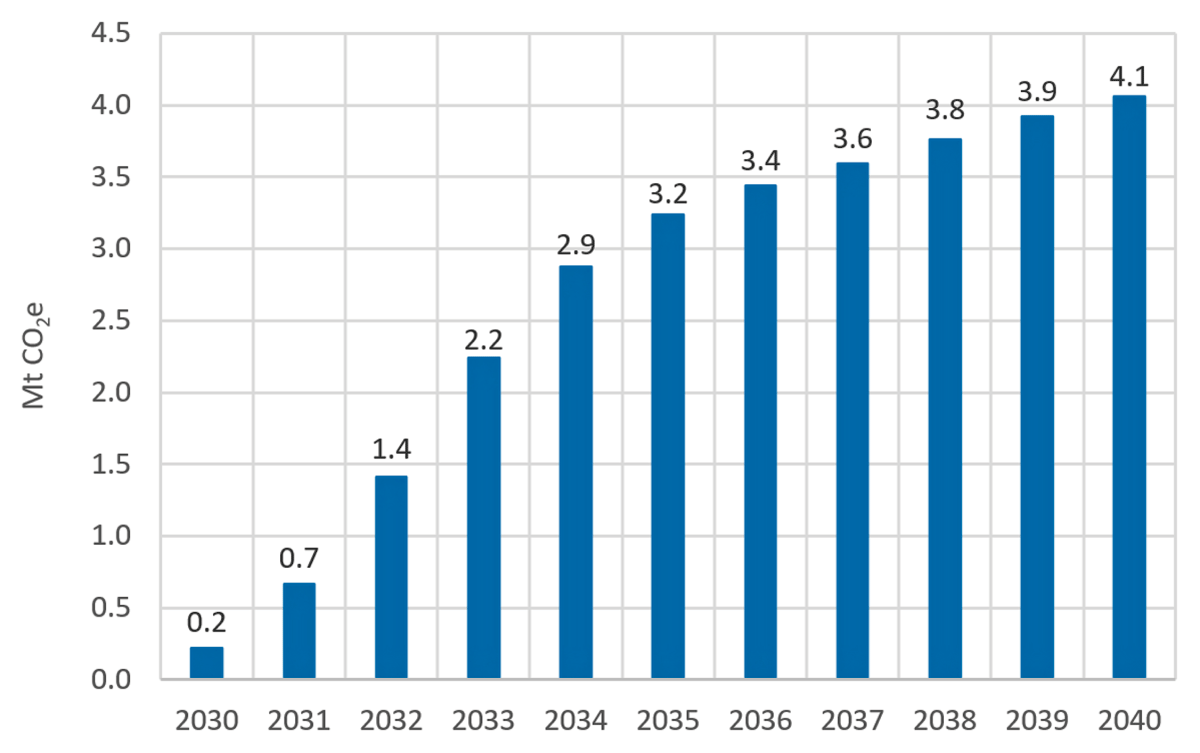
Figure 4
Difference in GHG emissions of the German transport sector between scenario REF and AP.
Scenario CP is the result of a series of iterative model runs conducted to determine the CO2 price trajectory required to offset the higher emissions resulting from the weakened fleet emission standards. By construction, the difference in GHG emissions between Scenario CP and REF is therefore zero. In TEMPS, a higher CO2 price affects the system through several channels. The most significant effect arises from increasing per-kilometre costs for ICEV. Given the assumed price elasticity of transport demand, higher kilometre costs lead to a reduction in passenger car travel demand. Part of the transport demand is shifted to other transport modes (public transport, walking and cycling). Due to the lower emission intensity of these modes, overall GHG emissions decline in the scenario. The CO2 price also increases the fuel cost component of ICEV, which leads to a slight shift in the powertrain composition of new vehicle registrations. However, since fuel costs account for only a relatively small share of the total cost of ownership in passenger car transport (e.g. around 15–20% for a medium-sized ICEV over a holding period of five years), this effect remains limited. In addition, powertrain choice in private motorised transport is not assumed to be purely economically rational; this behaviour is represented in TEMPS through the logit parameters of the vehicle choice model which are calibrated with the most recent empirical data of the new vehicle fleet. The CO2 price trajectory derived iteratively for Scenario CP is shown in Figure 5 in comparison with scenarios REF and AP.
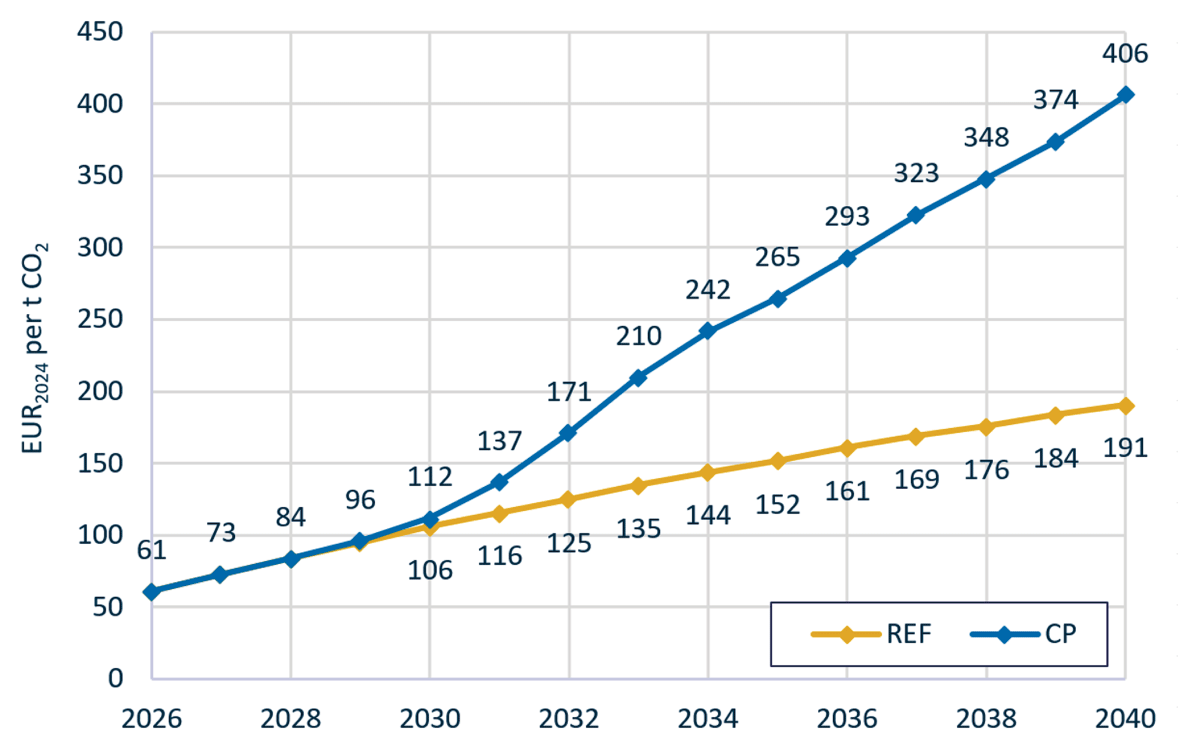
Figure 5
CO2 price pathways of scenarios REF/AP and CP.
To offset the additional emissions, a substantially higher CO2 price is required. By 2040, the price trajectory approximately doubles, reaching €406 compared with €191 in the reference scenario. This increase in the CO2 price leads to a reduction in passenger car travel demand. By 2040, passenger car vehicle kilometres travelled decline by 14.9 billion kilometres, or 2.6%.
Discussion
The results indicate that a relaxation of the regulatory trajectory substantially slows down electrification of the car and van fleet and, consequently, results in higher GHG emissions in the transport sector compared to the reference case of the currently effective regulatory framework. Offsetting these additional emissions would require further mitigation through other policy instruments. Carbon pricing under the proposed ETS2 is one such instrument. However, under the assumptions implemented in TEMPS, fully compensating for the additional emissions associated with weaker CO2 emission standards would require a substantially higher CO2 price trajectory that partially shifts mitigation from vehicle fleet electrification to a more pronounced mode shift and reduced transport distances. These findings highlight the strong interaction between CO2 emission standards and carbon pricing in the transport sector and supports the argument that carbon pricing must be aligned with complementary policies (Günther et al. 2026). TEMPS does not yet differentiate households by income and therefore does not directly quantify the distributional incidence of the higher fuel costs in Scenario CP. Nevertheless, existing literature and the application of ex-post models indicate that transport carbon pricing has regressive effects, particularly where lower-income households have limited access to alternative transport modes or low-emission vehicles (Ohlendorf et al. 2021). Higher fuel costs also increase the risk of transport poverty and reduced social participation among vulnerable households (adelphi consult; Oeko-Institut; WiseEuropa; Center for the Study of Democracy 2023). A CO2 price trajectory such as the one required in Scenario CP therefore appears politically difficult to sustain without additional policy instruments addressing distributional impacts. Within the scenarios analysed, the results show that effective CO2 emission standards reduce the mitigation burden placed on carbon pricing and demand-side responses.
The modelling results also indicate potential implications for the automotive industry – the weakening of CO2 emission standards is expected to lead to less aggressive pricing strategies for battery electric vehicles, as shown by the TEMPS model. The modelling also shows that both ICEV and PHEV are increasing their new registration shares compared to the current regulatory framework. If, for example, higher profit margins can be achieved with PHEV than with ICEV, the distribution between PHEV and ICEV may also change significantly in the years after 2030. Market shares of 20% for PHEV from 2035 onwards are still possible with the proposed adjustments to CO2 emission standards of the Automotive Package. In the TEMPS model, an increased popularity of PHEV, i.e. customers increasingly choose this powertrain option when purchasing new cars despite higher prices and less favourable TCO, would require an adjustment of the corresponding logit parameters. Non-economic factors, such as the perception of the availability of charging infrastructure or the public image of different powertrain options, can be represented reasonably well in the short-term using recent vehicle registration data for logit calibration. However, projecting the evolution of such behavioural factors over longer time horizons remains challenging.
Furthermore, it should be noted that this analysis is based on a tank-to-wheel perspective, focusing on direct emissions from vehicle operation and aligning with regulatory accounting frameworks such as the Effort Sharing Regulation and the logic of the German Federal Climate Change Act. A well-to-wheel perspective would additionally include upstream emissions from fuel and energy supply, which can be substantial for electricity, hydrogen, and synthetic fuels depending on their production pathways (Publications Office of the European Union 2020). Accounting for these emissions affects the magnitude of emission reductions and the relative performance of technologies across scenarios. However, in an increasingly decarbonized energy system, the omission is unlikely to alter the qualitative conclusions.
Generally, the quantitative results should be interpreted as conditional scenario estimates rather than point predictions. In particular, the CO2 price trajectory derived for Scenario CP depends on assumptions regarding the price elasticity of transport demand, cross-price elasticities between transport modes, the responsiveness of vehicle choice to TCO differences, the calibration and long-term development of the logit parameters, and the representation of manufacturer compliance behaviour. A lower absolute transport-demand elasticity or weaker modal-shift responses would increase the CO2 price required to compensate for the additional emissions, whereas stronger responses would reduce it. Similarly, weaker responsiveness of vehicle choice to TCO differences would further limit the effect of carbon pricing on powertrain uptake. The resulting value of €406 in 2040 should therefore be understood as the outcome of the scenario assumptions implemented in TEMPS, rather than as a precise forecast of the future ETS2 price. In practice, manufacturers may also respond through heterogeneous profit margins, changes in the model portfolio, pooling arrangements, credit transfers, market-specific pricing, supply restrictions or the temporary acceptance of penalties. These strategies could alter both the magnitude and the distribution of price adjustments and may therefore lead to different powertrain shares. The results presented here are conditional on full compliance through the price-mediated mechanism implemented in TEMPS.
Finally, this paper does not address the potential additional GHG emission mitigation impact of an increase in renewable fuel shares. A higher CO2 price improves the economic viability of renewable fuels and could therefore reduce the CO2 price increase required to compensate for weaker fleet standards. However, since the future structure of the GHG quota in Germany has not yet been determined for the period after 2030, this paper does not consider different renewable fuel shares in the different scenarios. Under the Commission proposal, manufacturers would be required to reduce the emissions of new cars and vans by 90% relative to 2021 from 2035 onwards. The remaining 10% could be covered through credits for certain renewable fuels and low-carbon steel. Potential emission reductions associated with these mechanisms are not included in the present analysis. However, the extent to which these compensation mechanisms will result in additional GHG emission savings is also controversial. The crediting of the use of renewable fuels in passenger cars and vans is primarily driven by national implementations of the RED. Higher renewable fuel shares are not triggered by the compensation mechanism of the CO2 emission standard proposal. Because the exact implementation of the crediting mechanism for using low-carbon steel in vehicle production is still unclear today, no assessment can be made whether this would generate emission reductions beyond the baseline decarbonisation of EU steel production.
Conclusion
This study analyses the implications of weakening the EU CO2 fleet emission standards for passenger cars and vans as it is proposed in the Automotive Package from December 2025 for the German transport sector using the TEMPS model. The results show that a relaxation of the current regulatory trajectory substantially slows down the electrification of the car and van fleet, leading to an increase in cumulative GHG emissions of 29.4 Mt CO2e through 2040 compared to the reference scenario. Under the assumptions implemented in TEMPS, compensating for these additional emissions would require a substantial increase in CO2 prices under ETS2, with model results indicating that prices would need to approximately double by 2040, reaching €406 compared with €191 in the reference scenario. This compensation is achieved primarily through lower passenger-car transport activity and modal shift, while the effect of the higher CO2 price on powertrain choice remains comparatively limited. These quantitative results are conditional on the behavioural elasticities, TCO assumptions, logit calibration and stylised manufacturer pricing mechanism represented in TEMPS. Moreover, they represent one specific compensation pathway and do not compare alternative policy mixes or quantify household-level distributional impacts.
The findings are consistent with existing literature highlighting the complementary roles of regulatory standards and carbon pricing within an effective policy mix. Within this analytical scope, the results indicate that weakening fleet standards shifts a substantially larger mitigation burden from vehicle technology deployment towards carbon pricing and demand-side adjustment. This does not imply that higher carbon prices are the only possible compensating instrument. Rather, the findings show that effective fleet standards can reduce the carbon-price increase and the demand-side responses required to achieve the same transport-sector emission outcome, supporting their role as an important component of a balanced policy mix. A stronger reliance on carbon pricing also raises significant distributional concerns. Existing literature suggests that higher fuel costs disproportionately affect low-income households and may exacerbate transport poverty. This underlines the political challenges associated with high CO2 price trajectories, as reflected in the ongoing debate on ETS2 design and accompanying compensation mechanisms.