
Introduction
Climate change, driven by rising greenhouse gas emissions, has necessitated a global shift toward sustainable energy systems, with the energy transition and energy efficiency at the core of these efforts. In the European Union, the strategic policy framework known as the European Green Deal defined the goal to achieve net-zero greenhouse gas emissions by 2050.
Transformers are critical to addressing climate change, enabling the energy transition, and improving energy efficiency by reducing energy losses and integrating renewable energy into the grid. They play a pivotal role in the EU’s energy infrastructure by adapting voltage levels for efficient electricity transmission and distribution between generation and end-use (European Commission, 2024).
There are various types of transformers. The Ecodesign Impact Accounting study categorizes transformers into distribution transformers (63% of the EU stock, 19% of losses), industry transformers (oil and dry, 17% of the stock, 19% of losses), small transformers (15% of the stock, 2% of losses), and power transformers (2% of the stock, 55% of losses) (Wierda and Zanuttini, 2024). Distribution transformers primarily serve households, while industry transformers are used in industrial applications, and power transformers handle high-voltage transmission (European Commission, 2024).
In the context of the energy transition, transformers can facilitate the integration of renewable energy sources like wind and solar into the grid by managing fluctuating inputs and ensuring reliable power delivery. Their impact extends beyond technical efficiency, as modern, low-loss transformers contribute significantly to decarbonisation efforts by reducing the energy required to meet demand. Energy losses of transformers accounted for 105 TWh in 2020, or 4% of the EU’s total electricity consumption (Wierda and Zanuttini, 2024). Transformers are therefore highly relevant within the EU’s climate and energy policies. In this way transformers have a lever effect in driving systemic change, as upgrading transformer technology can amplify the efficiency of the entire energy grid. By investing in advanced transformers, governments and industries can accelerate the energy transition.
Ecodesign regulations, such as (EU) 548/20141 and its amendments,2 have driven the development of more energy-efficient transformers, reducing electricity losses by 17% for units sold in 2020 and saving 5.7 TWh of electricity that year, with projected savings of 17 TWh by 2030 (European Commission, 2024).
Due to remaining shares of inefficient transformers, programmes that incentivise early replacement offer further saving potential. Such early replacement programmes can be defined as “a type of energy efficiency programme that pays […] an incentive to deactivate low-efficiency equipment and replace it with a new standard or high-efficiency equipment” (Gertsman and Kyllo, 2012, p. 183).
Early replacement of inefficient transformers is in many cases crucial for advancing the energy transition, but it requires quantifying the environmental and economic impacts. Only a quantification can estimate whether use-phase energy savings outweigh additional costs and environmental impacts associated with manufacturing and purchase of new energy-efficient transformers. This requires modelling tools that can estimate the impacts and are a comprehensive decision-support to stakeholders, including policymakers and industry representatives.
Replacing light bulbs before the end of their life cycle is a prominent example of early replacements (Gertsman and Kyllo, 2012; Liu et al., 2017). Policies such as the Energy Independence and Security Act (EISA) in the US have driven such early replacements of inefficient incandescent and halogen lamps with energy-efficient alternatives like light-emitting diodes (LEDs). Such policies highlight the importance of regulatory frameworks in accelerating the adoption of efficient lighting solutions to achieve energy and climate goals (Liu et al., 2017).
However, early replacements with more efficient models may not always yield environmental benefits when considering the whole life cycle, as a study on the early replacement of PV cells shows: the embodied carbon impact of new panels and the lost operational benefits of older panels often outweighed the gains. In regions with moderate solar irradiance and a low-carbon electricity grid, early replacement turned out generally unfavourable in contrast to areas with higher solar irradiance or carbon-intensive electricity grids (Galimshina et al., 2025).
Previous studies call for a careful assessment of local conditions and carbon payback times and emphasize that the benefits of early replacement depend, for instance, on the lifetime of the product (Galimshina et al., 2025; Gertsman and Kyllo, 2012).
To support informed decision-making in the case of transformers, decision-support tools are needed that not only evaluate product-specific scenarios of early replacement but are also accessible and understandable for target groups such as policymakers, industry stakeholders, and consumers. In our study, we define a “tool” as a structured procedure or method that provides analytical capability to support decision-making by assessing environmental, economic or social impacts.
A variety of tools already exist to support industrial and regulatory decision-makers in understanding the environmental and economic characteristics of transformers and related product groups, including the implications of early replacement. However, the question remains whether these tools are sufficiently tailored to the specific needs of target groups such as policymakers and industry stakeholders.
These needs differ substantially: industry stakeholders primarily require support for individual purchase or replacement decisions, meaning they need tools that compare costs, energy losses, and CO2 impacts for specific transformer units based on inputs such as rated power, load factor, and energy prices. Policymakers, by contrast, need to assess the system-wide effects of regulatory measures, such as efficiency standards or early replacement programmes, across entire national or regional transformer fleets, requiring stock-level modelling and scenario comparisons aligned with policy frameworks like EU Ecodesign regulations.
Furthermore, a lack of user-centric design and accessibility can result in limited adoption and reduced impact, hindering the tools’ ability to effectively guide sustainable decision-making. Our contribution therefore aims to identify relevant tools, analyse their scope and usability, and use these insights to identify functional gaps in the tool landscape in the context of early transformer replacement for environmental and economic benefits and derive general recommendations to design tools in a user-centric manner.
Methods
The methods section describes the process of identifying relevant tools for analysis and defining evaluation criteria.
Identification of relevant tools for analysis
Tools were identified via a web-based search, for which three criteria had to be fulfilled. First, the tool had to be transformer-specific, meaning that the object of assessment is explicitly a transformer. Second, the tools or its results had to be accessible for decision-makers, by being operable via a graphical user interface, a web-based application or spreadsheets for download. Third, the tools had to provide relevant decision-making support, e.g. by supporting purchase decisions for industrial stakeholders (e.g. cost-benefit analysis) or by indicating regulatory saving potential for policymakers (e.g. early replacement modelling or efficiency standard development).
A preliminary search in scientific databases showed that tools (or rather models) linked to a scientific publication often require coding expertise and do not provide a user-interface, while available tools for decision-makers are most-often not linked to a scientific publication. Therefore, the search was conducted as a general web-based query, with the caveat that it resulted in a very high number of search results. For example, the search query “tool calculator transformer efficiency economic ecological analysis TCO early replacement” resulted in 20,100 results on Google. The identification of tools via search engine prioritisation must therefore be understood as non-exhaustive, and while the results can indicate broader trends, the omission of individual tools cannot be excluded.
While acknowledging this limitation, six tools were identified that fulfil the above-mentioned criteria. The tools are listed in Table 1, with information on name and author and year of publication.
Table 1
List of identified tools for analysis.
| TOOL | NAME AND AUTHOR | YEAR OF PUBLICATION |
|---|---|---|
| Tool 1 | ABB Total Cost of Ownership calculator (ABB)3 | 2012 |
| Tool 2 | Green Transfo Transformer TCO Calculator (Green Transfo)4 | 2021 |
| Tool 3 | UNEP U4E TCO Calculator (UNEP U4E)5 | 2022 |
| Tool 4 | UNEP U4E Transformers Energy Efficiency Tool (UNEP U4E) | 2017 |
| Tool 5 | Appliance & Equipment Climate Impact Calculator (Mepsy) (CLASP) | 2018 |
| Tool 6 | EU Ecodesign Impact Accounting (EIA) (VHK) | Since 2005 |
| Tool 7 | EU-MORE motor model (EU-M3) (Academia) | 2019 |
In addition to the transformer-specific tools identified, one tool originally developed for a different but closely related product group—industrial electric motors—was also included in the analysis. The motivation for this extension was the lack of any dedicated early-replacement tool for transformers, despite early replacement representing an important decision-making challenge for both industrial stakeholders and policymakers. As a result, the search was broadened to neighbouring product categories that share key functional and regulatory characteristics with transformers. Industrial motors and power transformers are both energy-using products involved in electrical energy conversion, exhibit long operational lifetimes, and contribute substantially to system-level energy losses. They are subject to comparable policy frameworks, including Ecodesign regulations and efficiency class schemes, and both form part of the wider category of industrial electrical equipment. Because of these strong structural similarities in use patterns, regulatory treatment, and energy-efficiency improvement potential, the EU-MORE Motor Model, product of a research project (co-funded by the European Climate Infrastructure and Environment Executive Agency under the LIFE call, LIFE-2021-CET-POLICY, with grant agreement No. 101076631.), was considered relevant for inclusion. Its integration into the analysis enables the methodological gap in early-replacement modelling for transformers to be addressed while maintaining conceptual and functional consistency within the overall scope of this study.
Evaluation criteria
Existing frameworks
Different frameworks exist that can support the evaluation of decision-support tools.
To evaluate the interactions in a decision-support process between evidence providers and policymakers, the “Competence Framework for Policymakers and Researchers Working on Public Policy” mapped and assessed the capacities required to perform different institutional mechanisms that provide evidence for policymakers. The authors underline the necessity that the information needs of the policymaker are understood, and that the type and form of information offered by the scientists aligns with those needs. Evidence should be presented in “a way that informs policy options but does not determine policy development” (Gluckman et al., 2021).
Similarly, the Organisation for Economic Co-operation and Development (OECD) evaluation criteria form a widely used framework for assessing the merit and performance of policies, programmes, and projects, particularly in international development cooperation. Originally established by the OECD Development Assistance Committee (DAC), the framework comprises six criteria: relevance, coherence, effectiveness, efficiency, impact, and sustainability. These criteria provide complementary perspectives on an intervention by examining whether it addresses the right needs (relevance), aligns with other interventions and policy contexts (coherence), achieves its objectives (effectiveness), uses resources responsibly (efficiency), generates meaningful changes (impact), and ensures that positive results endure over time (sustainability) (OECD, 2026).
While the context of the decision-support in our analysis is in the field of environmental and economic impact assessment, therefore situated in the field of environmental engineering or economics, the assessment of effectiveness is rather situated in communication science.
When discussing the usability of a tool, it boils down to a communication between the user and the tool, where the user creates meaning based on the information provided, for example in understanding the environmental and economic implications of transformer replacement under stated assumptions. For the tools under analysis, they are multimodal, integrating multiple modes of communication—such as text, visuals, graphics, and design—into a cohesive and interactive format (such as a website) Click or tap here to enter text. Therefore, and while acknowledging that many different methodological approaches are possible for such analysis, we draw on research in multimodality to assess reception of a tool by the user beyond its mere factual information. Generally, research on meaning-making in multimodal research is derived on verbal data (e.g. interviews), knowledge test (information recall) and eye-tracking data (indicating how attention is allocated) (Bucher, 2025), finding that reception of multimodal discourse is recursive and non-linear. Meaning making occurs step by step, with different elements competing for attention, thereby posing a problem of selectivity for the recipient (Bucher, 2025).
While diving deep into multimodality research and collecting primary data (e.g. eye tracking data or survey) on tool reception is beyond the scope of this work, universal learnings from this field can nonetheless be used to guide the tool assessment.
For an applicable framework for analysis from the field of multimodality research we draw on the work of the communication scholar Bucher (2010), who outlines key challenges in multimodal understanding and links them to specific questions and design elements that aid in resolving these challenges. Multimodal understanding is described there as both reciprocal-where elements are interpreted in relation to one another-and recursive, as interpretations are continuously refined until a coherent understanding is achieved. The framework identifies six problem types: identification, orientation, hierarchization, navigation, framing, and sequencing, each tied to typical questions (e.g., “Who is the communicator?” or “What belongs together?”) and corresponding design solutions (e.g., logos, typographic cues, or navigation aids) (see Table 2) (Bucher, 2010).
Table 2
Typology of multimodal understanding problems and corresponding design solutions (adapted from Bucher (2010)).
| PROBLEM TYPE | TYPICAL QUESTIONS | DESIGN SOLUTIONS |
|---|---|---|
| Identification or localisation problem | Who is the communicator or author of the multimodal offering? What type of communication offering is this? | Sender identifiers, logos, titles, signal colours, specific typography, author details |
| Orientation problem | What is the current stage of the communication process? Where am I within the communication offering? | Table of contents, continuation indicators, sitemaps, time and programme overlays, section titles, page numbers, logos, colour-coded systems |
| Hierarchization problem | What are the subordinate, superior, and parallel relationships between the various elements of the communication? | Typography, placement, imagery, graphic highlights, white space, text types, section labels |
| Navigation problem | How do I move from one element to another related element? Where are the transition-relevant points? | References and page links, navigation bars, programme notes, links, table of contents, sitemaps, search aids, structural hints |
| Framing problem | What belongs together—closely or loosely? What is foregrounded? What is backgrounded? What is currently relevant, and what is latent? | Dividing lines and colours, references and page links, navigation bars, table of contents, sitemaps, search aids |
| Sequencing and categorization problem | How do the various identified elements of communication relate to each other (functionally, strategically, thematically)? | Links with tags, cluster introductory texts, text type labels, explicit deictic (linguistic or gestural) references to further, simultaneous, or past contributions, page and content sections |
Development of criteria catalogue to assess tools
Based on the aforementioned frameworks, a set of criteria is derived to assess the tools in their merit for the target group. The criteria are divided into three blocks. The first block is analyzing general information on the tool, including the target group, granularity of inputs and outputs, geographic and temporal scope and its implementation and accessibility.
The second block is related to the specific needs of the target group in terms of the tools function and is divided into the three categories task-fit, user-fit, and context-fit. Task-fit assesses if typical tasks of the target group are supported by the tool. User-fit assesses whether the level of detail (required input data, granularity of results etc.) is appropriate for the target group. Context-fit refers to the appropriateness of the systemic context (e.g. language, geographic scope, reference to laws/norms). For each category a set of questions is derived (see Table 3).
Table 3
Evaluation criteria.
| CATEGORY | EVALUATION QUESTIONS | |
|---|---|---|
| General | Target group |
|
| Granularity |
| |
| Scope |
| |
| Implementation |
| |
| Function | Task-fit |
|
| User-fit |
| |
| Context-fit |
| |
| Multimodal understanding | Localisation |
|
| Orientation |
| |
| Hierarchization |
| |
| Navigation |
| |
| Framing |
| |
| Sequencing and categorization |
|
While the function of the tool itself is important, so is its usability. Usability can be assessed with insights from the field of multimodality. Therefore, the third block of criteria is made up of Bucher’s multimodal understanding problems. While they are not strictly developed for tool assessment, they provide a consistent and objective framework to assess usability. The afore-mentioned questions from Buchers typology related to multimodal understanding problems, adjusted to the context of our study, are also shown in Table 3.
Based on the analysis of existing tools, we distil gaps in the tool landscape and derive general recommendations for target-group oriented decision-support tools for the assessment of early transformer replacement.
The aforementioned evaluation criteria will be used as a framework to structure the analysis and derive recommendations from the observed patterns. It must be noted that while the evaluation criteria draw on published literature and credible research, they represent an interdisciplinary approach to integrate insights from communication science into the more engineering based field of environmental and economic impact assessment. As such, they remain subjective insofar as it represents only one possible angle of analysis.
Results
The results are structured into three parts: a cross-tool comparison with gap identification, a synthesis of good practices and common pitfalls, and general recommendations for tool development in the context of early transformer replacement. A detailed analysis of each tool according to the evaluation criteria can be found in the Supplementary Information.
Cross-tool comparison and gaps identification
Table 4 (based on the detailed analysis found in the Supplementary Information) provides an overview of key insights from the tool analysis based on the defined criteria, and Figure 1 provides a visual overview on selected analysis criteria. The analysis shows a wide variety of decision-support tools to estimate impacts of early replacement of transformer, with very different foci, functions and levels of multimodal understanding.
Table 4
Overview of tool analysis.
| TOOL 1 (ABB TCO) | TOOL 2 (GREEN TRANSFO TCO) | TOOL 3 (UNEP U4E TCO) | TOOL 4 (UNEP U4E ENERGY EFFICIENCY) | TOOL 5 (MEPSY) | TOOL 6 (EIA) | TOOL 7 (EU-M3) | |
|---|---|---|---|---|---|---|---|
| General | |||||||
| Target group | Industry stakeholders/transformer purchasers. | Industry stakeholders/transformer purchasers (mainly Green Transfo customers). | Industry stakeholders/transformer purchasers (distribution transformers). | Policymakers and utilities in developing and emerging economies. | Researchers and policymakers. | EU-level policymakers; experts and analysts using EU-wide monitoring results. | Policymakers at EU and Member State level. |
| Granularity | Single transformer (up to eight comparable units); aggregated cost, energy and CO2. | Single transformer; aggregated cost, loss and CO2 results. | Single distribution transformer; detailed total cost of ownership and A/B-factors. | National distribution transformer fleet; comparison of baseline versus efficient case.6 | National transformer fleet (one of 10 product groups); global and country views. | EU-wide transformer fleet (one of many product groups); summarised in two pages of the report. | Motor fleet (EU-27/Member States); single-motor and stock-level results; few required inputs. |
| Scope | No fixed geographic scope; user-selectable standards (IEC/EN, IEEE); temporal scope via future energy price assumptions. | Country-level context; three currencies (EUR, USD, GBP); lifetime via user input. | Global applicability; typical lifetimes 30–50 years; annualised results in USD. | Approximately 156 developing countries; annual savings; three languages (English, French, Spanish); USD only. | 162 countries including the EU; time horizon to 2060 (discrete assessment years). | EU-27; time horizon 1990–2050; policy versus business-as-usual scenarios. | EU-27 and Member States; results 2000–2050; scenario-based policy analysis. |
| Implementation | Originally web-based; now unavailable; (ABB Customer support, 2026) assessed via a detailed user manual. | Web-based calculator; results accessible; calculation logic not documented. | Excel model; free download from the U4E website. | Web-based tool; PDF report with key assumptions available; background assumptions linked. | Web-based GUI; documentation and methodology available via CLASP. | Internal Excel/statistical modelling used by consultants; only results published. | Excel model accessible online and as download; main logic implemented in spreadsheets. |
| Function | |||||||
| Task-fit | Computes lifetime cost, payback, energy savings and CO2; compares transformers. | Computes total cost of ownership including losses, operating expenses and CO2 costs; single-unit assessment only. | Computes TCO, A/B-factors, energy and CO2 costs; incorporates jurisdiction-specific carbon pricing. | Computes annual electricity, financial and CO2 savings for efficiency policies. | Computes multiple energy, CO2 and stock indicators; detailed analysis adds consumer and national impacts. | Provides sales, stock, energy, GHG and cost indicators; high-level overview of savings; limited detail and no user adjustments. | Computes energy, cost, CO2 and material impacts of early-replacement programmes; single-motor and stock-level outputs. |
| User-fit | Low input burden (around 13 fields); default values and explanations support non-expert users. | Very low input burden (12 fields); clear layout but almost no explanation of outputs. | Moderate input burden (25+ fields); default values help; interpreting results requires expertise. | Low input burden; simple layout; explanations via pop-ups; little guidance on realistic ranges of inputs. | Layered input design (global view versus detailed analysis); extensive graphical and tabular outputs. | No user inputs; report only; suitable for quick overview, not for custom analysis. | Few required inputs reflecting core programme choices; extended inputs optional; detailed outputs but limited in-tool guidance. |
| Context-fit | Uses IEC/EN and IEEE formulae; currencies and units adjustable. | No cited standards or scientific methodology; English only. | Explicitly based on IEC TS 60076-20; uses typical transformer lifetimes and CO2 prices. | Links to IEC 60076-1; uses IEA data and U4E assumptions; tailored to developing and emerging economies. | Scenarios and efficiency metrics linked to existing regulatory frameworks; fixed horizon to 2060. Country selection and custom data upload. | Scenarios aligned with the EU policy framework; EU-wide scope; no Member State breakdown. | Geographic and temporal scope aligned with EU Ecodesign framework; no explicit links beyond power-class alignment. |
| Multimodal understanding | |||||||
| Localisation | Company logo and tool title clearly visible. | Company logo, title and short introductory text; little background information on version or authors. | UNEP mentioned on an “About” sheet; U4E branding visible on the website, less clearly in the file. | Logos and title (C2E2/U4E) clearly shown; short purpose description on the results page. | Constant header with CLASP logo, title and link to a quick-start guide. | Results report clearly attributed to authors and institutions. | “Info” sheet lists version, authors and project information; sheet headers show sheet names but not the overall tool name. |
| Orientation | Not fully assessable from the manual; general left-to-right, top-to-bottom input flow. | Simple single-page layout; most content visible without much scrolling. | Eight sheets with labelled tabs; numbering and colour coding not intuitive. | Stepwise windows from country selection to inputs and results; no explicit progress indicator. | Few pages (global view, detailed inputs, detailed results); navigation via clearly visible buttons. | Not interactive; orientation via chapters, colour, headings and page numbers. | Sheet tabs and on-sheet headings provide orientation; no progress indicator; headers not frozen when scrolling. |
| Hierarchization | Colours, font sizes and shading distinguish inputs and outputs. | Headings and basic layout structure content; result pie chart poorly labelled. | Colours and fonts used inconsistently; input and result areas distinguishable but relationships not always obvious. | Input fields highlighted; error frames shown in red; some inconsistencies in result fonts and emphasis. | Clear hierarchy in detailed views (coloured headers, boxed sections); global view is less consistent. | Headings and colour schemes differentiate sections; some inconsistencies within the transformer section. | Shading, font styles and icons indicate categories; user inputs in blue; some inconsistencies in styles and placement. |
| Navigation | Not fully assessable from the manual; likely mouse-based navigation within a single page. | Logical top-to-bottom flow; minimal scrolling; no explicit “back/next” controls. | User must switch between sheets manually; logical flow within each sheet. | Buttons (e.g. “Cancel”) guide between pages; scrolling within pages. | Buttons move between views; interactive elements on hover; slight inconsistencies in button design and placement. | Linear reading order; navigation via document structure only. | Scrolling and sheet switching; logical top-to-bottom flow; transitions between sheets explained mainly on the “Info” tab. |
| Framing | Shaded areas group user inputs versus information; bold labels and white input fields. | Sections framed by headings (introduction, inputs, outputs); minimal use of colour framing. | Sheets group topics; coloured areas and table frames provide framing; colour use not fully consistent. | Different windows/pages frame steps; background colours and headers separate sections. | Grouped boxes and outlines frame inputs and results; selected versus unselected elements distinguished by shading. | Report sections (“GENERAL INFO”, “FACTS & FIGURES”) consistently framed; minor shading and font inconsistencies in the transformer section. | Sheets and shaded areas frame inputs and results; minor inconsistencies in fonts and shading across sheets. |
| Sequencing | Input sequence follows headings and spatial layout; overall flow left-to-right, top-to-bottom. | Structured via headings; no explicit instructions on sequence or next steps. | Logical calculation sequence exists but is not made explicit; sheet order partly counter-intuitive (results before inputs). | Sequence from country selection to details to results; user must infer the workflow; no menu or progress bar. | Short introductory text; buttons labelled “Global view” and “Detailed analysis”; categorisation emerges from page transitions. | Static layout; natural top-to-bottom, left-to-right reading; links between text and figures not always explicit. | User must infer sequence from sheet names and layout; the “Info” tab provides an overview but not step-by-step guidance. |
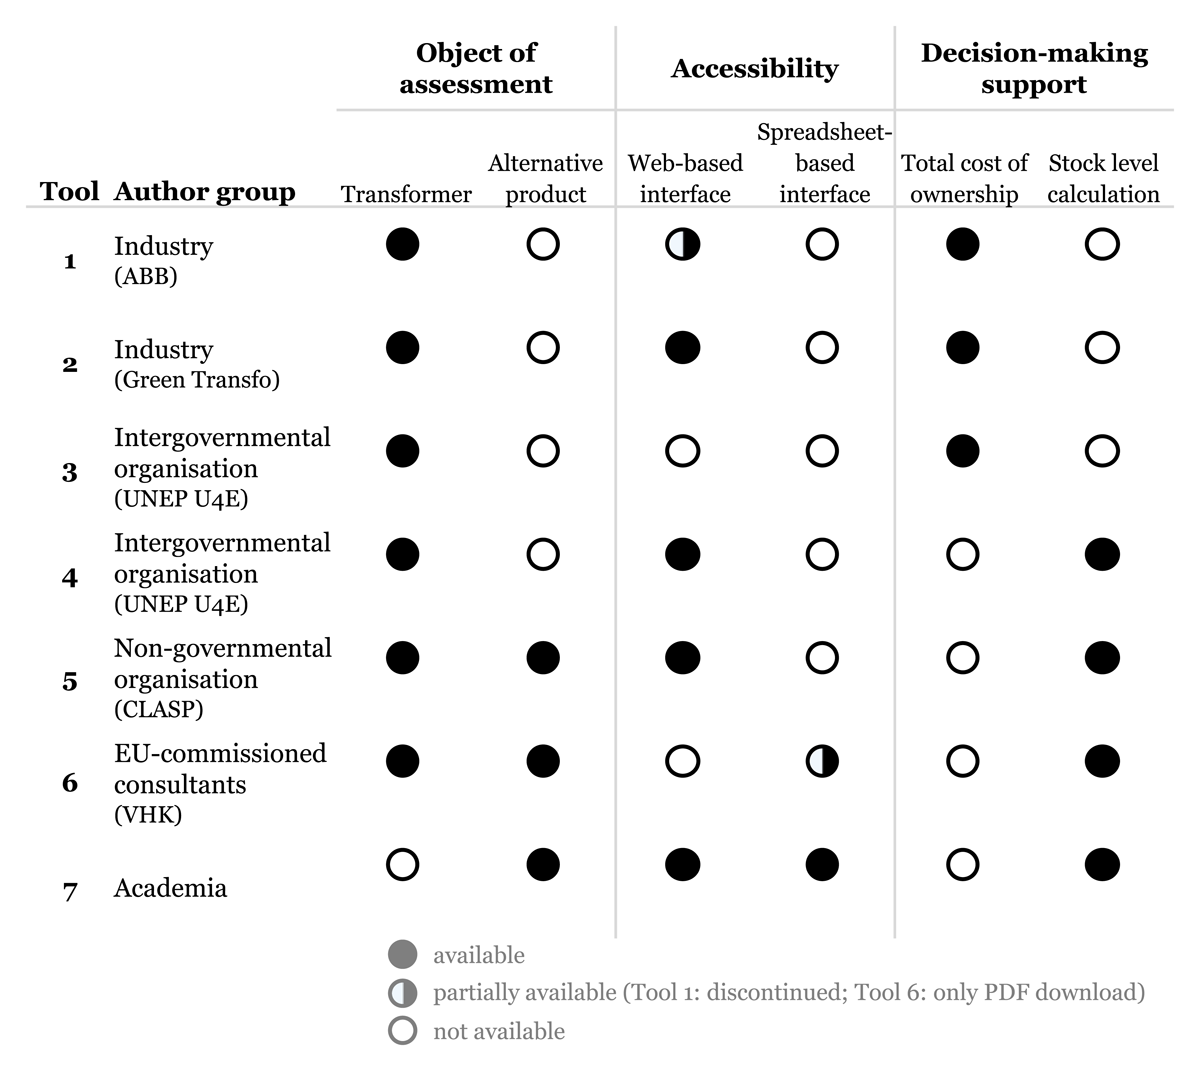
Figure 1
Overview of key characteristics of tool analysis.
The results show two broad clusters of users. The first target group can be defined as industry stakeholders who want to purchase or replace transformers and seek decision-support. Relevant information for this target group includes environmental, economic and technical assessments of individual transformers depending on accessible input data such as nominal rating, losses, costs and load factor. The second target group are policymakers who are looking to understand the effects of certain policies (energy efficiency standards, early replacement programmes). While needs for impact dimensions are similar (environmental, economic), the scope must cover entire regions or countries, and input and output data accordingly varies. Tools that combine functions for both target groups are limited, however Tool 7 (EU-M3) (EU-MORE, 2024) indicatively shows results on individual motor replacement in addition to the stock level (as the main focus of analysis). For transformers, no such tool is available, nor is there a tool that allows the assessment of replacement policies at stock level. Tool 4 (UNEP U4E Energy Efficiency) allows for assessment on stock level, but does not cover EU countries and only allows the assessment of efficiency policies (UNEP U4E, 2025). Tool 6 (EIA) fits from the scope, but it offers little information about underlying methodology and assumption and no user-modifiable tool (Wierda and Zanuttini, 2024). Therefore, based on the analysis, there appears to be a lack of a transformer-specific tool to estimate the impacts of early replacement policies at EU stock level. This gap, together with the recurring strengths and weaknesses observed across tools, motivates the synthesis of good practices and pitfalls in the following section.
Good practices and common pitfalls
The analysis of Tools 1–7 reveals a number of recurring strengths and weaknesses, that can also be relevant beyond transformer-specific applications. In line with the applied evaluation framework, the findings are structured into (1) general characteristics, (2) functional design, and (3) multimodal understanding.
General characteristics
Several tools show that clear methodological foundations and appropriate scope design are central for credible decision-support.
An identified good practice is the explicit use of recognised standards and policy frameworks. Tool 1 (ABB Transformers, 2016) allows users to choose between IEC/EN and IEEE standards.7 Tool 3 directly follows IEC TS 60076-20:2017 and its annex on capitalisation of losses (U4E, 2021). Tool 4 uses IEC 60076-1 for nominal power ratings. Tool 7 aligns motor power classes with Ecodesign studies as does Tool 6. These linkages make assumptions traceable and results easier to interpret.
Another good practice is the constructive use of dynamic and context-specific data. Tool 1 includes future energy price developments as an input. Tool 3 integrates jurisdiction-specific electricity and carbon prices and allows users to adjust economic parameters. Tool 5 uses country-specific stock and performance data and permits uploads of custom data (CLASP, 2026). Tool 7 lets users define programme budgets, coverage and timeframes. Such features allow adaptation to individual decision contexts.
At the same time, three common pitfalls are evident. First, methodological transparency is often limited. Tool 2 does not reference any standard or scientific source (Green Transfo, 2025); Tool 1, Tool 2 and Tool 6 provide only very high-level information on how results are calculated, and Tool 7 relies heavily on external publications rather than in-tool explanations. Second, the level of aggregation can be too coarse. Tool 1 compresses results into a few indicators without explaining the underlying methodology in detail, while Tool 6 summarises transformer impacts on only two report pages and does not expose the underlying model. Finally, several tools restrict geographic or currency flexibility. Tool 3 and Tool 4 report results only in USD; Tool 6 only applies at EU-27 level. This limits practical applicability for some users.
Functional design
In terms of functional design, a recurring strength is that many tools limit mandatory inputs to what users can realistically provide. Tool 1 and Tool 2 require a small number of key technical and financial parameters, and Tool 4 uses only a few transformer and policy attributes. Tool 7 relies on eight basic inputs (geographic scope, programme budget, funding rate, power classes, time period), which aligns well with information available to policymakers.
As another good practice, several tools also implement a layered structure that differentiates between basic and advanced use. Tool 3 offers 25 core input fields and additional sheets for experienced users; Tool 5 separates a simple “global view” from a more detailed analysis with optional parameters; Tool 7 allows additional assumptions (e.g. lifetime reduction, selection of motor types) to be activated when needed. Defaults and suggested values further support users. Tool 2 provides default financial assumptions, while Tool 3 and Tool 5 offer default values for discount rates, loads and other parameters, thereby indicating realistic ranges.
However, there appears to be a trade-off, and a potential pitfall between limiting minimum input values and over-simplification. Tool 2 supports only single transformer calculations without scenario comparison or methodological transparency. Tool 4 provides only annual results, which is insufficient for assessing cumulative or lifetime policy impacts. Tool 6 does not allow any user modification at all. Across several tools (especially 2, 3 and 7) explanations of key inputs and outputs are limited, which complicates interpretation. In addition, the distinction between mandatory and optional inputs or between default and user-defined values is not always clear, as exemplified in Tool 1 (no explicit marking of mandatory fields), Tool 5 (global view) and Tool 7 (similar shading for input fields and some headers).
With respect to outputs and scenarios, most tools combine economic, energy and environmental indicators. All analysed tools cover to some degree costs, energy and CO2; Tool 7 additionally integrates material flows and programme efficiency (EUR/kWh saved). Several tools support explicit scenario comparisons, such as Tool 1 (alternative transformer options), Tool 4 (baseline vs efficient fleet), Tool 5 (baseline vs policy scenarios), Tool 6 (EIA) (Ecodesign vs business-as-usual) and Tool 7 (early replacement vs no programme, plus a reference information campaign). At the same time, some visualisations are weakly labelled, such as in Tool 2 (pie chart), Tool 4 (several graphs), and Tool 6. Furthermore, temporal aspects are not always aligned with decision needs, as in Tool 4 which only shows annual results.
Multimodal understanding
Finally, the analysis indicates that multimodal design choices might significantly support or hinder tool usability.
Several tools provide positive examples of localisation and orientation. Tool 1 uses clear company branding and a prominent tool title. Tool 2 shows logo and introductory text in header and footer. Tool 4 presents the logos of C2E2 and U4E and an explanatory text on its purpose (on the results page). Tool 5 has a constant header with logo, title, a short description and a link to a quick start guide and Tool 7 offers an “Info” sheet with version, authors, project information and references. In terms of orientation and navigation, simple layouts like the one in Tool 2 (single page) reduce complexity, and clear stepwise flows as exemplified in Tool 4 (country selection → transformer details → results) and Tool 5 (global view → detailed inputs → detailed results) support users. Tool 7 separates inputs, results and graphical outputs across different sheets.
At the same time, recurrent pitfalls are visible. Localisation is weak in Tool 3, where authorship and purpose are only briefly mentioned on the last sheet and the download page provides little context. In Tool 4, the explanatory text on the tool’s purpose appears only on the results page, not at the beginning. In Tool 7, the purpose and target group are not stated explicitly in the interface. Orientation and sequencing are insufficiently supported in tools with multiple sheets or views. In Tool 3, the tab order (TCO before Inputs) and inconsistent colour coding make it hard to infer the workflow. In Tool 5, the main views are not labelled as such; users infer their function from buttons (e.g. “Run Detailed Analysis”, “Return to Global View”). Tool 7 provides no progress indication and does not freeze headers, so context can be lost when scrolling.
Regarding hierarchisation and framing, various tools show how visual differentiation can help users. Tool 1 uses shading and white boxes to separate input areas from information. Tool 3 marks user inputs in yellow (strong signal colour) and Tool 4 clearly highlights input fields and uses red frames for errors. Tool 5’s detailed view distinguishes headers and input boxes clearly, and Tool 7 uses blue cells and icons to identify input categories. However, many tools also use colours and fonts inconsistently. Tool 3 mixes multiple shading schemes without a clear logic, Tool 4 uses similar font sizes for labels of differing importance, Tool 5’s global view is less structured than its detailed view, and Tool 7 employs several shading and font styles that do not always follow a consistent hierarchy.
Overall, the cross-tool comparison suggests that effectiveness of decision-support tools could be positively impacted by: clearly documented methods and scopes anchored in standards and policy frameworks (e.g. in Tools 1, 3, 4, 5 and 7), user-centred functional design with limited mandatory inputs, layered complexity, scenario comparison and exportable outputs (e.g. in Tools 3, 5 and 7), and coherent multimodal design with explicit localisation, simple orientation and consistent visual hierarchies (with good and poor examples visible across all tools). These learnings are synthesised into general recommendations for tool development in the following section.
Recommendations for tool development
Building on the identified gap and the patterns synthesised above, the following paragraphs derive general recommendations for tool development, structured along the evaluation criteria introduced in the methods section. These recommendations reflect expert assessments based on the cross-tool analysis. They are not empirically validated design principles but represent patterns that, in our assessment, are likely to improve usability and decision support quality.
General characteristics
Target group: The gap analysis indicates a need for a transformer-specific early replacement tool at EU stock level. Integrating a total cost of ownership function into the same tool, as indicatively demonstrated for motors in Tool 7, would extend coverage to industry stakeholders while remaining conceptually coherent, since stock-level calculations ultimately rest on assumptions for individual units. However, such a dual approach requires particular care in multimodal design: clearly separated sections, explicit labelling of purpose, and inputs tailored to each target group to avoid functional diffusion.
Granularity: Calculations should, as far as possible, be anchored in recognised standards and classifications (as observed in Tools 1, 3, 4, 6 and 7). A layered approach to granularity, with aggregate results in a basic view and detailed breakdowns (e.g. by transformer category or impact dimension) in an advanced view, can serve diverse user needs without overwhelming less experienced users.
Scope: Geographic flexibility should go beyond what most analysed tools offer. In the EU context, scaling from EU-level results to individual Member States (e.g. via a proportional factor) is conceptually straightforward and would substantially increase usefulness. Currencies and units should be user selectable. The temporal scope should cover the relevant policy horizon (e.g. to 2050) and report both annual and cumulative impacts.
Implementation: Web-based interfaces offer accessibility advantages, but the discontinuation of Tool 1 illustrates the risk when maintenance and hosting is required. Spreadsheet-based tools (as in Tools 3 and 7) lower maintenance needs and support transparency but require protection of background calculations. A pragmatic solution combines a web-based front end with a downloadable spreadsheet model. Regardless of format, the tool should be modifiable by users and allow export of results for further analysis.
Functional design
Task-fit: Minimum mandatory inputs should be kept low (as demonstrated in Tools 1, 2, 4 and 7), while still generating relevant environmental and economic outputs. Scenario comparison, where a policy scenario is measured against a business-as-usual baseline reflecting current regulations, appears essential. Dynamic assumptions on future costs and emission intensities should be incorporated to reflect the prospective nature of early replacement decisions.
User-fit: A layered structure (as in Tools 3, 5 and 7) effectively accommodates a variety of users: a basic mode with few core inputs, an advanced mode for detailed parametrisation. Default values from recognised sources should be clearly marked and documented. Background assumptions and methods should be made accessible in concise, non-technical form, for example via a linked methods note or FAQ, to avoid the opacity observed in Tools 2 and 6.
Context-fit: Embedded data should clearly state the reference year, policy context, and date of last update. This information should be accessible both in a dedicated “About” section and in a persistent header or footer visible throughout the tool.
Multimodal design
Localisation and orientation: Author institution, tool title, and a brief explanatory text should be visible on every page (e.g. via a fixed header). If the tool serves dual target groups, this duality should be reflected in clearly labelled sections. Simple structural elements like page titles, a navigation bar, or a breadcrumb trail, can help users locate themselves within the workflow.
Hierarchisation, navigation and framing: Inputs, outputs, and explanatory content should be visually differentiated using a consistent scheme (e.g. one colour for user inputs, another for calculated values, a neutral background for text). A legend or “how to read this tool” box at the beginning can support users. Navigation should follow a stepwise logic (overview → basic inputs → advanced inputs → basic results → advanced results), with progress indicators and directional cues (e.g. buttons or arrows) guiding transitions.
Sequencing and categorization: Users should not need to make assumptions on the workflow from sheet names or button labels. Instead, clear headings, a numbered list of stages or a progress bar, and consistent grouping of information categories (inputs, scenario settings, results, sensitivity options) support both novice and advanced users.
Discussion
This study has several limitations that should be kept in mind when interpreting the findings. The selection of tools is not necessarily exhaustive, as it was based on general web searches and therefore reflects search engine ranking rather than a systematic inventory. The results can still provide recommendations across tools, but generalisability is limited. Similarly, the choice of methods is subjective, aiming to bridge the gap between communication science and technical assessment which makes it more difficult to clearly situate the research in one domain. Also, the applied frameworks provide an angle for analysis, but testing whether tools actually improve decision-making outcomes would require further analysis and user-studies. However, the theoretical analysis as a first step has its merits and can lay the foundation for further analysis.
Regarding tool selection, not all tools fully match the original selection criteria. Tool 1 is no longer available and could only be analysed via a manual, Tool 6 is accessible only through published results and not as an interactive tool, and Tool 7 addresses electric motors rather than transformers. These tools were nonetheless included because they either illustrate important good practices and pitfalls (Tool 1), or highlight gaps and methodological options that are relevant to transformers (Tools 6 and 7). Despite these constraints, the seven tools still cover a considerable breadth in terms of scope, functionality and usability.
Some aspects were explicitly out of scope. We did not assess how easily the tools can be found by their target groups (e.g. whether users know that they exist, how they are marketed or integrated into broader programmes), nor did we analyse download statistics or usage numbers. Such information would be highly relevant for understanding actual impact but was not available within the scope of this study. Most importantly, we did not include direct user feedback. The analysis is based on study team assessment of functionality and multimodal design, but we did not conduct surveys, interviews or usability tests with policymakers or industry stakeholders.
The results suggest that involving users more systematically would be a valuable next step. Ideally, a prototype for an improved tool that already incorporates basic good practices and avoids obvious flaws would be developed first, and then discussed with representatives of the target groups. The evaluation framework proposed in this paper could serve as a basis to structure such feedback (e.g. by asking targeted questions on task-fit, user-fit, context-fit and multimodal understanding). It remains unclear to what extent such user-centred design processes are common for decision-support tools developed in research and policy projects. Our findings, in particular the frequency of avoidable usability and communication issues, indicate that this is often not the case.
A key contribution of this work is the combination of functional and multimodal analysis. The study shows that many tools are technically sound, but multimodal aspects such as localisation, orientation, hierarchisation, navigation, framing and sequencing are frequently a source of pitfalls. At the same time, these pitfalls are often relatively easy to avoid if they are considered from the outset rather than treated as end-of-pipe communication. The identified gap in the tool landscape and general recommendations build directly on these insights by integrating lessons on scope and methodology with good practices in user-centred and multimodal design. Such tools are particularly needed for early replacement decisions, where the net benefit depends on balancing use-phase energy savings against embodied impacts and upfront costs. Such a trade-off cannot be assessed without adequate quantification.
While derived from transformer-related tools, the findings, particularly those on multimodal design, may also be transferable to technical decision-support tools in other energy-efficiency domains.
Further research could extend the tool mapping with more systematic search strategies, gather empirical evidence on tool usage and adoption, and, most importantly, integrate structured feedback from target groups into future tool development.
Conclusion
This study analysed seven existing tools that support environmental and economic assessments of transformers, with a focus on early replacement to reduce energy demand. Using a combined framework of general, functional and multimodal criteria, we identified substantial variation in scope, methodological rigour and usability. Two main user groups emerged: industry stakeholders seeking support for purchase or replacement decisions at the level of individual transformers, and policymakers requiring stock-level impact assessments of policies. While several tools address one of these groups, none of the identified transformer tools allow policymakers to estimate the impacts of early replacement programmes on EU stock level. Only one tool (Tool 7) provides such a function, but for electric motors.
Across the sample, good practices include the explicit use of international standards and policy frameworks, the integration of dynamic and context-specific data, limiting mandatory inputs to realistically available information, and layered designs that differentiate between basic and advanced use. At the same time, common pitfalls were evident, such as limited methodological transparency, over-aggregated results, restricted geographic and currency flexibility, insufficient explanations of inputs and outputs, and inconsistent multimodal design.
Building on these insights, we identify a gap, the absence of a transformer-specific early replacement tool at EU stock level, and derive general recommendations. These include anchoring calculations in IEC and Ecodesign standards, combining stock-level policy assessment with an optional total cost of ownership function, using layered inputs, and embedding explicit scenario comparison. Multimodal design principles can be embedded from the outset to improve localisation, orientation, hierarchisation, navigation and framing.
The work has limitations, including a non-exhaustive tool sample, lack of data on tool usage and discoverability, and absence of direct user feedback. Nevertheless, it demonstrates the value of combining functional and multimodal perspectives for tool assessment and development. Future research should extend the mapping of tools, collect empirical evidence on their use, and integrate structured feedback from target groups into iterative, user-centred development processes.
Declaration of generative AI and AI-assisted technologies in the writing process
During the preparation of this work, the authors used Microsoft Copilot, ChatGPT, and DeepL Translate to support argument structuring and to improve readability and language. After using these tools, the authors reviewed and edited all content and take full responsibility for the final text.
Additional File
The additional file for this article can be found as follows:
Supplementary information
Detailed tool analysis. Extended tool by tool analyses underlying this study. DOI: https://energydemand.org/articles/15/files/6a6c6c0f55fdb.pdf
Notes
[1] Commission Regulation (EU) No 548/2014 sets mandatory ecodesign requirements to improve the energy efficiency of power transformers and aims to reduce electricity losses and associated CO2 emissions.
[2] Amendments to (EU) No 548/2014 were enacted via Regulation (EU) 2019/1783. These modifications were introduced to address real-world grid irregularities, refine technical definitions, and streamline the transition to stricter Tier 2 efficiency standards.
[3] ABB is a multinational technology company providing industrial electrification and digital technologies.
[4] Green Transfo is a manufacturer specializing in eco-friendly, high-efficiency distribution transformers.
Data Accessibility Statement
This study is based on data synthesized from tools that are or were publicly available, as well as official technical documentation, and institutional websites. All primary sources, user manuals, and online assessment portals used to compile these findings are cited within the reference list.
Extended tool-by-tool analyses underlying this study are provided as supplementary information. No additional datasets were generated or analysed during the current study.
Author contributions
Robin Barkhausen: Conceptualisation, methodology, formal analysis, investigation, data curation, validation, visualisation, writing – original draft, writing – review and editing, supervision, project administration.
Jana Hack: Conceptualisation, formal analysis, investigation, validation, writing – original draft, writing – review and editing.