
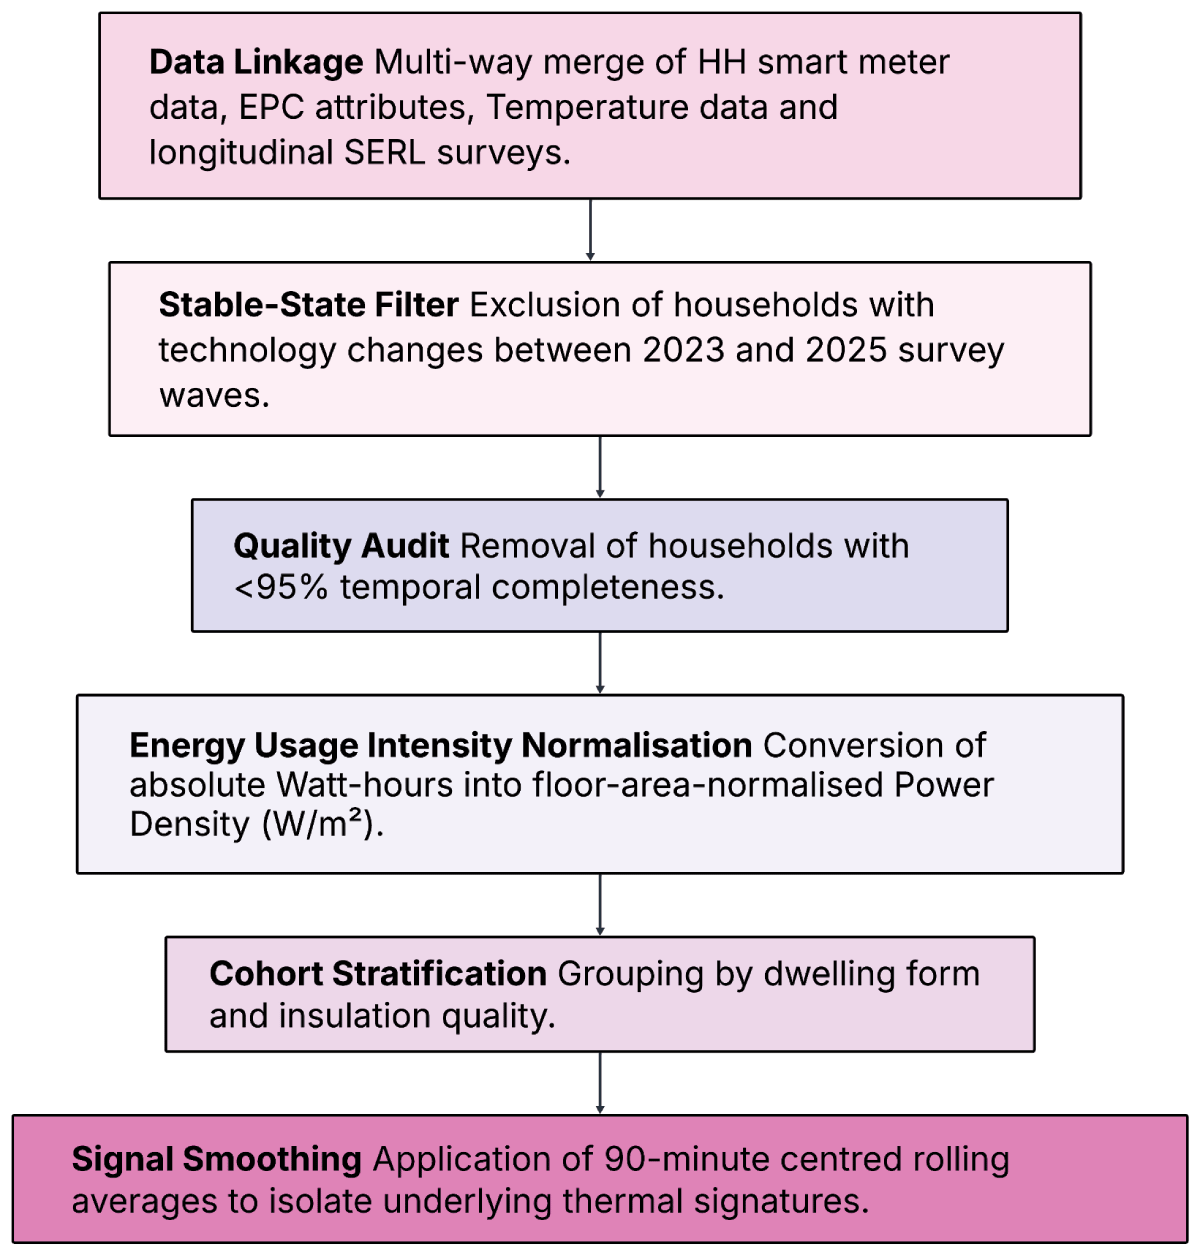
Figure 1
EUI Data Pipeline. Multi-stage processing of SERL Half-Hourly Smart Meter and EPC data to normalise demand (W/m2) and isolate settled technology-fabric groups through stable-ownership filtering.
Table 1
Household stratification and inclusion criteria.
| DIMENSION | CATEGORY | DATA SOURCE | INCLUSION CRITERIA/LOGIC |
|---|---|---|---|
| Physical Form | House Type | EPC | Segmented by: Detached, Semi-Detached, Terraced |
| Building Fabric | High-Insulation | EPC | Walls: Cavity or Solid wall insulation present. & Loft: Insulation thickness >200 mm. |
| Low-Insulation | EPC | Walls: Uninsulated. Loft: Insulation thickness <200 mm or “None.” | |
| Stability | Longitudinal | SERL Survey | Technology status (EV/HP/PV/Batt) must be identical in both 2023 and 2025 survey responses. |
Table 2
Cohort Sizes.
| BUILT FORM | TECHNOLOGY GROUP | INSULATION | N | % TOTAL | NOTE |
|---|---|---|---|---|---|
| Detached/Semi | A: PV only +Batt | High-Insul | 45 | 2.5% | |
| Detached/Semi | A: PV only +Batt | Low-Insul | 17 | 0.9% | |
| Detached/Semi | A: PV only | High-Insul | 102 | 5.6% | |
| Detached/Semi | A: PV only | Low-Insul | 30 | 1.7% | |
| Detached/Semi | B: EV only | High-Insul | 29 | 1.6% | |
| Detached/Semi | B: EV only | Low-Insul | 9 | 0.5% | * small sample |
| Detached/Semi | C: HP only | High-Insul | 10 | 0.6% | * small sample |
| Detached/Semi | D: EV + PV + Batt | High-Insul | 21 | 1.2% | * small sample |
| Detached/Semi | D: EV + PV | High-Insul | 10 | 0.6% | * small sample |
| Detached/Semi | E: HP + PV + Batt | High-Insul | 11 | 0.6% | * small sample |
| Detached/Semi | E: HP + PV | High-Insul | 10 | 0.6% | * small sample |
| Detached/Semi | H: Control | High-Insul | 513 | 28.3% | |
| Detached/Semi | H: Control | Low-Insul | 228 | 12.6% | |
| Terraced | A: PV only + Batt | High-Insul | 14 | 0.8% | |
| Terraced | A: PV only + Batt | Low-Insul | 9 | 0.5% | * small sample |
| Terraced | A: PV only | High-Insul | 24 | 1.3% | * small sample |
| Terraced | A: PV only | Low-Insul | 9 | 0.5% | * small sample |
| Terraced | H: Control | High-Insul | 380 | 21.0% | |
| Terraced | H: Control | Low-Insul | 328 | 18.1% | |
| TOTAL | 1,813 | 100% |
[i] * Some have small samples (n = 10–24); findings should be treated as indicative rather than definitive. Group F (HP + EV + PV) Removed due to sample size.
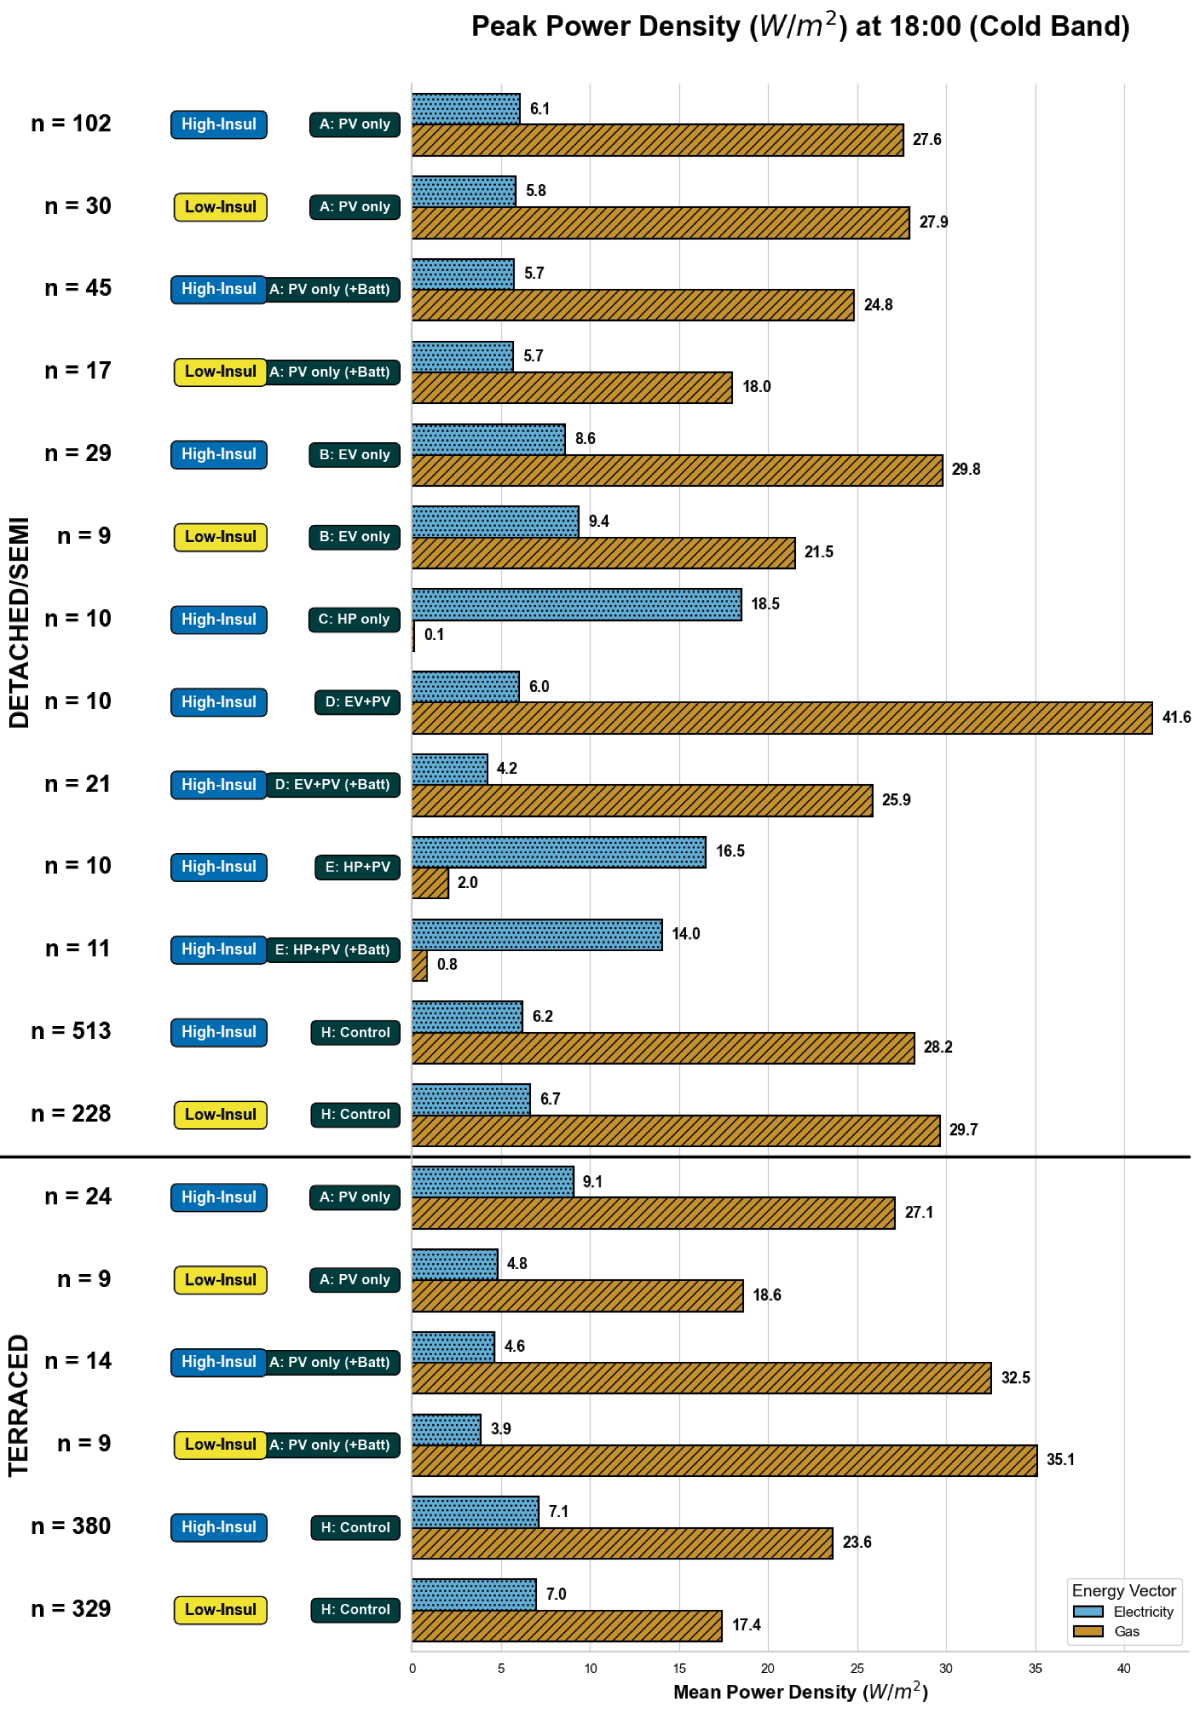
Figure 2
Mean Peak Power Density (W/m2) at 18:00 during Cold Band conditions (<5.5°C). Each group is shown with two bars: blue with dots = electrical intensity (W/m2); hatched orange = gas intensity (W/m2). The bottom bar cluster in each housing-type section represents the gas-heated control group (Group H: no LCTs), providing the baseline against which all technology groups are compared. Top section = Detached/Semi-Detached; Bottom section = Terraced.
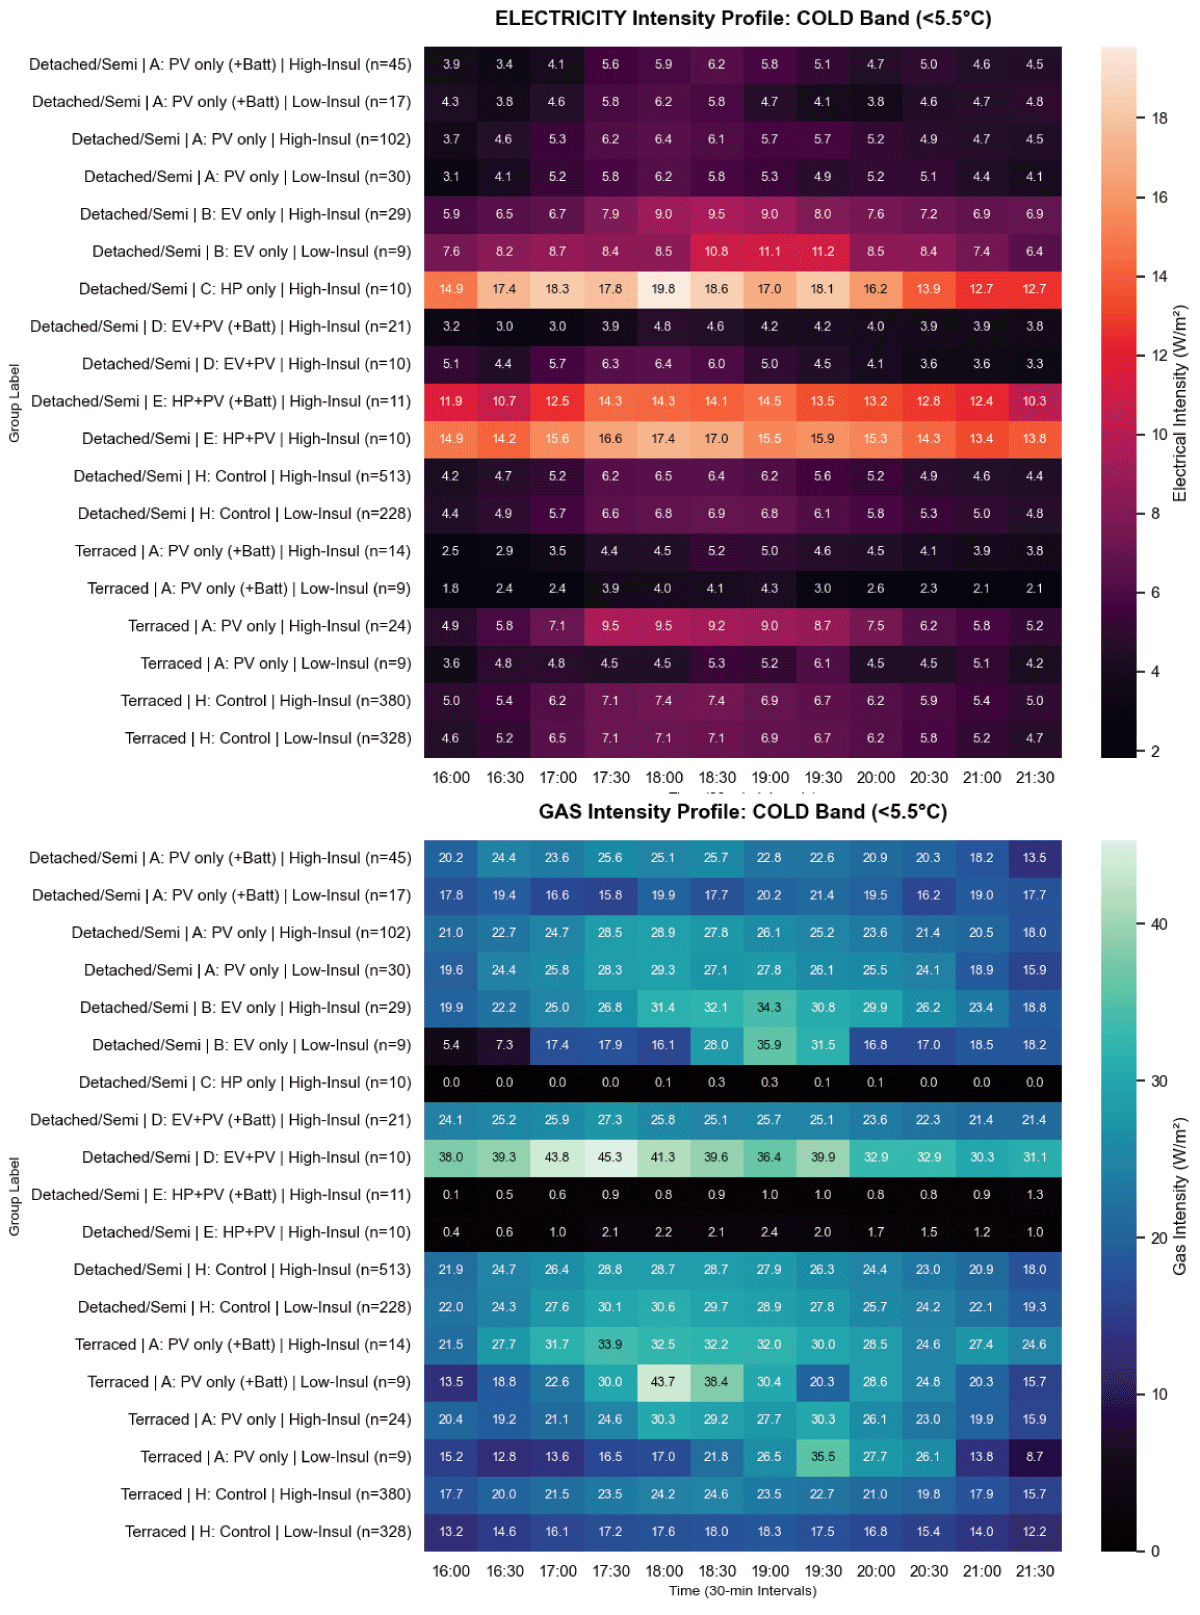
Figure 3
Heatmap of Mean Electrical and Gas Intensity (W/m2) across Technology groups during the 16:00–21:30 Window (Cold Band <5.5°C).
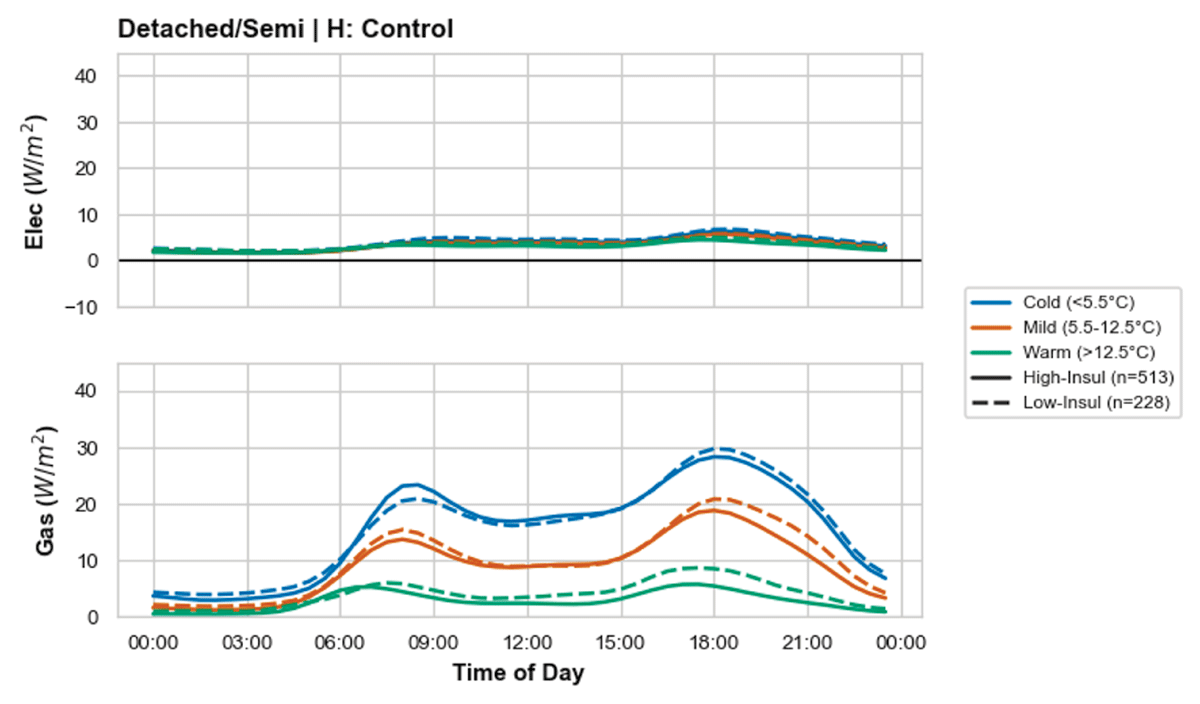
Figure 4
Diurnal Power Density (W/m2) for Group H (gas-heated, no LCTs, Detached and Semi-Detached) during Cold Band (<5.5°C). This is the control baseline against which all technology groups are compared.
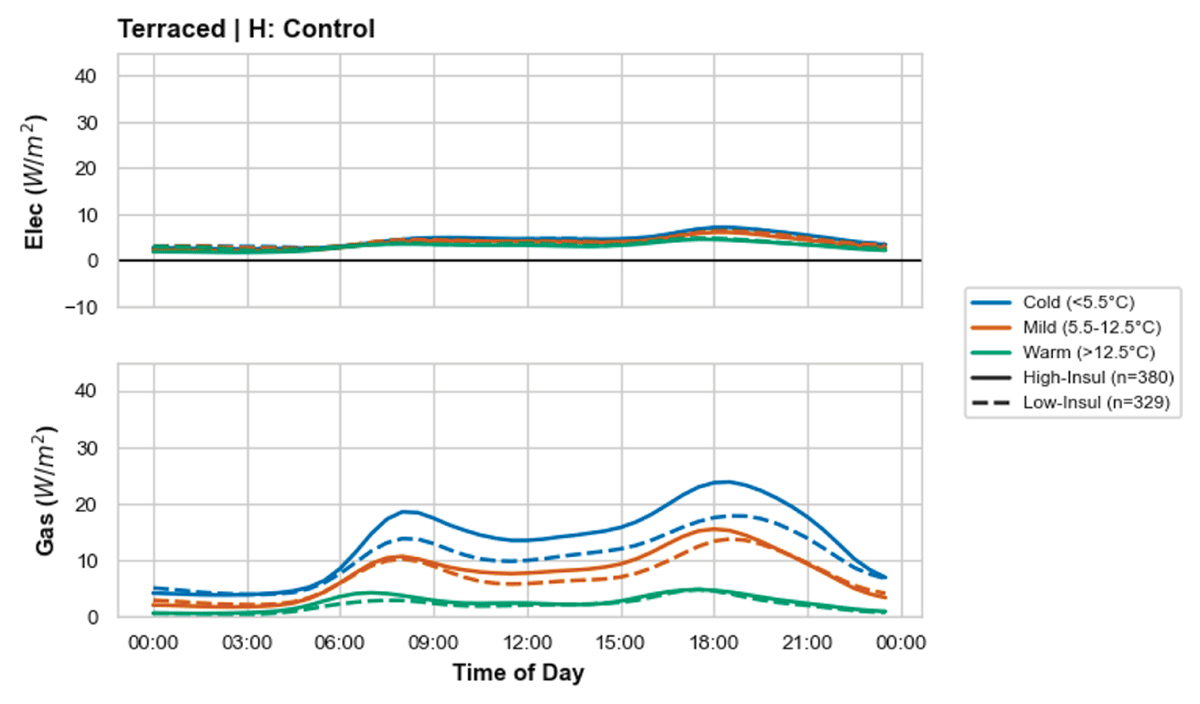
Figure 5
Diurnal Power Density (W/m2) for Group H (gas-heated, no LCTs, Terraced) during Cold Band (<5.5°C).
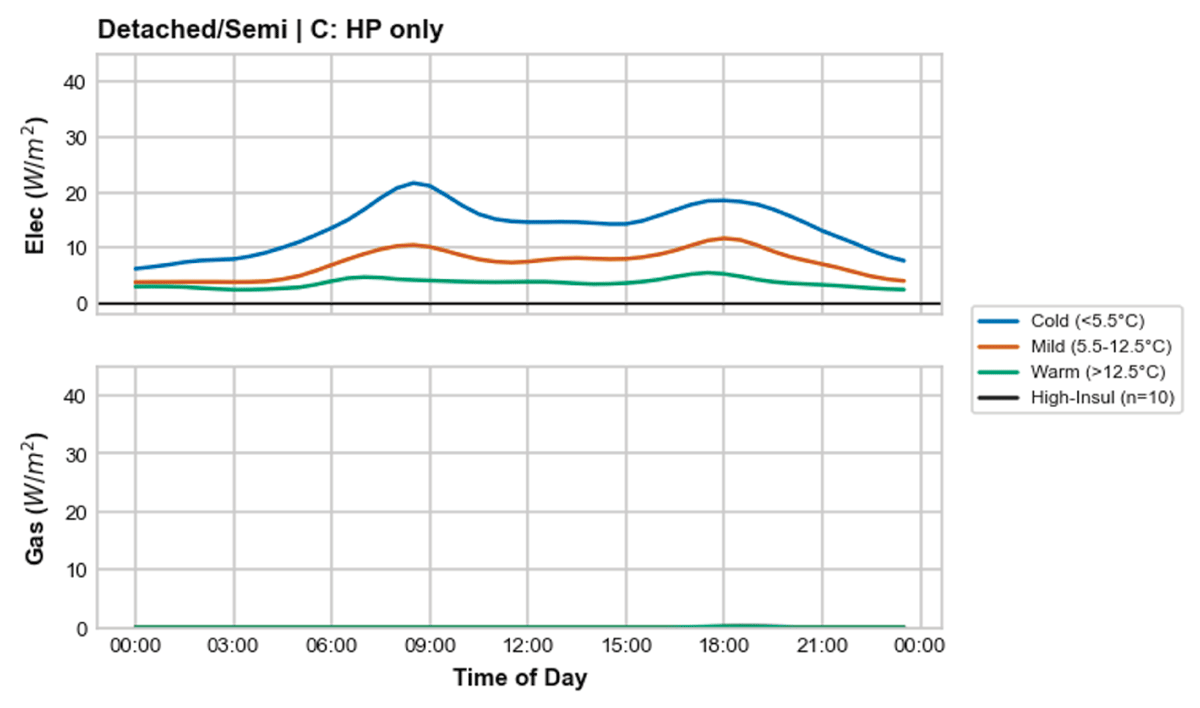
Figure 6
Diurnal Power Density (W/m2) for Group C (HP only, High-Insulation, Detached/Semi-Detached, n = 10*) during Cold Band (<5.5°C). Near-zero gas signature reflects hybrid heating arrangements (gas hob retention or legacy boiler use), not complete fuel displacement.
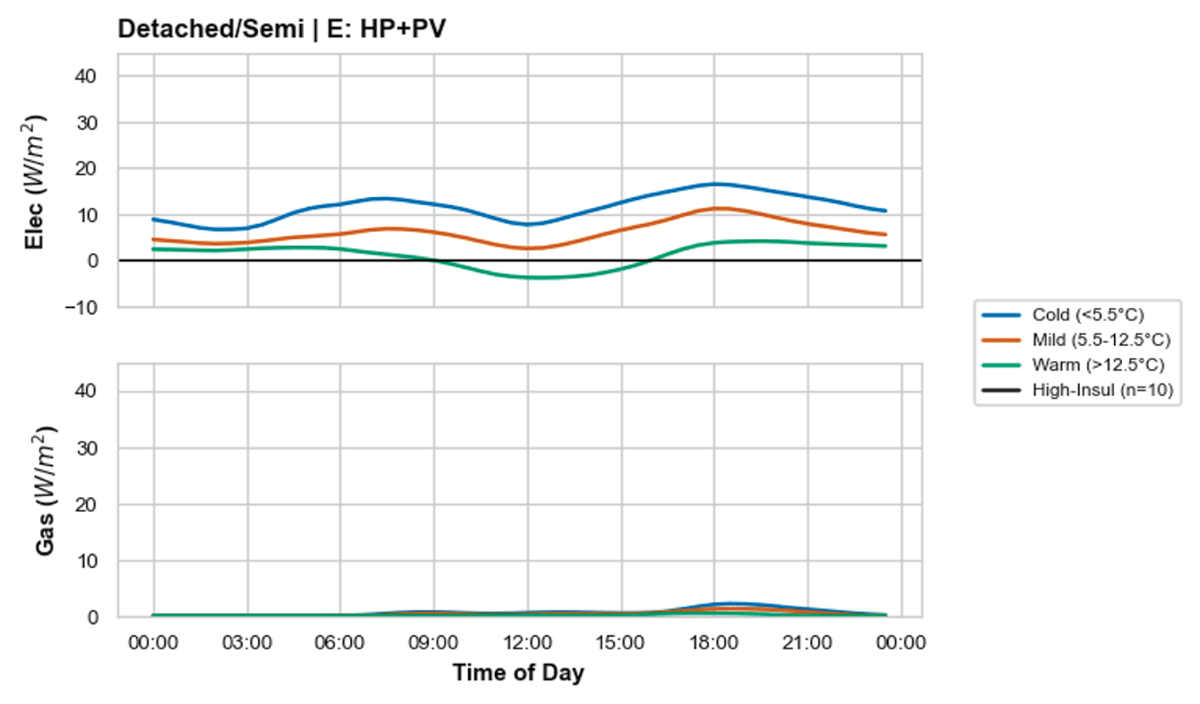
Figure 7
Diurnal Power Density (W/m2) for Group E (HP + PV, High-Insulation, Detached/Semi-Detached, n = 10*) during Cold Band (<5.5°C). Residual gas spikes of 0.82–2.24 W/m2 at 18:00 indicate a hybrid heating reality or oven/stove.
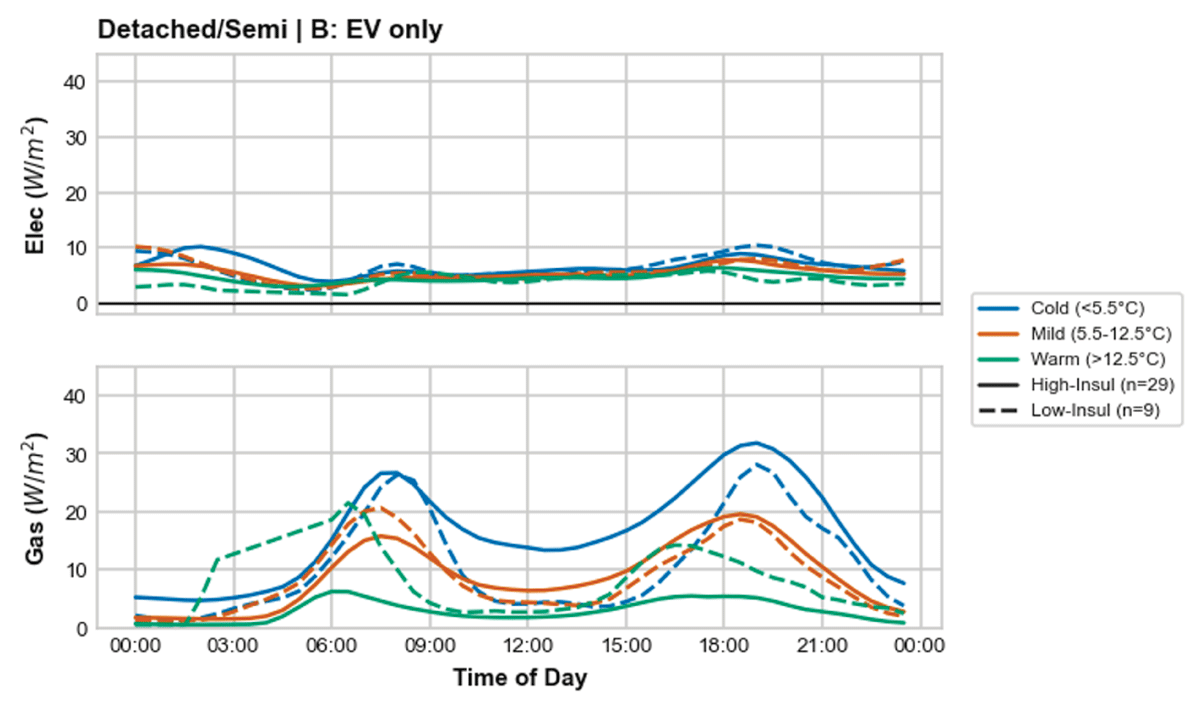
Figure 8
Diurnal Power Density (W/m2) for Group B (EV only, High-Insulation, Detached/Semi-Detached, n = 29) during Cold Band (<5.5°C).
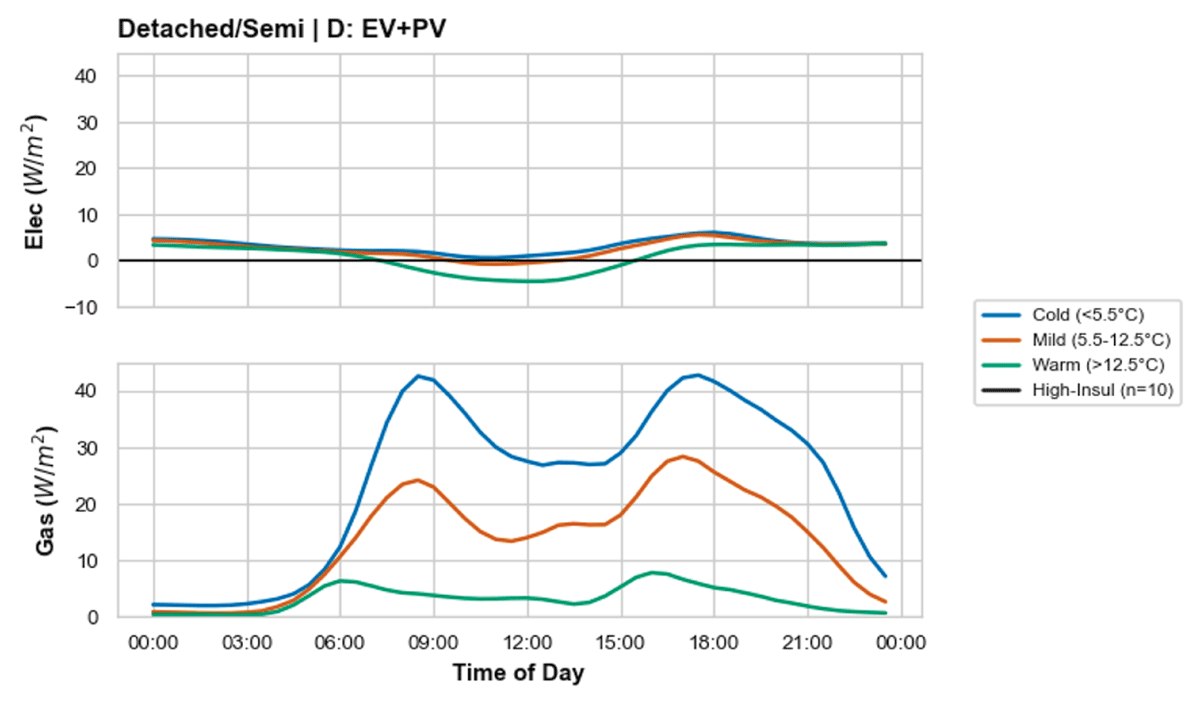
Figure 9
Diurnal Power Density (W/m2) for Group D (EV + PV, High-Insulation, Detached/Semi-Detached, n = 10*) during Cold Band (<5.5°C). High gas demand (41.59 W/m2 at 18:00) confirms a gas-heated home; EV and PV in combination decouple transport load only.
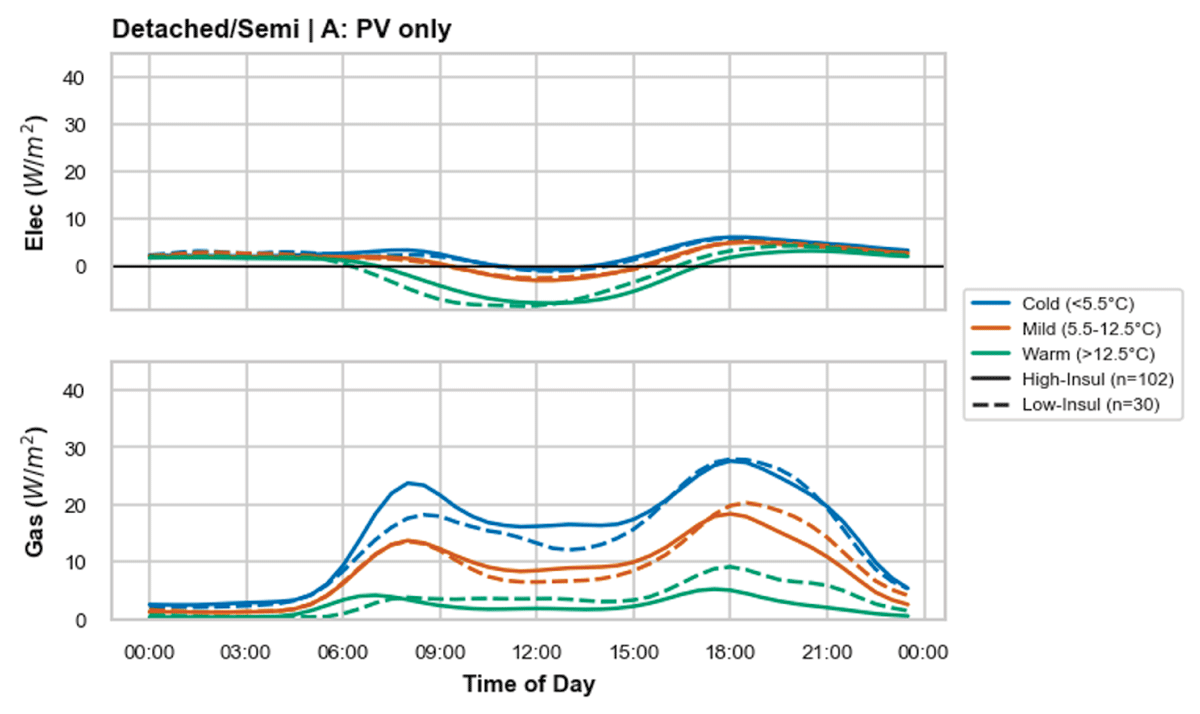
Figure 10
Diurnal Power Density (W/m2) for Group A (PV only, Detached/Semi-Detached) during Cold Band. PV provides no evening peak mitigation in winter; gas heating dominant.
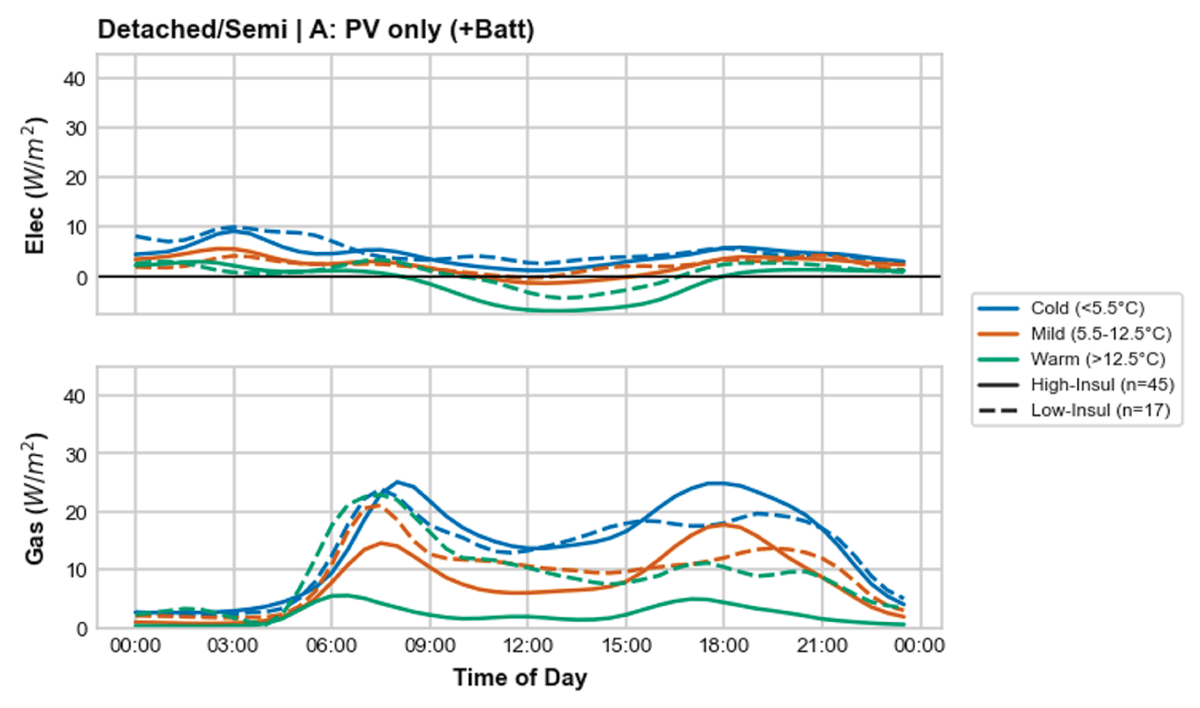
Figure 11
Diurnal Power Density (W/m2) for Group A (PV + Battery, Detached/Semi-Detached) during Cold Band.
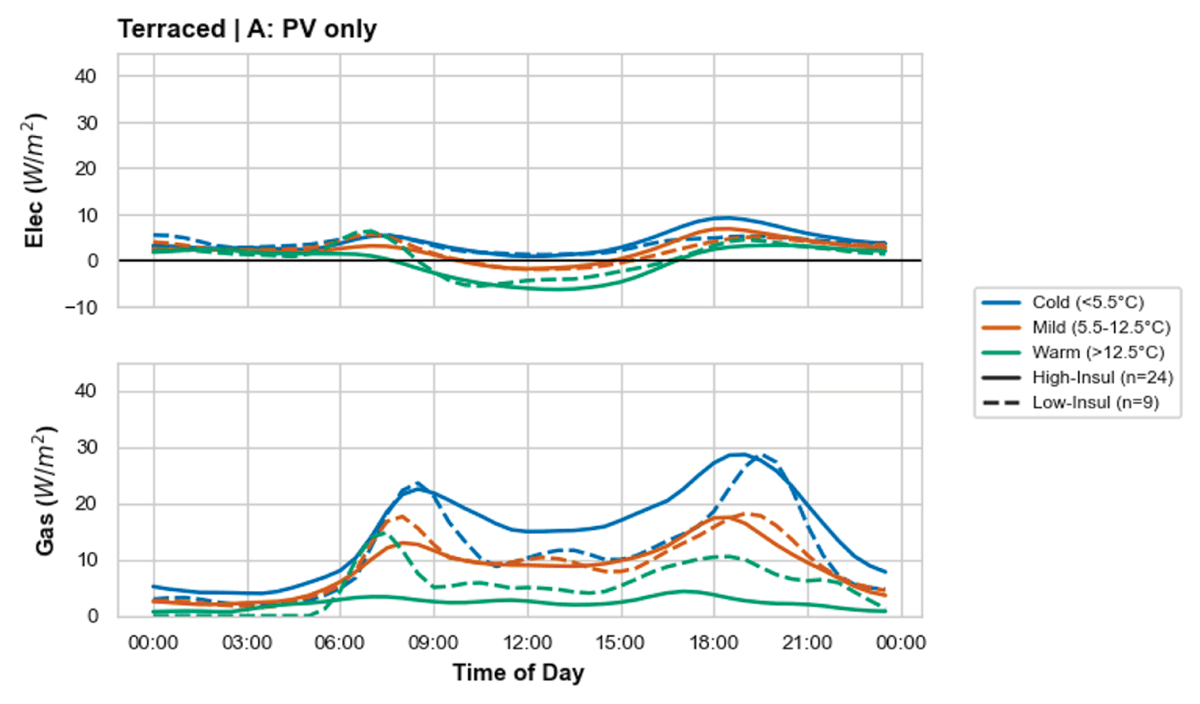
Figure 12
Diurnal Power Density (W/m2) for Group A (PV only, Terraced) during Cold Band.
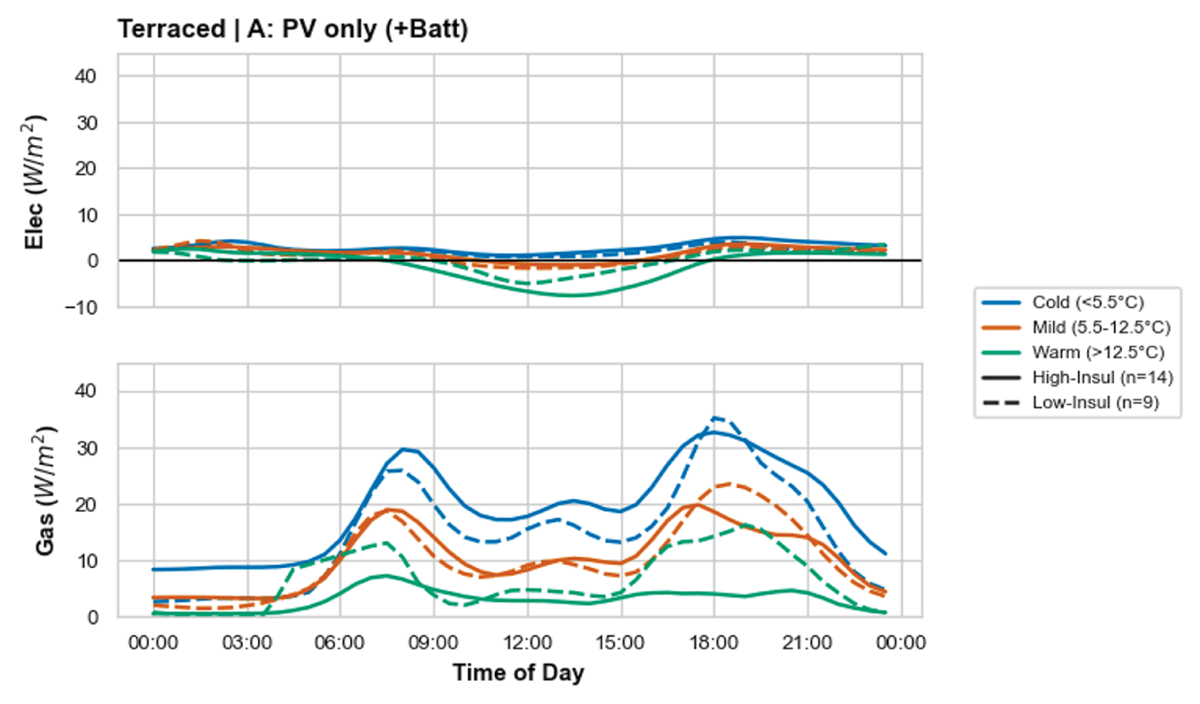
Figure 13
Diurnal Power Density (W/m2) for Group A (PV + Battery, Terraced) during Cold Band.
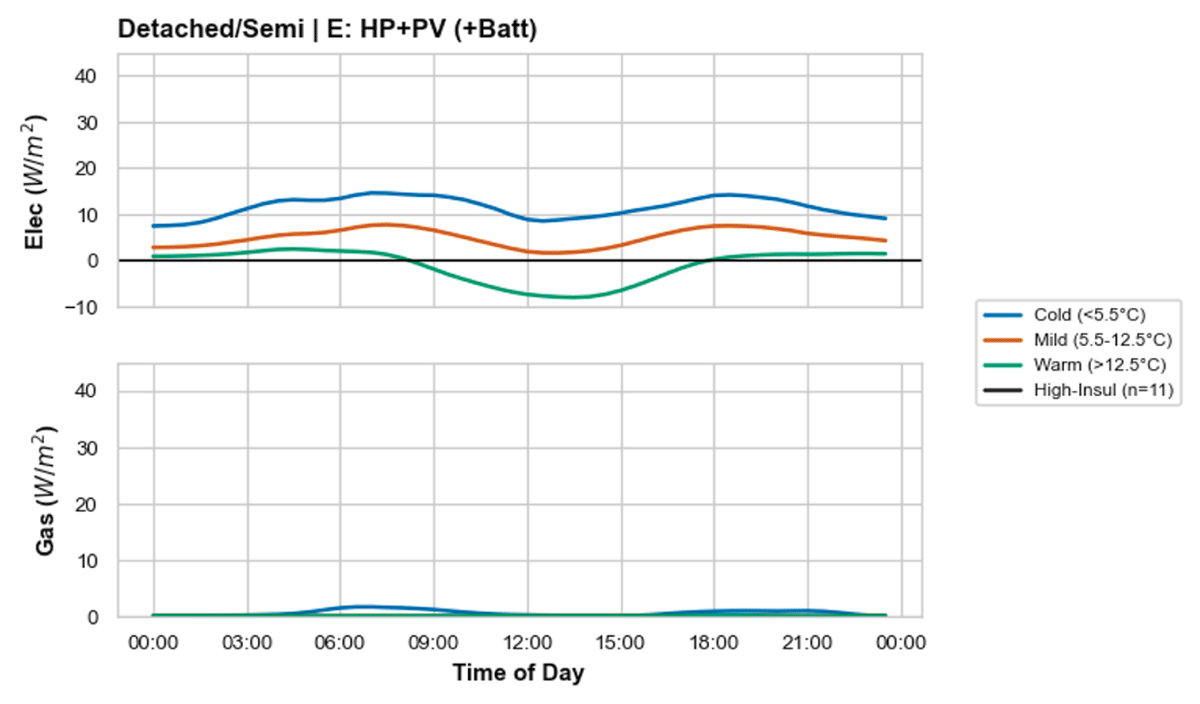
Figure 14
Diurnal Electrical Power Density (W/m2) for Group E (HP + PV + Battery, High-Insulation, Detached/Semi-Detached, n = 11*) during Cold Band. Near-zero gas signature reflects hybrid heating (gas hob retention), not complete fuel displacement.
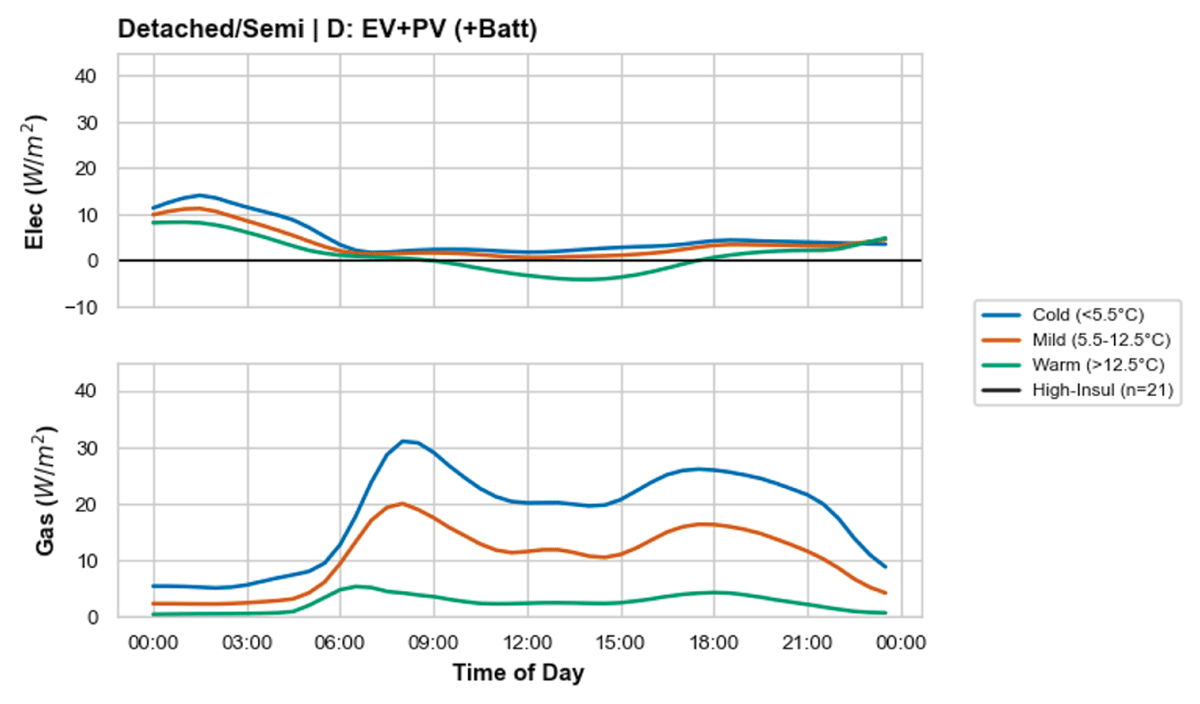
Figure 15
Diurnal Electrical Power Density (W/m2) for Group D (EV + PV + Battery, High-Insulation, Detached/Semi-Detached, n = 21*) during Cold Band. Gas peak of 25.86 W/m2 confirms likely gas-heated home; low electrical figure reflects transport decoupling only.