
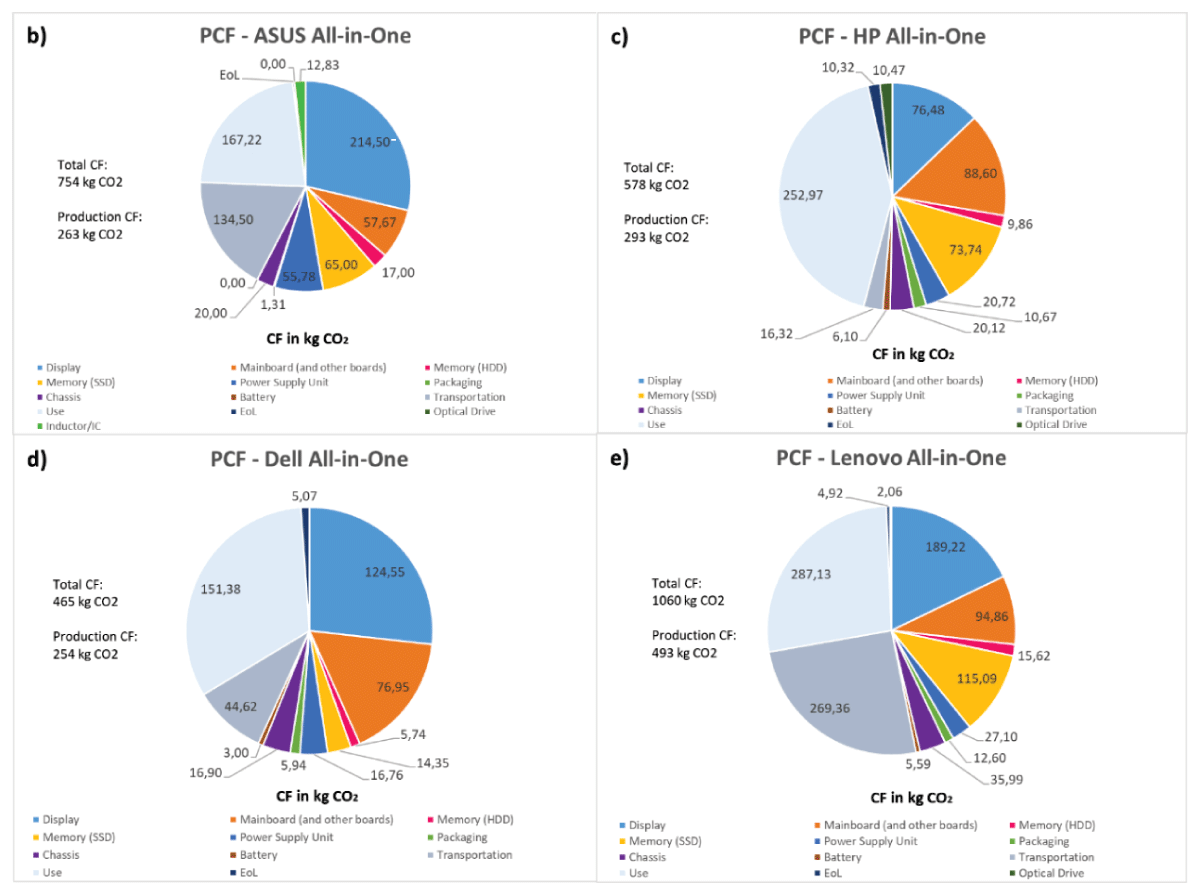
Figure 1
Product carbon footprint (PCF) of All-in-One computers: b) ASUS, c) HP, d) Dell and e) Lenovo. Data compiled and averaged by the authors from a larger number of PCF declarations by the individual OEMs.
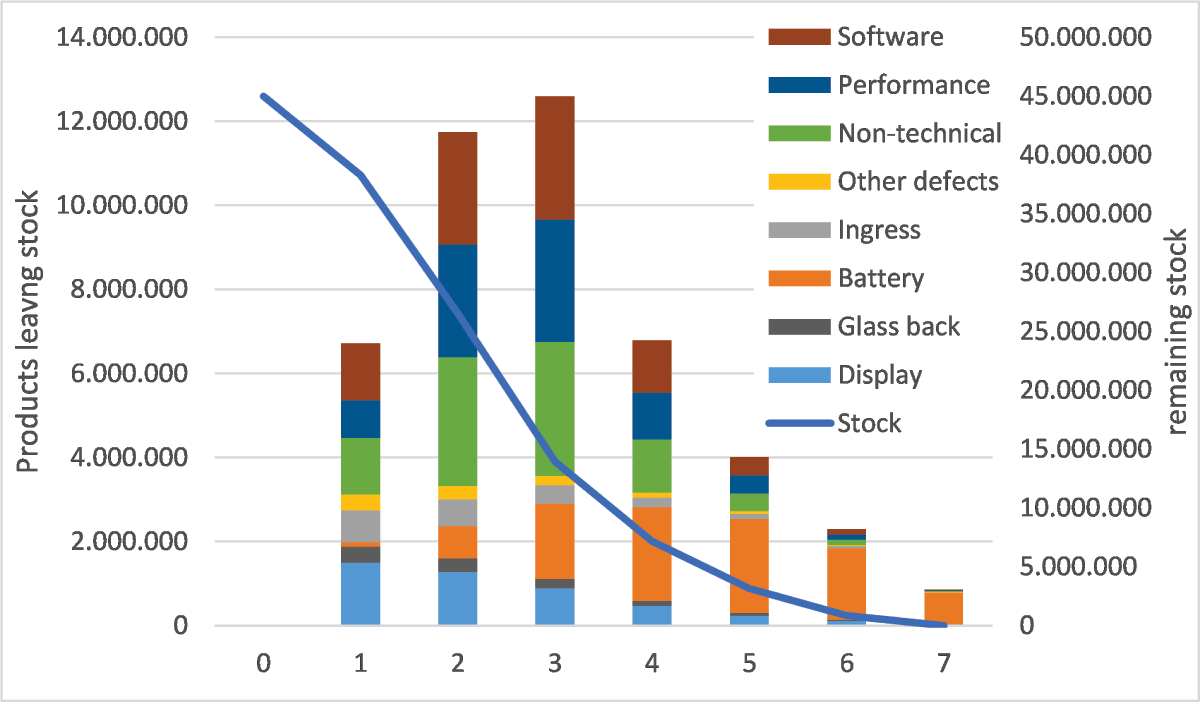
Figure 2
Lifetime model for mid-range smartphones developed in the context of EU ecodesign policy development for smartphones.
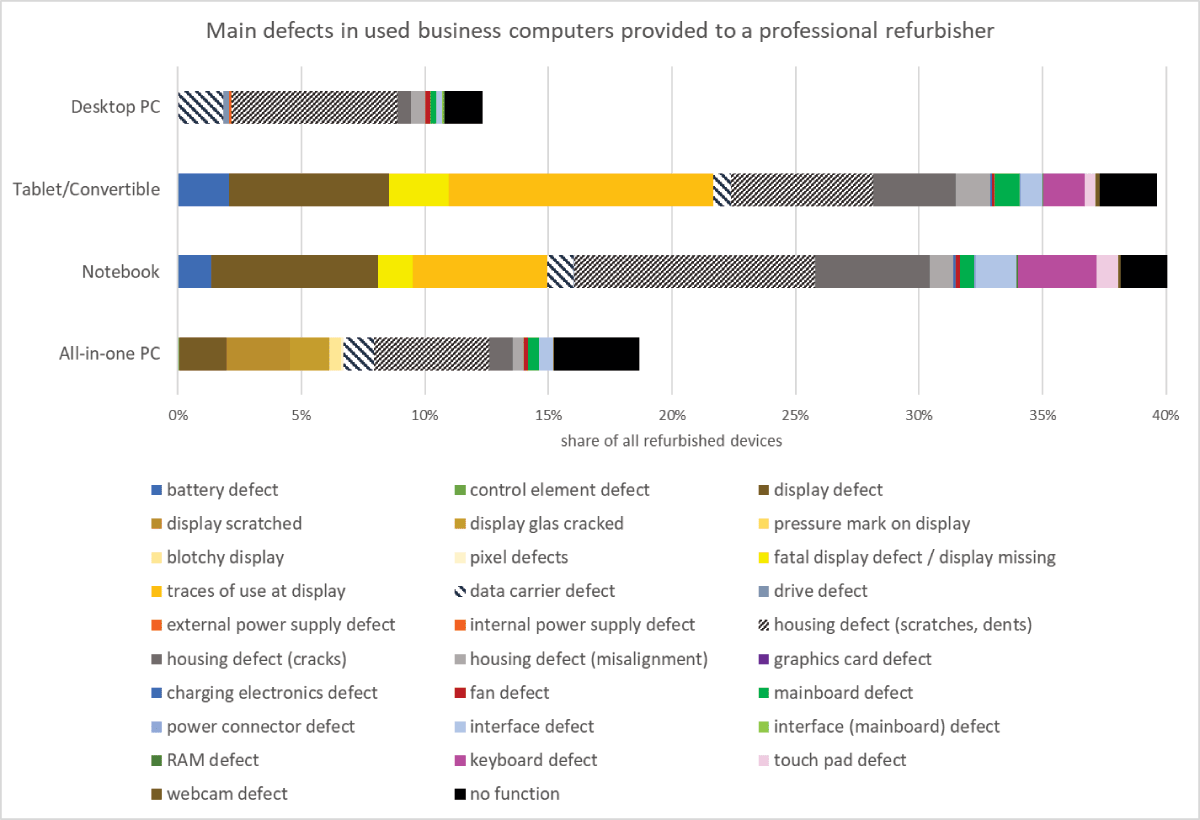
Figure 3
Main defects in used business computers.
Table 1
Warranty case rates for notebooks and desktop computers per brand (Galaxus 2026a and 2026b).
| BRAND | NOTEBOOKS | DESKTOP COMPUTERS | ||
|---|---|---|---|---|
| MARCH 2025 | MARCH 2026 | MARCH 2025 | MARCH 2026 | |
| Apple | 0.7% | 0.6% | 0.4% | 0.6% |
| Kiebel | 0.0% | |||
| Dell | 2.0% | 1.2% | 0.8% | 0.8% |
| Blackview | 1.0% | |||
| Minix | 1.1% | 1.1% | ||
| Huawei | 1.1% | 1.3% | ||
| Fujitsu | 1.4% | 1.6% | ||
| Microsoft | 1.5% | 1.5% | ||
| LG | 1.6% | 1.8% | ||
| HP | 1.9% | 2.0% | 1.3% | 1.2% |
| Lenovo | 2.6% | 2.1% | 1.4% | 1.1% |
| GMKtec | 1.4% | |||
| Geekom | 1.8% | |||
| Samsung | 1.8% | 2.2% | ||
| Acer | 2.8% | 2.5% | 2.8% | 3.6% |
| ASUS | 3.2% | 3.3% | 2.2% | 2.1% |
| Minisforum | 2.6% | |||
| Medion | 6.0% | 4.5% | 5.3% | 3.7% |
| Erazer | 3.0% | 4.6% | 4.5% | 6.4% |
| Gigabyte | 3.6% | 4.6% | ||
| MS | 6.4% | 5.4% | 1.1% | |
| CSL | 1.9% | 4.7% | ||
| Captiva | 7. 1% | 7. 1% | 6.3% | 6.3% |
| Joule Performance | 8.0% | 8.4% | ||
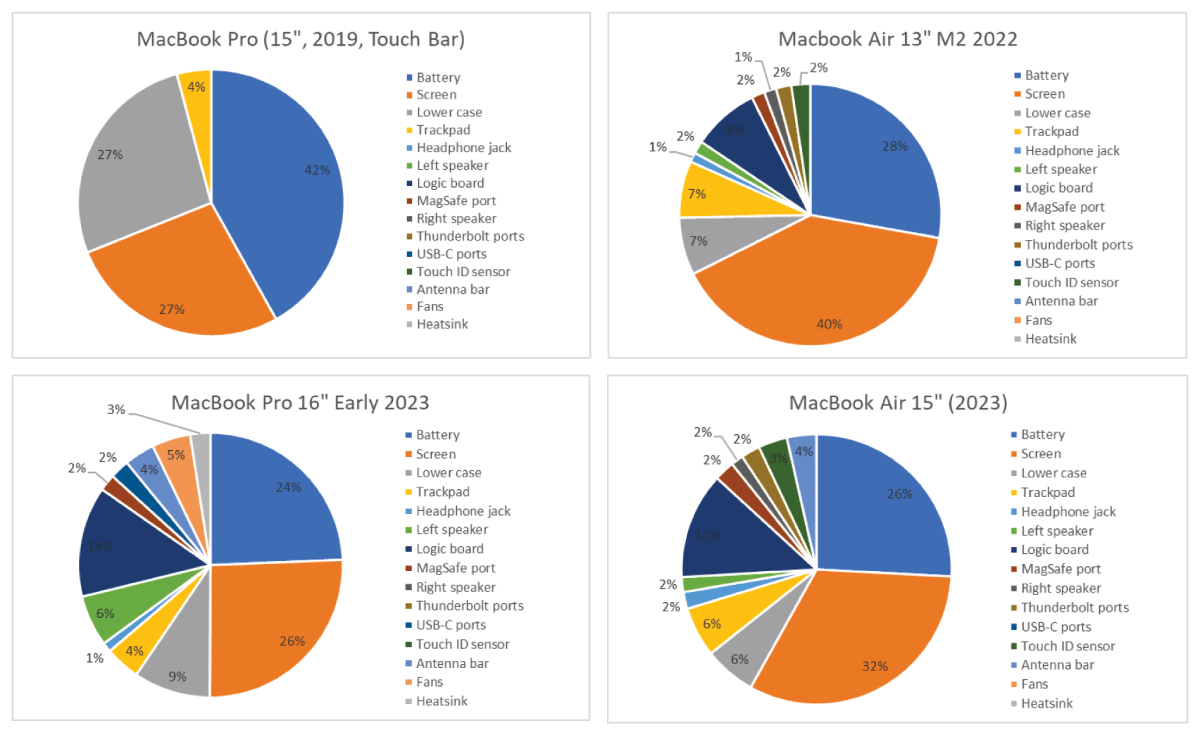
Figure 4
View statistics for selected laptops (compiled by authors based on iFixit statistics).
Table 2
Priority parts matrix, desktop computers.
| RELEVANCE VALUE | FAILURE LIKELIHOOD | |||
|---|---|---|---|---|
| LOW | MEDIUM | HIGH | ||
| Functional relevance | High | PSU Mainboard Battery** | RAM* | Storage drives (HDD/SSD*) |
| Medium | Ports and connectors | |||
| Low | Housing | |||
[i] * Typically an upgrade issue for memory/storage with a very low capacity.
** BIOS battery on mainboard.
Table 3
Priority parts matrix, All-in-one computers.
| RELEVANCE VALUE | FAILURE LIKELIHOOD | |||
|---|---|---|---|---|
| LOW | MEDIUM | HIGH | ||
| Functional relevance | High | Mainboard | Screen | |
| Medium | Webcam | |||
| Low | Housing | |||
Table 4
Priority parts matrix, notebooks.
| RELEVANCE VALUE | FAILURE LIKELIHOOD | |||
|---|---|---|---|---|
| LOW | MEDIUM | HIGH | ||
| Functional relevance | High | Mainboard | RAM* | Keyboard Display Battery Storage |
| Medium | Touchpad Switch Power supply Fan | Connectors | ||
| Low | Housing | |||
[i] * Typically an upgrade issue for memory/storage with a very low capacity.
Table 5
Failure and repair rates for computers in Germany (Wertgarantie, 2023; n = 5,322).
| FAILURE RATE WITHIN LAST 10 YEARS | OF WHICH | ||
|---|---|---|---|
| … REPAIRED | … NOT REPAIRED | ||
| Notebooks | 61% | 40% | 60% |
| Computers | 52% | 42% | 58% |
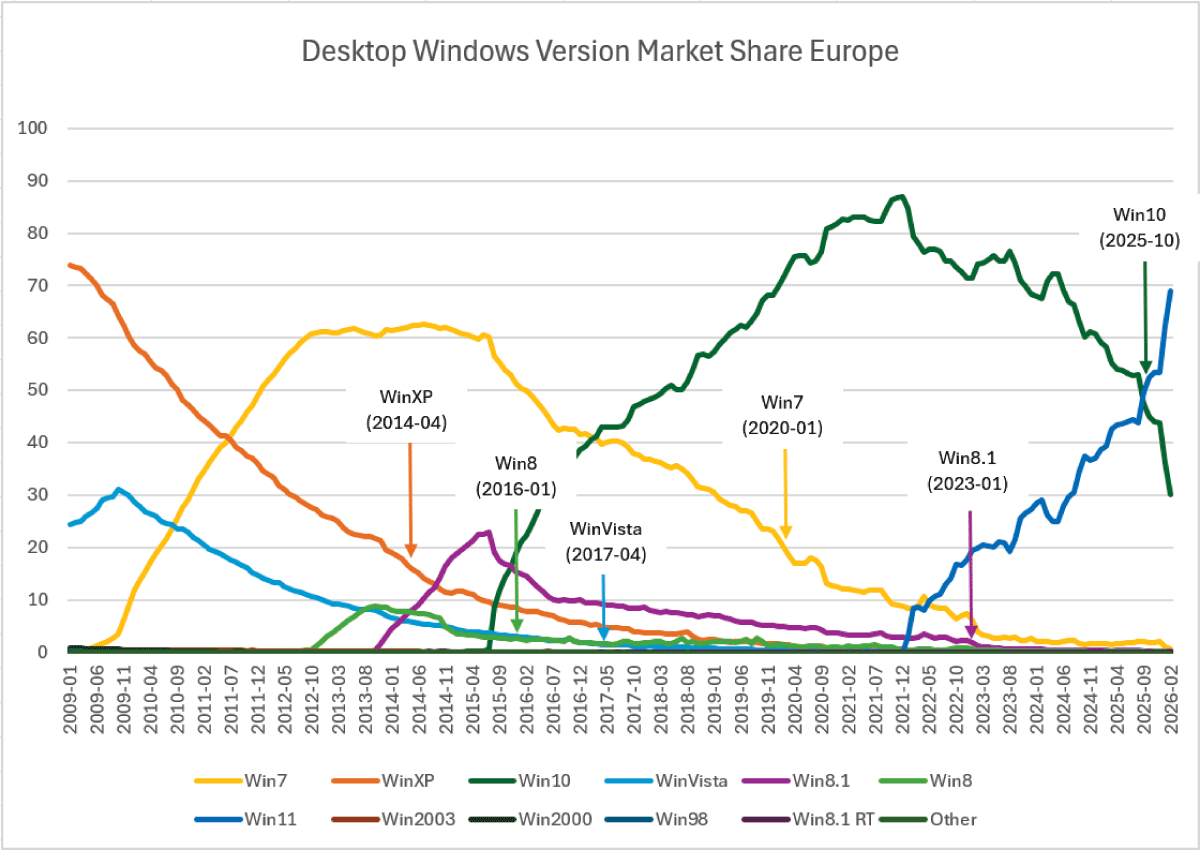
Figure 5
Desktop Windows version market share, Europe (StatCounter 2026), with end-of-support dates indicated by the authors.
Table 6
Lifetime model for notebook computers.
| NOTEBOOKS | YEAR 1 | YEAR 2 | YEAR 3 | YEAR 4 | YEAR 5 | YEAR 6 | YEAR 7 | YEAR 8 | YEAR 9 | YEAR 10 | TOTAL | |
|---|---|---|---|---|---|---|---|---|---|---|---|---|
| failure rates (products in use) | Battery | 0.0% | 0.5% | 5.0% | 6.0% | 6.5% | 6.5% | 7.0% | 7.0% | 7.0% | 7.0% | |
| Display | 1.2% | 1.2% | 1.5% | 1.7% | 1.8% | 1.8% | 1.8% | 2.0% | 2.0% | 2.0% | ||
| Keyboard/trackpad | 0.8% | 0.8% | 1.0% | 1.0% | 1.0% | 1.0% | 1.2% | 1.2% | 1.2% | 1.2% | ||
| Ports | 0.2% | 0.2% | 0.2% | 0.3% | 0.3% | 0.3% | 0.3% | 0.4% | 0.4% | 0.4% | ||
| Fans | 0.1% | 0.1% | 0.2% | 0.3% | 0.3% | 0.3% | 0.3% | 0.4% | 0.4% | 0.4% | ||
| Power supply | n/a | n/a | n/a | n/a | n/a | n/a | n/a | n/a | n/a | n/a | ||
| defect rate/year | 2.30% | 2.80% | 7.90% | 9.30% | 9.90% | 9.90% | 10.60% | 11.00% | 11.00% | 11.00% | 6.1% | |
| repair rate | 95% | 85% | 50% | 30% | 5% | 3% | 2% | 1% | 0% | 0% | 39.5% | |
| other obsolescence reasons | 0% | 0% | 0% | 10% | 30% | 60% | 73% | 80% | 87% | 90% | ||
| survival rate | 99.89% | 99.47% | 95.54% | 80.39% | 50.98% | 18.43% | 4.46% | 0.79% | 0.09% | 0.01% | ||
| average lifetime (years) | 5.00 | |||||||||||
Table 7
Lifetime model integrated desktop computers.
| INTEGRATED DESKTOP COMPUTERS | YEAR 1 | YEAR 2 | YEAR 3 | YEAR 4 | YEAR 5 | YEAR 6 | YEAR 7 | YEAR 8 | YEAR 9 | YEAR 10 | TOTAL | |
|---|---|---|---|---|---|---|---|---|---|---|---|---|
| failure rates (products in use) | Battery | n/a | n/a | n/a | n/a | n/a | n/a | n/a | n/a | n/a | n/a | |
| Display | 1.0% | 1.0% | 1.2% | 1.2% | 1.2% | 1.2% | 1.2% | 1.2% | 1.2% | 1.2% | ||
| Keyboard/trackpad | n/a | n/a | n/a | n/a | n/a | n/a | n/a | n/a | n/a | n/a | ||
| Ports | 0.2% | 0.4% | 0.5% | 0.7% | 0.7% | 0.7% | 0.7% | 0.7% | 0.7% | 0.7% | ||
| Fans | 0.0% | 1.0% | 1.5% | 1.8% | 2.0% | 2.0% | 2.0% | 2.0% | 2.0% | 2.0% | ||
| Power supply | 0.5% | 1.5% | 3.0% | 3.5% | 3.5% | 4.0% | 4.0% | 5.0% | 5.0% | 5.0% | ||
| defect rate/year | 1.70% | 3.90% | 6.20% | 7.20% | 7.40% | 7.90% | 7.90% | 8.90% | 8.90% | 8.90% | 5.6% | |
| repair rate | 90% | 85% | 75% | 50% | 10% | 5% | 3% | 2% | 1% | 0% | 43.8% | |
| other obsolescence reasons | 0% | 0% | 0% | 4% | 10% | 25% | 45% | 70% | 90% | 95% | ||
| survival rate | 99.83% | 99.25% | 97.66% | 90.38% | 75.92% | 52.67% | 26.75% | 7.32% | 0.67% | 0.03% | ||
| average lifetime (years) | 6.00 | |||||||||||
Table 8
Lifetime model desktop computers.
| DESKTOP COMPUTERS | YEAR 1 | YEAR 2 | YEAR 3 | YEAR 4 | YEAR 5 | YEAR 6 | YEAR 7 | YEAR 8 | YEAR 9 | YEAR 10 | TOTAL | |
|---|---|---|---|---|---|---|---|---|---|---|---|---|
| failure rates (products in use) | Battery | n/a | n/a | n/a | n/a | n/a | n/a | n/a | n/a | n/a | n/a | |
| Display | n/a | n/a | n/a | n/a | n/a | n/a | n/a | n/a | n/a | n/a | ||
| Keyboard/trackpad | n/a | n/a | n/a | n/a | n/a | n/a | n/a | n/a | n/a | n/a | ||
| Ports | 0.3% | 0.5% | 0.7% | 0.9% | 1.0% | 1.0% | 1.0% | 1.0% | 1.0% | 1.0% | ||
| Fans | 0.0% | 1.0% | 2.0% | 2.5% | 3.0% | 3.5% | 3.5% | 3.5% | 4.0% | 4.0% | ||
| Power supply | 0.5% | 1.5% | 3.0% | 3.5% | 3.5% | 4.0% | 4.0% | 5.0% | 5.0% | 5.0% | ||
| defect rate/year | 0.80% | 3.00% | 5.70% | 6.90% | 7.50% | 8.50% | 8.50% | 9.50% | 10.00% | 10.00% | 5.2% | |
| repair rate | 95% | 95% | 80% | 50% | 10% | 5% | 3% | 2% | 1% | 0% | 42.2% | |
| other obsolescence reasons | 0% | 0% | 0% | 5% | 10% | 25% | 45% | 75% | 90% | 95% | ||
| survival rate | 99.96% | 99.81% | 98.62% | 90.46% | 75.92% | 52.34% | 26.41% | 5.99% | 0.54% | 0.02% | ||
| average lifetime (years) | 6.00 | |||||||||||
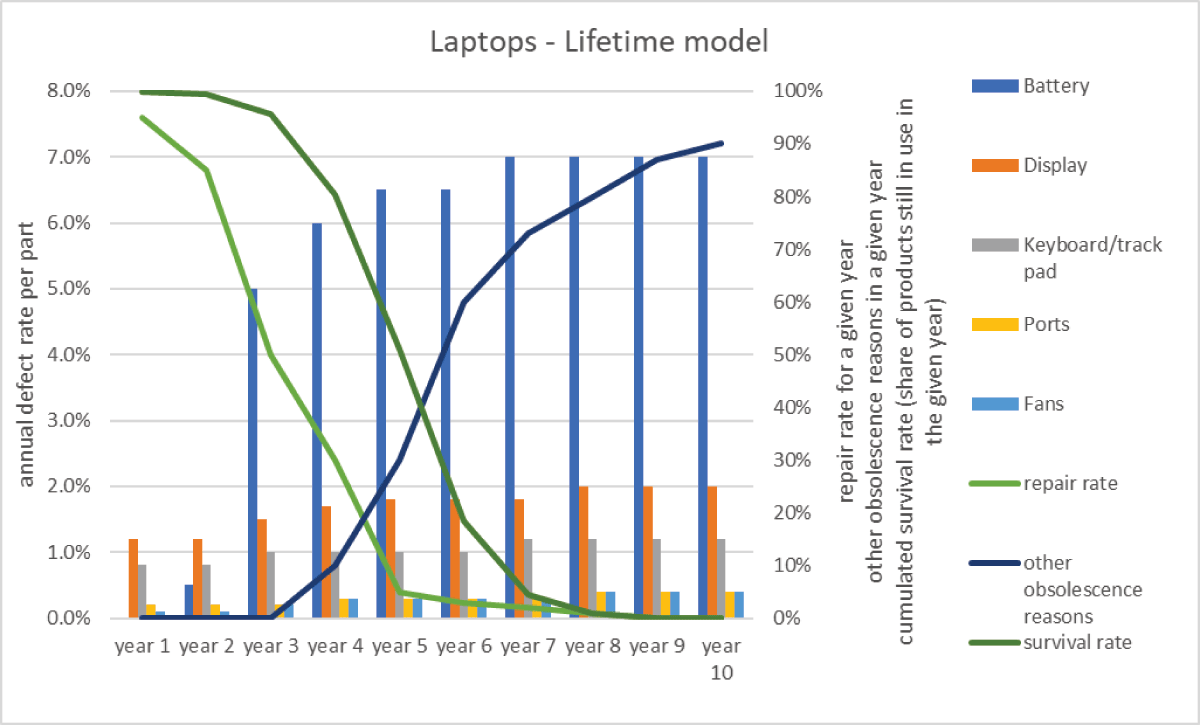
Figure 6
Lifetime model for notebook computers.
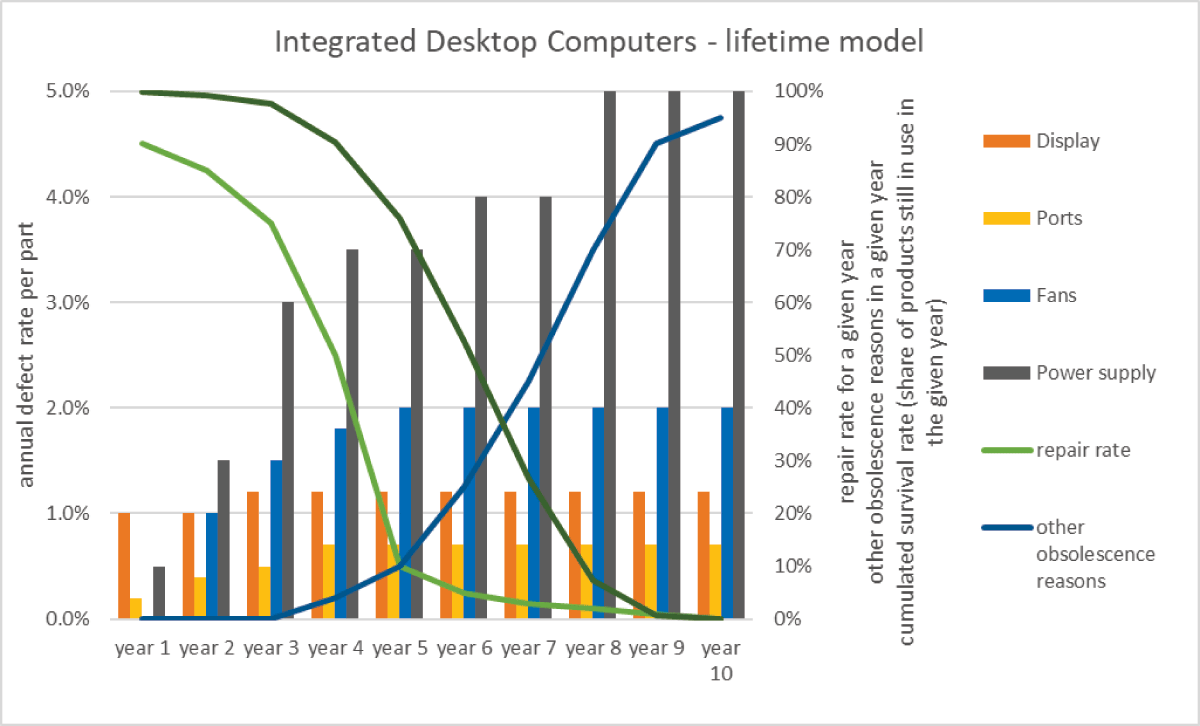
Figure 7
Lifetime model for integrated desktop computers.
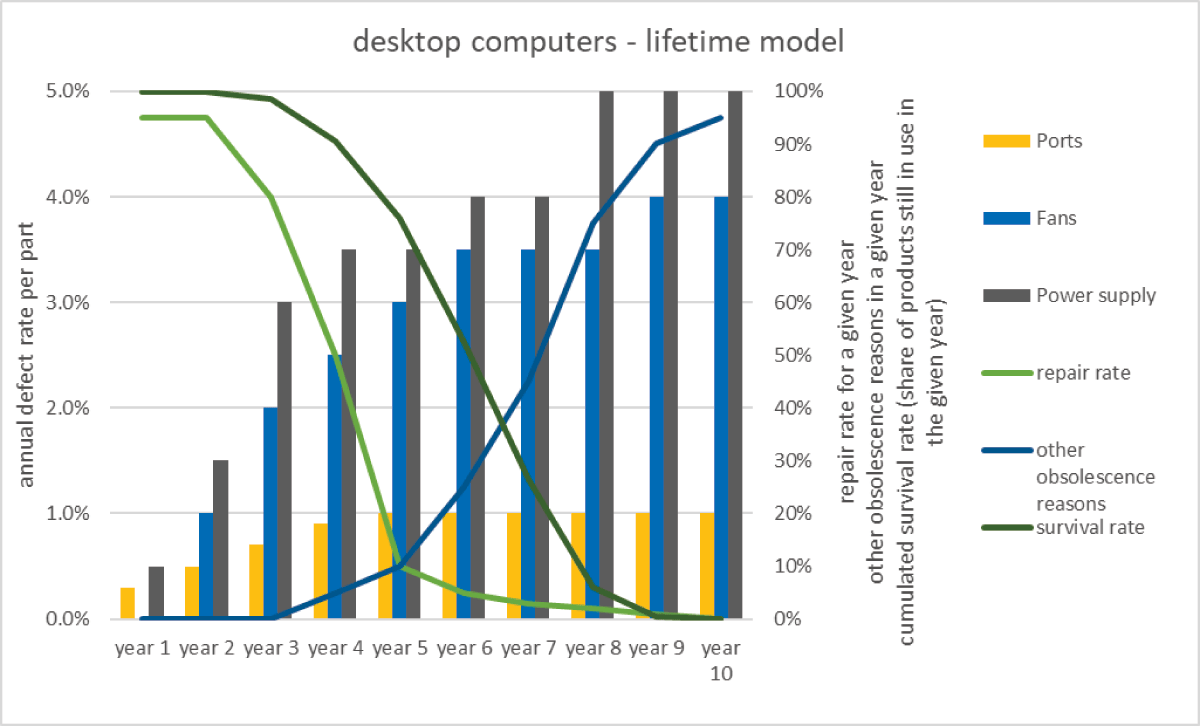
Figure 8
Lifetime model for desktop computers.
Table 9
Modelled lifetime extension per proposed policy measure.
| NOTEBOOK | INTEGRATED DESKTOP COMPUTER | (OTHER) DESKTOP COMPUTERS | UNDERLYING MODELLING ASSUMPTIONS, WHERE APPLICABLE | |
|---|---|---|---|---|
| Ecodesign measures | ||||
| Reparability | +0.1 years | +0.11 years | +0.13 years | Repair rate of 50% pushed out by 1 year |
| Resistance to accidental drops | +0.04 years | n/a | n/a | Drop related defect rate (25% of all defects) reduced by 50% |
| Water ingress protection | +0.01 years | n/a | n/a | Water ingress related defect rate (5% of all defects) reduced by 50% |
| Battery endurance | +0.05 years | n/a | n/a | Battery failure pushed out by approx. 0.5 years |
| Battery management | +0.03 years | n/a | n/a | Battery failure pushed out by approx. 0.25 years |
| Key abrasion resistance | +0.01 years | n/a | n/a | Keyboard/trackpad defects reduced by 20% from year 3 onwards |
| Operating System updates | +0.3 years | +0.31 years | +0.3 years | Other obsolescence reasons reduced by 50% in year 6–7 |
| Energy Labelling measures | ||||
| Repairability Index | +0.1 years | n/a | n/a | Repair rate of 50% pushed out by 1 year |
| Drop resistance classes | +0.04 years | n/a | n/a | Drop related defect rate (25% of all defects) reduced by 50% |
| Battery endurance indication | +0.05 years | n/a | n/a | Battery failure pushed out by approx. 0.5 years |
| Liquid ingress classes | +0.01 years | n/a | n/a | Water ingress related defect rate (5% of all defects) reduced by 50% |
Table 10
Modelled Greenhouse Gas Emissions per proposed policy measure.
| LIFE CYCLE GHG EMISSIONS PER UNIT PER YEAR OF USE (kg CO2e) | PRODUCT CATEGORY | ||
|---|---|---|---|
| POLICY OPTION/MEASURE | NOTEBOOK | INTEGRATED DESKTOP COMPUTER | DESKTOP COMPUTER |
| 1 Business as Usual (BAU) | 55.57 | 99.03 | 86.13 |
| 2 Self-Regulatory Initiative (SRI) | n/a | n/a | n/a |
| 3 Ecodesign | |||
| Reparability | 54.86 | 97.98 | 85.16 |
| Resistance to accidental drops | 55.20 | 99.03 | 86.13 |
| Water ingress protection | 55.48 | 99.03 | 86.13 |
| Battery endurance | 55.14 | 99.03 | 86.13 |
| Battery management | 55.31 | 99.03 | 86.13 |
| Key abrasion resistance | 55.48 | 99.03 | 86.13 |
| Operating System updates | 53.21 | 95.79 | 83.93 |
| 4 Energy Label | |||
| Repairability Index | 54.86 | 99.03 | 86.13 |
| Drop resistance classes | 55.20 | 99.03 | 86.13 |
| Battery endurance indication | 55.14 | 99.03 | 86.13 |
| Liquid ingress classes | 55.48 | 99.03 | 86.13 |