
Introduction
Since 1992, the European Union’s product policy has systematically addressed the environmental performance of products (Gonzalez-Torres et al. 2023), initially through energy labelling requirements focused primarily on household appliances. In 2005, a comprehensive ecodesign framework was introduced, establishing minimum environmental performance thresholds (Nissen et al., 2007). Although alignment between these two policy instruments took time, they have been co-designed by legislators latest since the late 2010s. The Ecodesign legislation has undergone two major revisions since its initial version in 2005, which targeted energy-using products. In 2009, the scope was broadened to include energy-related products, and most recently, the Ecodesign for Sustainable Products Regulation (ESPR), Regulation (EU) 2024/1781, extended coverage to encompass most product types, including semi-finished goods (European Commission 2024). Ecodesign and energy labelling regulations in the EU are developed through a structured, sciencebased policy cycle that combines technical analysis, stakeholder input, and legislative oversight. The process begins with the European Commission identifying product groups with significant environmental impact and potential for improvement. It then commissions preparatory studies that assess lifecycle impacts, technological options, market conditions, and potential energy savings and environmental impact reductions. These studies form the evidence base for draft implementing measures. Measures are regularly reviewed.
Rationale for a policy focus on circularity
While in the past the focus has been on the reduction of energy consumption, more holistic improvements shifted into the focus in recent years (Barkhausen et al. 2022, Barkhausen and Durand 2024, Bundgaard et al. 2024). The implementation of ecodesign requirements and an energy efficiency label for mobile phones and slate tablets under EU Commission Regulations (EU) 2023/1670 and 2023/1669 (European Commission 2023a and 2023b) marked a significant shift in these product policies for electrical and electronics equipment (Nusser and Fehse 2025). From a life cycle perspective such measures targeting at better circularity of devices holistically contribute to decarbonization. This readjustment of the EU ecodesign product policy is enshrined in the Ecodesign for Sustainable Products Regulation (ESPR), Regulation (EU) 2024/1781 (European Commission 2024), which constitutes a further development of the Ecodesign of Energy-related Products Framework Directive 2009/125/EC (European Parliament and Council, 2009).
This development reflects a widening of EU product policy from reducing use-phase energy demand towards addressing impacts across the product life cycle. Viewed holistically, this transition is logical, given that numerous energy-consuming product categories have achieved significant advances in energy efficiency. As a result, it is now reasonable to support the prolonged use of current energy-efficient products. In previous periods, when energy efficiency was lower, prioritising product lifespan may have produced counterproductive outcomes, as confirmed by recent research (Alfieri and Spiliotopoulos, 2023; Dalhammar and Richter, 2026). Furthermore, the fact that decreasing lifetimes have been observed for some product groups (Dalhammar, Milios, and Richter, 2021), together with the notion that products have shorter lifespans due to what is framed as ‘planned obsolescence’ (Maitre-Ekern and Dalhammar, 2016), made lifetime extension a viable political goal over the last ten years. Under the ESPR, product parameters may therefore cover durability, reliability, reparability, upgradeability, recycled content, and other resource-efficiency aspects in addition to energy performance. It should, however, be noted that, for energy-related products, Directive 2009/125/EC already provided a framework for holistic ecodesign approaches (Stobbe et al., 2009; Maxwell et al., 2011). However, it was rarely fully exploited because the focus was on energy consumption during use and because appropriate standards were lacking, even though such standards are essential for robust circularity requirements (Schischke et al., 2022; Bundgaard and Huulgaard, 2023). Further, research on the correlations of reliability and environmental impacts is rare (Middendorf et al., 2012). For computers, this broader ecodesign perspective is particularly relevant because a large share of life-cycle greenhouse gas emissions arises from component and device manufacturing, as illustrated below.
Product Carbon Footprints (PCF), illustrate the rationale for such a shift. Figure 1 shows averaged data for All-in-One computer models, also called integrated desktop computers, by four different manufacturers.
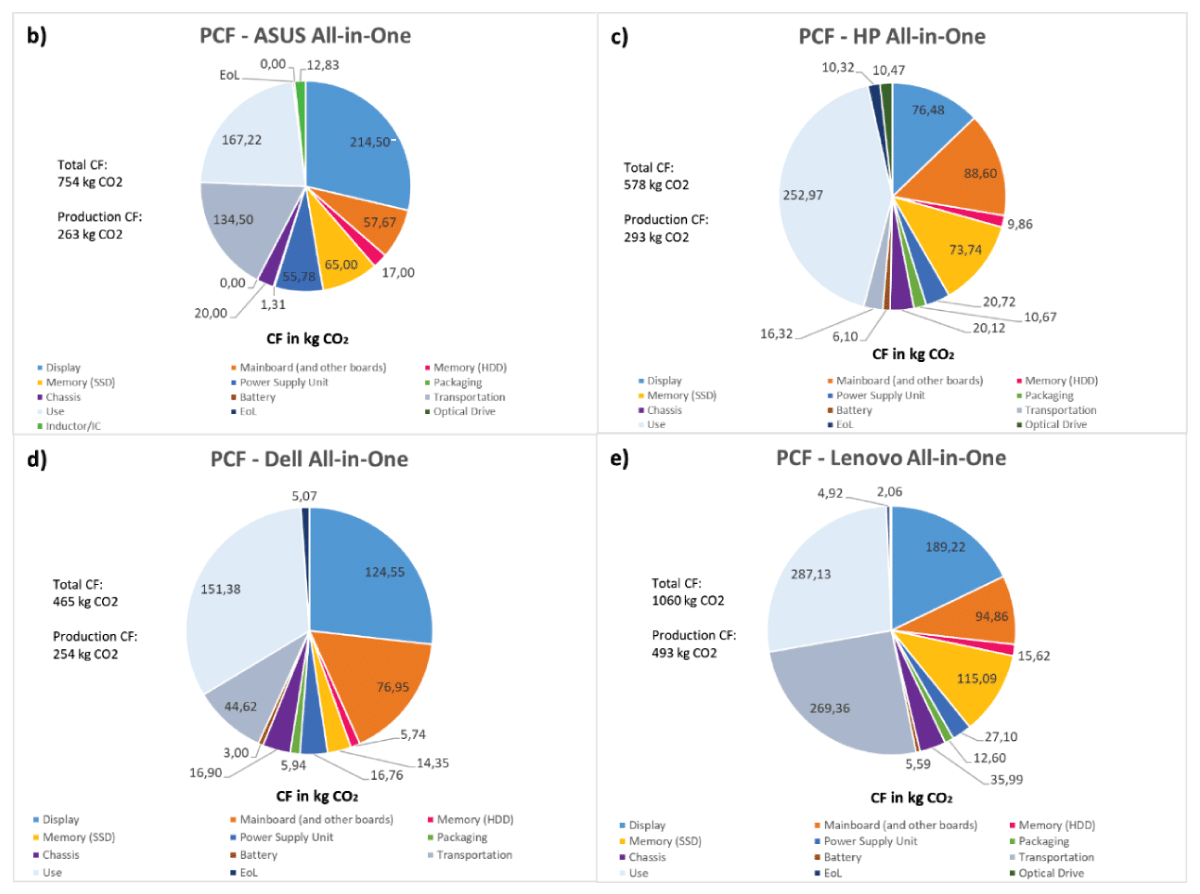
Figure 1
Product carbon footprint (PCF) of All-in-One computers: b) ASUS, c) HP, d) Dell and e) Lenovo. Data compiled and averaged by the authors from a larger number of PCF declarations by the individual OEMs.
Typical for modern IT devices is a shift of the environmental impact from the use phase, i.e. from energy consumption in the various modes, to the manufacturing phase of the numerous components and sub-assemblies, in case of integrated desktop computers dominated by the display panel, mainboard assembly, and the semiconductors of solid-state drives. The impact of the manufacturing phase is even more dominant for mobile devices. End of life in such studies is typically calculated with logistics impacts only and not with credits for recycled materials and therefore shows up with some environmental impacts. However, even if recycling impacts would be considered with credits for recovered materials, these credits would still be minor in terms of carbon savings compared to manufacturing (Böttner, Schischke and Nissen, 2011). The main reason is the very energy intensive production of displays, printed circuit boards and semiconductors, which cannot be recovered through raw material recovery at end of life. Under these conditions measures to extend the service life of products is the main lever to reduce greenhouse gas emissions holistically, as it is supposed to lead to fewer devices being produced. The positive environmental effect of lifetime extension for information technology devices has been demonstrated by Ardente et al. (2018), Proske et al (2020), Pamminger, Glaser, and Wimmer (2021) and others, although in specific cases – network equipment in particular – this might not hold true (Andrae 2023).
Although this paper focuses on quantifying environmental impacts related to climate change, it is important to recognize that product designs incorporating circularity principles often provide additional significant environmental benefits, including improved resource efficiency (Schischke et al. 2019; Böckin et al. 2020).
Lifetime assessments in EU policy context
A comprehensive lifetime model is essential for assessing the potential effects of individual ecodesign measures in a policy context, as it enables the quantification of their impacts across the entire life cycle of a product. Gama Caldas et al. (2024) developed an approach, how to model lifetime effects of ecodesign measures as part of the revision of the Methodology for Ecodesign of Energy-related Products (MEErP). This approach has to be used for policy analyses under the Ecodesign Directive 2009/125/EC. The lifetime model by Gama Caldas et al. is based on a semi-quantitative classification of reliability, repairability, repair costs, and upgradeability translated into a lifetime Weibull distribution. Weibull models are widely used to describe product failure behaviour because they can represent decreasing, constant, and increasing failure rates through the shape parameter β and have therefore become a standard tool for reliability analysis and life testing (Meeker and Escobar 1998; Abernethy 2006). The model proposed by Gama Caldas et al., despite its overall merits, tends to overestimate the positive effects of repairability, neglects other obsolescence reasons (Jaeger-Erben and Hipp, 2018), and is furthermore not granular enough to consider differences in failure mechanisms per priority part. Therefore, in the context of the Impact Assessment for regulations on ecodesign and energy labelling of mobile phones and tablets (European Commission, 2022) a modified approach has been developed and applied, as depicted for mid-range smartphones in Figure 2: The model refers to the main reasons for smartphone obsolescence, which are defects of display, glass back cover (if any), battery, water ingress and other defects, but also non-technical reasons for obsolescence, performance – typically in comparison to performance of latest models on the market and new features –, and software related obsolescence. As a permissible simplification product obsolescence is fully attributed to these reasons, even though in reality there are many more reasons for the termination of service life. No distinction is made for first use and potential second or third use cycles. Relevancy of these obsolescence reasons changes over time and accordingly products placed on the market in a given year are leaving the stock of products in use over time. On average, the product lifetime is 3 years for this mid-range market segment, but some units will leave the stock of products earlier than others, and there is a tail of products reaching much longer lifetimes. Maximum lifetime for the purpose of this modelling is assumed to be 7 years (Proske 2022, Schischke et al., 2021).
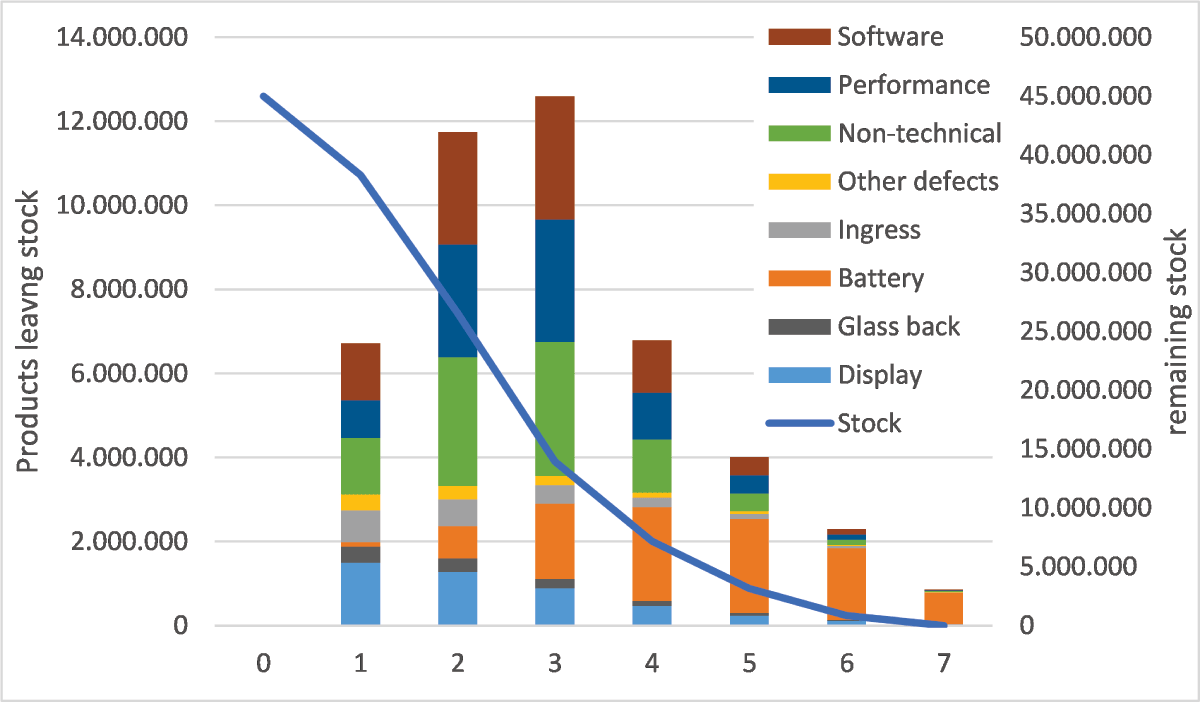
Figure 2
Lifetime model for mid-range smartphones developed in the context of EU ecodesign policy development for smartphones.
Following this example a similar model was set up for computers in the context of the impact assessment for a revision of Commission Regulation (EU) No 617/2013 on ecodesign requirements for computers and computer servers (European Commission 2013, Siderius and Tosoratti 2024). Several strands of evidence can serve as a foundation for developing such a model. Literature provides partial insights into component durability, failure rates, and patterns of device obsolescence. In addition, previously unpublished company data have been made accessible to the authors, offering a sufficiently robust, though not fully representative, empirical basis for a lifetime model.
The key data elements required for a lifetime model include quantitative information on the components and assemblies that most frequently fail. These data encompass failure rates and assumptions regarding how these rates evolve over time, reflecting user behaviour. Equally important are estimates or empirical observations on the proportion of defective devices that are repaired rather than discarded, as this directly influences the effective service life and material efficiency of the product group. Beyond failure-induced end-of-life events, the model must also incorporate additional drivers of obsolescence that are unrelated to technical defects, such as software incompatibility, performance degradation relative to user needs, or market-driven replacement cycles. Although computer products were subject to various analysis regarding circularity aspects (e.g. Viegand Maagøe and VITO 2017, Tecchio et al. 2018, Cordella et al. 2019, Kemna et al. 2020) it is important to refer to most recent data as technology of computers is still subject to short innovation cycles.
Together, these elements form the structural backbone of a lifetime model capable of supporting ecodesign policy analysis. Such a model can simulate realistic lifetime distributions and evaluate how specific design interventions, such as improved durability, modularity, or repairability, might extend product lifetimes and reduce environmental impacts.
Computer lifetime relevant data
Current service lifetime of computer products in the European Union is 5 years for notebooks and 6 years for desktop computers, including integrated desktop computers (Tecchio et al. 2018, European Commission et al. 2025).
According to a survey (European Commission 2020), the main reason for users to purchase a new digital device was that the old device broke (38%), and most respondents would like to keep using their current device for at least 5 years, under the condition, that there is no major drop in performance. The most common technical lifetime limiting factors for computers, according to Viegand Maagøe and VITO (2017), were software related and due to defects of sub-assemblies, such as keyboards and displays, or due to the ageing of batteries. For notebooks, the two main reasons of total loss or serious damage were spillover of liquids and bumps or falls, generally from the desk. More recent data is now sourced by the authors and documented below.
Priority parts and failure rates
Data sources and derived statistics presented in this chapter are related to priority parts and failure rates including
condition of computers at a large refurbisher
the warranty case rates of computers from an online retailer
insurance cases of computers from a large consumer IT insurance provider
access to repair instructions on a leading online platform for manufacturer independent repair guidance
The four sources were selected because no single dataset covers the complete causal chain from component failure to repair or product replacement. Refurbisher data provide component-level observations after predominantly business use, retailer warranty data cover early-life failures under warranty but exclude accidental damage, insurance data capture accidental and wear-related damage among insured consumer devices, and repair-platform access statistics indicate relative repair interest but not population failure rates. The sources are therefore not pooled into one statistical sample. Instead, they are triangulated: each source is used only for the parameter for which its scope is informative, and the resulting parameter values are checked for consistency across sources. The model is calibrated to the observed product-level lifetime of five years for notebooks and six years for desktop products. The resulting parameters should be interpreted as policy-modelling assumptions constrained by field evidence, not as representative EU incidence estimates.
Comparable field data have only rarely been made available for research. Researchers have occasionally analysed warranty data beyond its immediate business context (Wu, 2012), while studies have also examined defects in used products, such as laptops, to improve remanufacturing strategies (Anandh, Prasanna Venkatesan and Venkatadri, 2024). The Restart Project (2026) provides another comprehensive source of repair statistics, based on data from repair cafés and similar activities. Although this source was also screened in the present research, it was found to focus mainly on computer products from the 2010s. As a result, it was considered potentially misleading when defining policy requirements for computers placed on the market from 2028 onwards, depending on when the legislation is adopted.
One major source of data is a refurbishing company (Anonymous Refurbisher, 2023) that primarily handles returned business-to-business computers. Incoming devices are inspected for defects, including technical failures, cosmetic and dirtrelated issues. Some units are cannibalized upon arrival, typically missing memory modules and occasionally other components. These cases were excluded from the statistics so that only genuine technical defects and significant cosmetic issues are represented (Figure 3). Software-related problems are not included.
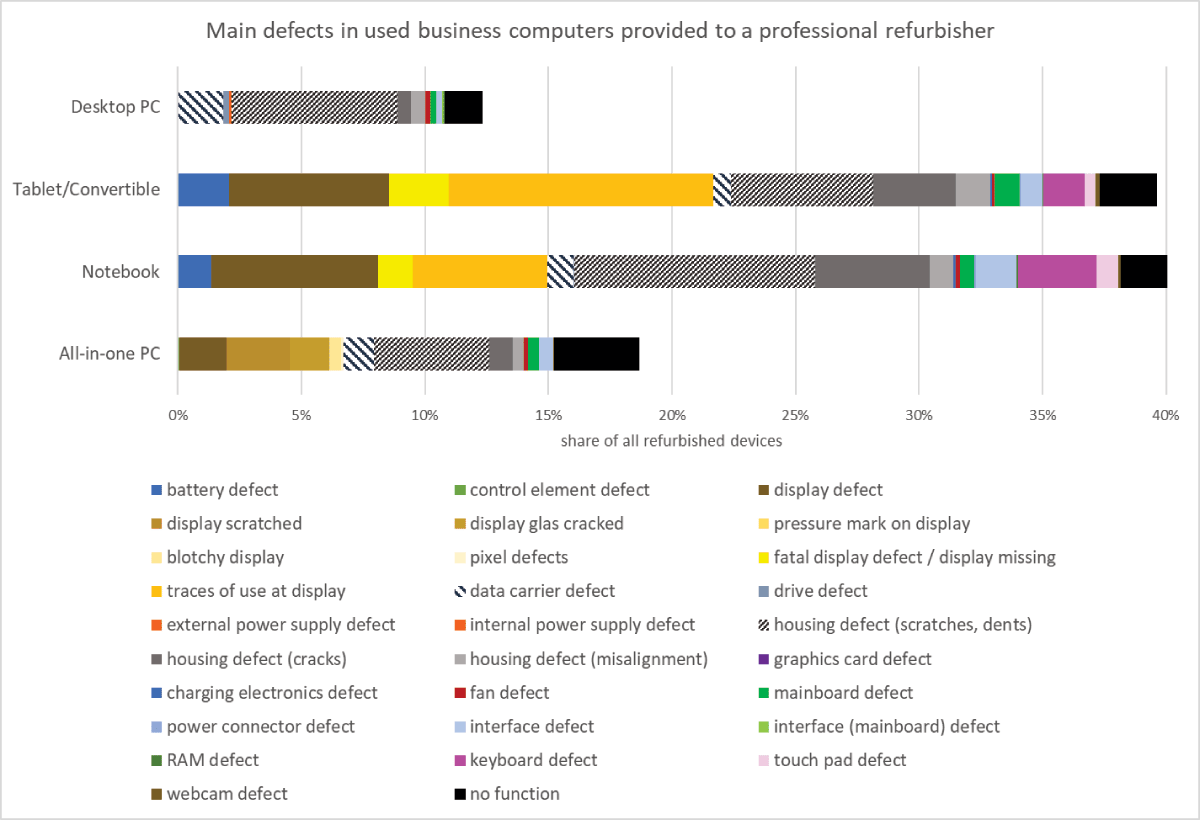
Figure 3
Main defects in used business computers.
The dataset covers more than 250,000 refurbished computers processed over recent years.
Defect rates are markedly higher for tablets/convertibles, understood to be largely synonymous with the definition of tablet computers, and for notebooks than for other product categories. Nearly 40% of these devices exhibit at least one identified defect. A substantial share of these findings, however, relates to traces of use on the display, which reduce resale value but typically do not require screen replacement. The same applies to housing defects, such as scratches or dents, which often do not necessitate replacing the enclosure.
Among the defects that do require intervention, actual display malfunctions are the most common, whereas batteryrelated issues occur less frequently. This pattern is consistent with the typical threeyear use history of the devices in the dataset, a period that typically does not yet impose critical limitations on battery performance.
In contrast, desktop products show failure rates below 20%, even when cosmetic issues are included. Purely hardwarerelated defects account for only a small proportion of these cases.
Online retailer Galaxus (2026a, 2026b) publishes a warranty case rate, indicating which share of devices is returned with a defect within the first two years, i.e., the warranty period (Table 1). Galaxus distinguishes per brand. As defects caused by drops or water spillage are not covered by warranty, such cases are not included in the published case rates.
Table 1
Warranty case rates for notebooks and desktop computers per brand (Galaxus 2026a and 2026b).
| BRAND | NOTEBOOKS | DESKTOP COMPUTERS | ||
|---|---|---|---|---|
| MARCH 2025 | MARCH 2026 | MARCH 2025 | MARCH 2026 | |
| Apple | 0.7% | 0.6% | 0.4% | 0.6% |
| Kiebel | 0.0% | |||
| Dell | 2.0% | 1.2% | 0.8% | 0.8% |
| Blackview | 1.0% | |||
| Minix | 1.1% | 1.1% | ||
| Huawei | 1.1% | 1.3% | ||
| Fujitsu | 1.4% | 1.6% | ||
| Microsoft | 1.5% | 1.5% | ||
| LG | 1.6% | 1.8% | ||
| HP | 1.9% | 2.0% | 1.3% | 1.2% |
| Lenovo | 2.6% | 2.1% | 1.4% | 1.1% |
| GMKtec | 1.4% | |||
| Geekom | 1.8% | |||
| Samsung | 1.8% | 2.2% | ||
| Acer | 2.8% | 2.5% | 2.8% | 3.6% |
| ASUS | 3.2% | 3.3% | 2.2% | 2.1% |
| Minisforum | 2.6% | |||
| Medion | 6.0% | 4.5% | 5.3% | 3.7% |
| Erazer | 3.0% | 4.6% | 4.5% | 6.4% |
| Gigabyte | 3.6% | 4.6% | ||
| MS | 6.4% | 5.4% | 1.1% | |
| CSL | 1.9% | 4.7% | ||
| Captiva | 7. 1% | 7. 1% | 6.3% | 6.3% |
| Joule Performance | 8.0% | 8.4% | ||
Warranty case rates range from 0.4%/2 years to 8.4%/2 years for desktop computers, with one small brand at 0% warranty case rate, and from 0.6%/2 years to 7.1%/2 years for notebooks. Given the market shares of the various vendors a derived average warranty case rate for desktop computers is approximately 1.4%/2 years, and for notebooks 2.1%/2 years, i.e. failures covered by warranty.
According to data from an IT insurance company (Anonymous Insurance Company 2025) the annual share of notebook computers for which an insurance claim is filed is 4% of all insured devices. The most frequently reported damages are wear and tear and drop/fall damage, the latter accounting for 1/4 of all cases. Battery defects represent 8% of cases, and water/moisture 5%. This results in the following annual defect rates, with the value for batteries likely depending heavily on the age of the device or battery:
Drop/fall damage: 1%
Battery defects: 0.3%
Water/moisture damage: 0.2%
For drop-related defects, the following components are most commonly affected:
Display (about 50%)
Chassis (about 20%)
Mainboard (about 10%)
Other damages are distributed across a wide range of additional components.
For water- or moisture-related defects, the following components are most commonly affected:
Mainboard (just under 50%)
Keyboard (about 15%)
Charging ports and other connectors together account for about 2% of water/moisture-related defects.
For desktop computers, the annual share of devices for which an insurance claim is filed is 8% of all insured devices, with a considerable range depending on the manufacturer. The most frequently reported damages are wear and tear and drop/fall damage (the latter accounting for 1/4 of all cases). Water/moisture is the cause in almost 5% of cases. This results in the following annual defect rates:
Drop/fall damage: 2%
Water/moisture damage: 0.4%
For drop-related defects, the following components are most commonly affected:
Display (over 40%)
Chassis (about 15%)
Mainboard (about 13%)
Other damages are distributed across a wide range of additional components.
For water- or moisture-related defects, the mainboard (about 40%) is most commonly affected.
Access statistics to repair instructions from third party platforms, such as iFixit (Shi 2019, Mehnert 2023, Shi 2022, Frauenheim 2023), can serve as an indication of which defects are encountered more frequently than others. However, repair instructions labelled for specific parts might be consulted as a proxy for another defect part, e.g. the instruction for the removal of the base cover might be consulted to get access to internal defect parts and not to replace the base cover as such. Figure 4 depicts the view statistics for 4 Apple MacBook models, two from the MacBook Pro series and two from the MacBook Air series, both with a model which has been launched 2–3 years before and another model few years longer on the market, as defect rates per part might change over time. Statistics for other brands cannot be derived from iFixit data due to either missing repair instructions or very limited access rates.
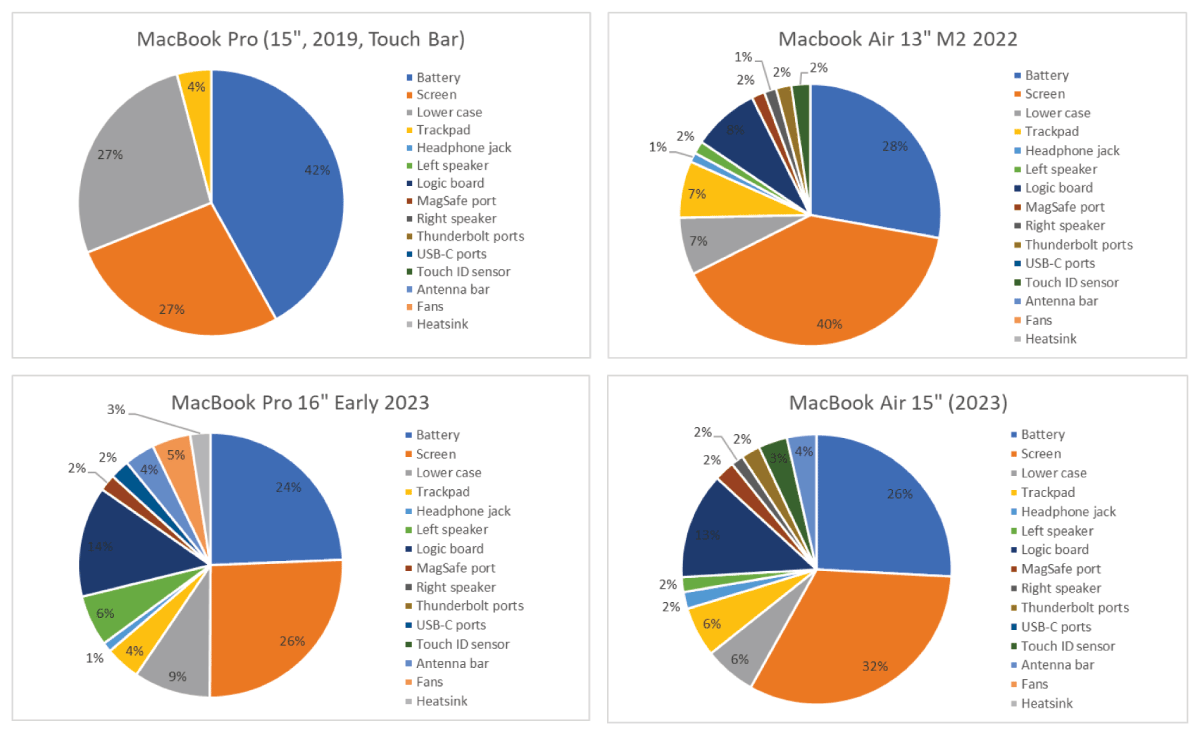
Figure 4
View statistics for selected laptops (compiled by authors based on iFixit statistics).
In all cases the statistics are dominated by battery and screen. Track pad seems to be the next most relevant part, assuming that lower case only provides access to other parts. Speakers and, where present, fans are moderately relevant as well.
Apparent differences between sources mainly reflect population and observation-window differences rather than directly contradictory measurements. For example, the refurbisher dataset includes cosmetic findings after approximately three years of business use, the retailer rates cover warranty cases during the first two years and exclude drops and liquid damage, and the insurance data refer to annual claims among insured devices. Consequently, absolute percentages are not compared directly. They are used to identify relevant failure modes, plausible orders of magnitude and age profiles before calibration of the annual rates in Tables 6, 7, 8.
Based on above sources and defect statistics, which provide nuanced views for business devices and end-consumer devices with a broad span in terms of device ages matrices to identify priority parts following the methodology developed and advanced by DG JRC (Sanfelix et al. 2019) are shown in Tables 2, 3, 4. The approach is based on a semi-quantitative rating of failure likelihood – which can be derived from above field data – and functional relevancy, i.e., whether a component is essential for the primary function of a device.
Table 2
Priority parts matrix, desktop computers.
| RELEVANCE VALUE | FAILURE LIKELIHOOD | |||
|---|---|---|---|---|
| LOW | MEDIUM | HIGH | ||
| Functional relevance | High | PSU Mainboard Battery** | RAM* | Storage drives (HDD/SSD*) |
| Medium | Ports and connectors | |||
| Low | Housing | |||
[i] * Typically an upgrade issue for memory/storage with a very low capacity.
** BIOS battery on mainboard.
Table 3
Priority parts matrix, All-in-one computers.
| RELEVANCE VALUE | FAILURE LIKELIHOOD | |||
|---|---|---|---|---|
| LOW | MEDIUM | HIGH | ||
| Functional relevance | High | Mainboard | Screen | |
| Medium | Webcam | |||
| Low | Housing | |||
Table 4
Priority parts matrix, notebooks.
| RELEVANCE VALUE | FAILURE LIKELIHOOD | |||
|---|---|---|---|---|
| LOW | MEDIUM | HIGH | ||
| Functional relevance | High | Mainboard | RAM* | Keyboard Display Battery Storage |
| Medium | Touchpad Switch Power supply Fan | Connectors | ||
| Low | Housing | |||
[i] * Typically an upgrade issue for memory/storage with a very low capacity.
Evidence for desktop computers is derived inter alia from above data sources. There are some upgrade issues with older personal computers, according to defect and repair statistics, but actual defects are rare (Table 2). HDDs used to fail moderately often among desktop computers, but as these devices in the meantime almost exclusively feature solid-state disks (SSDs), there are hardly any parts, which count as priority parts of high relevancy.
Due to the assessment of devices for refurbishment above the only critical part in all-in-one computers is the screen (Table 3). All other parts, similar to desktop computers are not considered critical.
Among notebooks there is a longer list of parts, which have to be considered priority parts as they are found in the segments where both, failure likelihood (including capacity limitations) and functional relevance are at least medium (Table 4). These are:
Keyboard
Screen
Battery
Storage
RAM
Ports and connectors
Repair rates
A survey (Wertgarantie 2023) in Germany researched failure rates for electrical and electronics equipment and results for categories notebooks and computers, excluding monitors, are provided in Table 5. According to these figures 36% of notebook owners faced a defect in the last 10 years and did not get it repaired. The data however does not state, whether a primary, thus essential function was affected and if the product was then used despite this defect or whether this defect then led to terminating the use of this device.
Table 5
Failure and repair rates for computers in Germany (Wertgarantie, 2023; n = 5,322).
| FAILURE RATE WITHIN LAST 10 YEARS | OF WHICH | ||
|---|---|---|---|
| … REPAIRED | … NOT REPAIRED | ||
| Notebooks | 61% | 40% | 60% |
| Computers | 52% | 42% | 58% |
The failure and repair rates presented in Table 5 serve as an empirical basis for determining the average probability of repair. However, the survey did not ask to specify the component affected, the outcome of the repair, post-repair lifespan, or whether discontinuation was due to an unrepaired defect–all factors which matter in real life. Consequently, the derived lifetime model must account for variations in repair probability according to device age and use the survey value as an average calibration point, rather than applying a uniform repair rate across all defects and years, which may result in misleading conclusions.
Product replacement due to end of OS support
Caddy and Jessop (2023) estimated that worldwide 20% of computers become obsolete and are scrapped in 2024 and 2025 due to incompatibility with Windows 11 and the termination of updates on October 14, 2025.
Statistics on computer operating systems in use (StatCounter 2026) show that among the Windows computers Windows 10 was still dominating as of mid 2025 although Windows 10 was announced not to receive any security updates from fall 2025 onwards, with some exceptions. With the end of support the use of Windows 10 systems dropped drastically, assuming that some machines, where this was technically feasible, could be migrated to Windows 11, others faced end of service life (Figure 5). As this is a very recent development it is worthwhile to look at similar situations in the past: Support of Windows 7 ended January 2020. At this point of time market share of Windows 7 already was much lower than of Window 10 today. The situation therefore is not fully comparable, but what is evident from prior cases is the fact, that the end of OS support does not necessarily mean, that all devices, which cannot be updated reach their end of service life. It is apparent that many users seem to continue the use, which are subject to potential security issues.
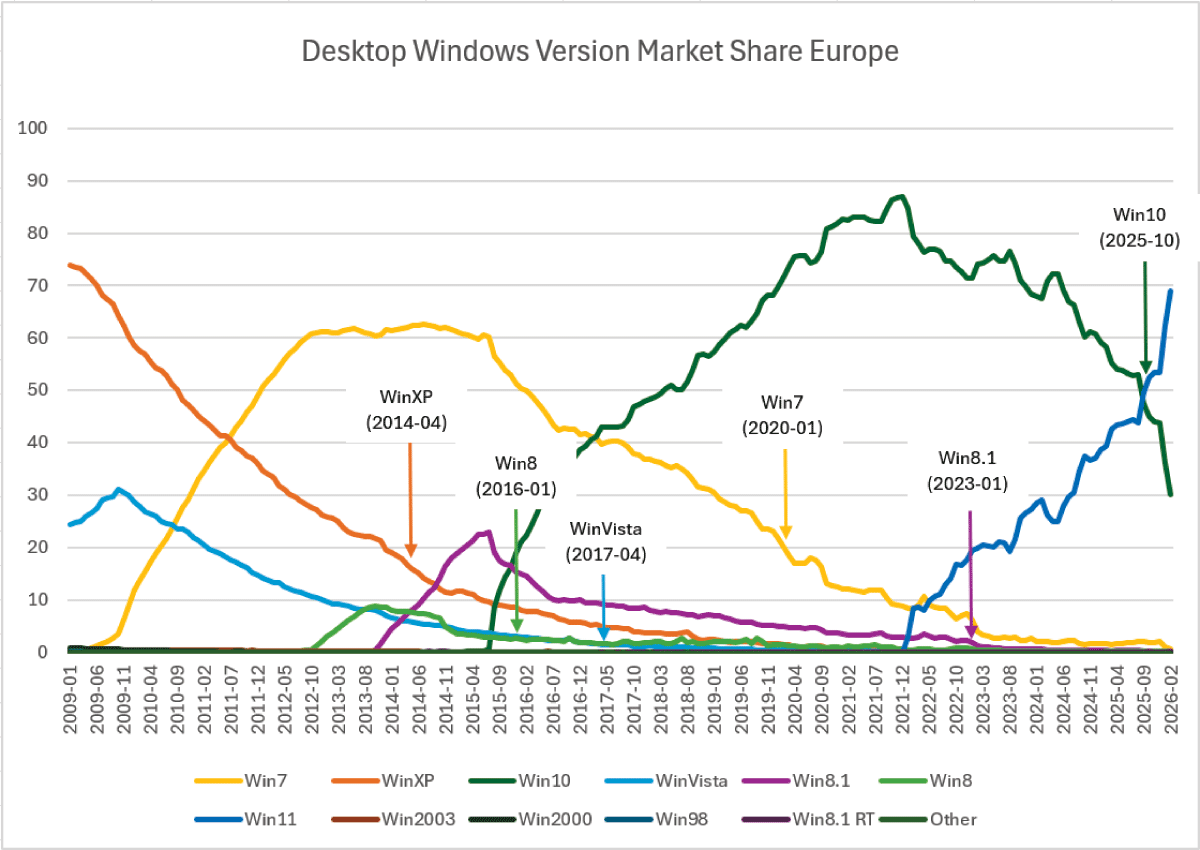
Figure 5
Desktop Windows version market share, Europe (StatCounter 2026), with end-of-support dates indicated by the authors.
For the lifetime model these insights indicate, that OS updates are relevant for product service life, but the data suggests, that this is more of a process stretching over a longer period of time, and not necessarily an abrupt phase out of products.
Lifetime model
The lifetime model is based on failure and repair statistics mainly relying on the data above and fitted to match these data sources. To this end a model has been set up for notebooks, integrated desktop computers, and desktop computers. These models comprise annual failure rates for identified priority parts and a total defect rate per year, a repair rate representing the likeliness that a defect is repaired instead of replacing the product with a new one, relevancy of other obsolescence reasons than hardware defects, and a resulting ‘survival rate’ of devices in any given year. These factors allow to calculate the average product lifetime as follows:
Lifetime is measured in discrete years t = 1, 2, …, T.
The average service lifetime L is:
where S(t) is the probability that a laptop is still functional at the end of year t.
For each year t, the survival probability is:
where ω(t) is the total obsolescence rate in year k, representing the share of products facing end of service life for any reason. The total obsolescence rate per year combines in the mathematical model:
component failure rates in a given year (e.g., “Battery … 0.05”, “Display … 0.015”), with components representing priority parts identified for the product segment to be modelled
the probability that a failure is successfully repaired (e.g., “repair rate … 0.5, 0.3 …”)
other obsolescence reasons (e.g., “other obsolescence reasons … 0.1, 0.3 …”)
Besides software related issues ‘other obsolescence reasons’ are meant to cover the numerous user behaviour related reasons for taking a product out of service, which have been extensively researched in recent years (Jaeger-Erben and Hipp, 2018; Frick, Jaeger-Erben and Hipp, 2021; Dalhammar, Milios, and Richter, 2021).
Thus, total obsolescence rate ω (t) in year t is calculated as follows:
whereas
t: year index, t = 1,…,T
T: maximum observation horizon (here: 10 years)
i: component index (e.g., in case of notebooks: battery, display, keyboard/trackpad, ports, fans)
λi (t): failure rate of component i in year t (e.g., “Battery … 0.06”)
r (t): repair rate in year t (e.g., “repair rate … 0.5”)
o (t): probability other obsolescence reasons in year t
The combined formula for the average service lifetime L, including the survival function and obsolescence rate calculation reads as follows:
This expression directly computes the expected lifetime from the yearly failure, repair, and obsolescence values.
The annual defect-rate input is calculated by summing the component rates shown in Tables 6, 7, 8. This approach introduces some simplification, as a single incident may impact multiple parts, especially following events such as drops or liquid ingress. Since the available source data do not consistently distinguish joint failures, the additive approximation remains in use; accordingly, this uncertainty should be taken into account when interpreting lifetime gains modelled in the analysis. It is important to highlight that the model is calibrated primarily with respect to the overall defect rate per year. Consequently, occurrences of simultaneous defects tend to result in an underestimation of the individual component failure rates reported in the tables.
Table 6
Lifetime model for notebook computers.
| NOTEBOOKS | YEAR 1 | YEAR 2 | YEAR 3 | YEAR 4 | YEAR 5 | YEAR 6 | YEAR 7 | YEAR 8 | YEAR 9 | YEAR 10 | TOTAL | |
|---|---|---|---|---|---|---|---|---|---|---|---|---|
| failure rates (products in use) | Battery | 0.0% | 0.5% | 5.0% | 6.0% | 6.5% | 6.5% | 7.0% | 7.0% | 7.0% | 7.0% | |
| Display | 1.2% | 1.2% | 1.5% | 1.7% | 1.8% | 1.8% | 1.8% | 2.0% | 2.0% | 2.0% | ||
| Keyboard/trackpad | 0.8% | 0.8% | 1.0% | 1.0% | 1.0% | 1.0% | 1.2% | 1.2% | 1.2% | 1.2% | ||
| Ports | 0.2% | 0.2% | 0.2% | 0.3% | 0.3% | 0.3% | 0.3% | 0.4% | 0.4% | 0.4% | ||
| Fans | 0.1% | 0.1% | 0.2% | 0.3% | 0.3% | 0.3% | 0.3% | 0.4% | 0.4% | 0.4% | ||
| Power supply | n/a | n/a | n/a | n/a | n/a | n/a | n/a | n/a | n/a | n/a | ||
| defect rate/year | 2.30% | 2.80% | 7.90% | 9.30% | 9.90% | 9.90% | 10.60% | 11.00% | 11.00% | 11.00% | 6.1% | |
| repair rate | 95% | 85% | 50% | 30% | 5% | 3% | 2% | 1% | 0% | 0% | 39.5% | |
| other obsolescence reasons | 0% | 0% | 0% | 10% | 30% | 60% | 73% | 80% | 87% | 90% | ||
| survival rate | 99.89% | 99.47% | 95.54% | 80.39% | 50.98% | 18.43% | 4.46% | 0.79% | 0.09% | 0.01% | ||
| average lifetime (years) | 5.00 | |||||||||||
Table 7
Lifetime model integrated desktop computers.
| INTEGRATED DESKTOP COMPUTERS | YEAR 1 | YEAR 2 | YEAR 3 | YEAR 4 | YEAR 5 | YEAR 6 | YEAR 7 | YEAR 8 | YEAR 9 | YEAR 10 | TOTAL | |
|---|---|---|---|---|---|---|---|---|---|---|---|---|
| failure rates (products in use) | Battery | n/a | n/a | n/a | n/a | n/a | n/a | n/a | n/a | n/a | n/a | |
| Display | 1.0% | 1.0% | 1.2% | 1.2% | 1.2% | 1.2% | 1.2% | 1.2% | 1.2% | 1.2% | ||
| Keyboard/trackpad | n/a | n/a | n/a | n/a | n/a | n/a | n/a | n/a | n/a | n/a | ||
| Ports | 0.2% | 0.4% | 0.5% | 0.7% | 0.7% | 0.7% | 0.7% | 0.7% | 0.7% | 0.7% | ||
| Fans | 0.0% | 1.0% | 1.5% | 1.8% | 2.0% | 2.0% | 2.0% | 2.0% | 2.0% | 2.0% | ||
| Power supply | 0.5% | 1.5% | 3.0% | 3.5% | 3.5% | 4.0% | 4.0% | 5.0% | 5.0% | 5.0% | ||
| defect rate/year | 1.70% | 3.90% | 6.20% | 7.20% | 7.40% | 7.90% | 7.90% | 8.90% | 8.90% | 8.90% | 5.6% | |
| repair rate | 90% | 85% | 75% | 50% | 10% | 5% | 3% | 2% | 1% | 0% | 43.8% | |
| other obsolescence reasons | 0% | 0% | 0% | 4% | 10% | 25% | 45% | 70% | 90% | 95% | ||
| survival rate | 99.83% | 99.25% | 97.66% | 90.38% | 75.92% | 52.67% | 26.75% | 7.32% | 0.67% | 0.03% | ||
| average lifetime (years) | 6.00 | |||||||||||
Table 8
Lifetime model desktop computers.
| DESKTOP COMPUTERS | YEAR 1 | YEAR 2 | YEAR 3 | YEAR 4 | YEAR 5 | YEAR 6 | YEAR 7 | YEAR 8 | YEAR 9 | YEAR 10 | TOTAL | |
|---|---|---|---|---|---|---|---|---|---|---|---|---|
| failure rates (products in use) | Battery | n/a | n/a | n/a | n/a | n/a | n/a | n/a | n/a | n/a | n/a | |
| Display | n/a | n/a | n/a | n/a | n/a | n/a | n/a | n/a | n/a | n/a | ||
| Keyboard/trackpad | n/a | n/a | n/a | n/a | n/a | n/a | n/a | n/a | n/a | n/a | ||
| Ports | 0.3% | 0.5% | 0.7% | 0.9% | 1.0% | 1.0% | 1.0% | 1.0% | 1.0% | 1.0% | ||
| Fans | 0.0% | 1.0% | 2.0% | 2.5% | 3.0% | 3.5% | 3.5% | 3.5% | 4.0% | 4.0% | ||
| Power supply | 0.5% | 1.5% | 3.0% | 3.5% | 3.5% | 4.0% | 4.0% | 5.0% | 5.0% | 5.0% | ||
| defect rate/year | 0.80% | 3.00% | 5.70% | 6.90% | 7.50% | 8.50% | 8.50% | 9.50% | 10.00% | 10.00% | 5.2% | |
| repair rate | 95% | 95% | 80% | 50% | 10% | 5% | 3% | 2% | 1% | 0% | 42.2% | |
| other obsolescence reasons | 0% | 0% | 0% | 5% | 10% | 25% | 45% | 75% | 90% | 95% | ||
| survival rate | 99.96% | 99.81% | 98.62% | 90.46% | 75.92% | 52.34% | 26.41% | 5.99% | 0.54% | 0.02% | ||
| average lifetime (years) | 6.00 | |||||||||||
In the context of the review of Ecodesign Directive (EU) 617/2023 and the potential implementation of an EU Energy Label this approach is applied to 7 product segments to cover the full scope of the proposed regulations. Of these 7 market segments models and results below are shown for
Notebooks
Integrated desktop computers
Desktop computers
For notebooks the resulting lifetime model is shown in Table 6.
The repair rate, set at 39.5% in average, following the data presented above, is assumed to follow an S-curve: In the beginning most of the repairable defects will be fixed, the older the device gets the lower the repair rate is, as the remaining value of the device decreases, but not the repair costs. It is therefore also an economic decision by the user, if a defect device will be repaired or discarded.
The correlation of these factors and rates for notebooks is shown in Figure 6.
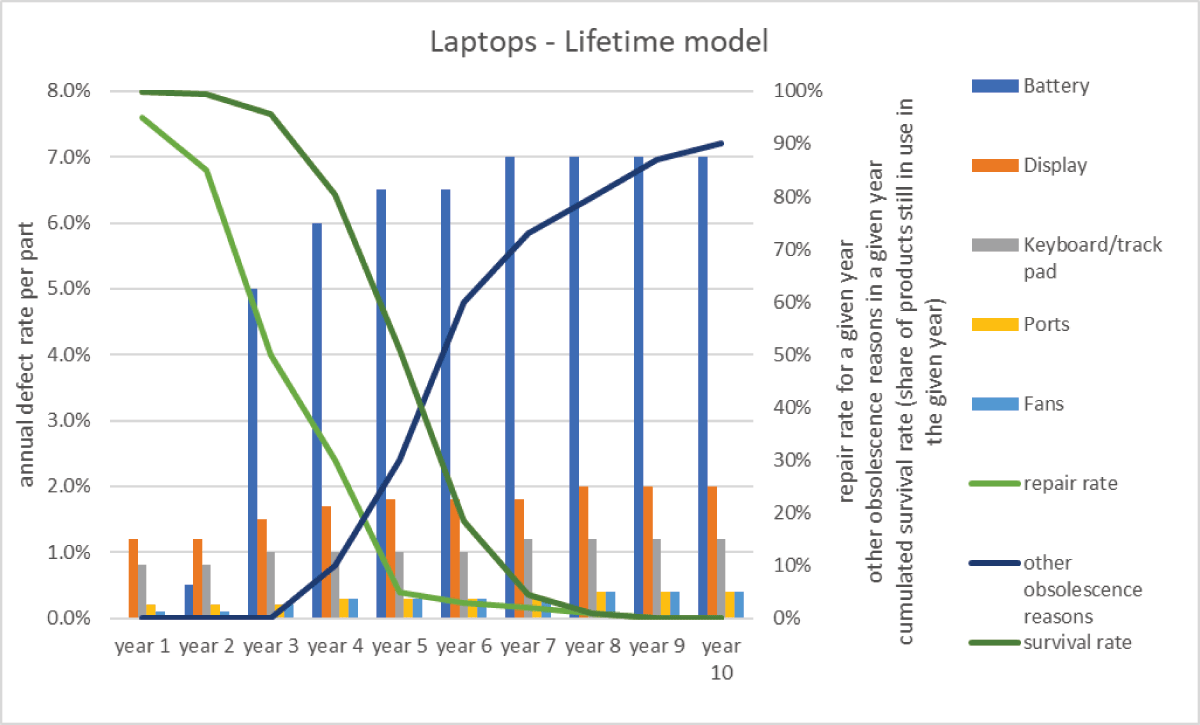
Figure 6
Lifetime model for notebook computers.
The lifetime model for integrated desktop computers is shown in Table 7.
Compared to notebook computers the number of potentially defective parts is lower. The average defect rate is spread across these remaining parts, which have been identified as more relevant than others in the context of the field data.
The correlation of these factors and rates for integrated desktop computers is shown in Figure 7.
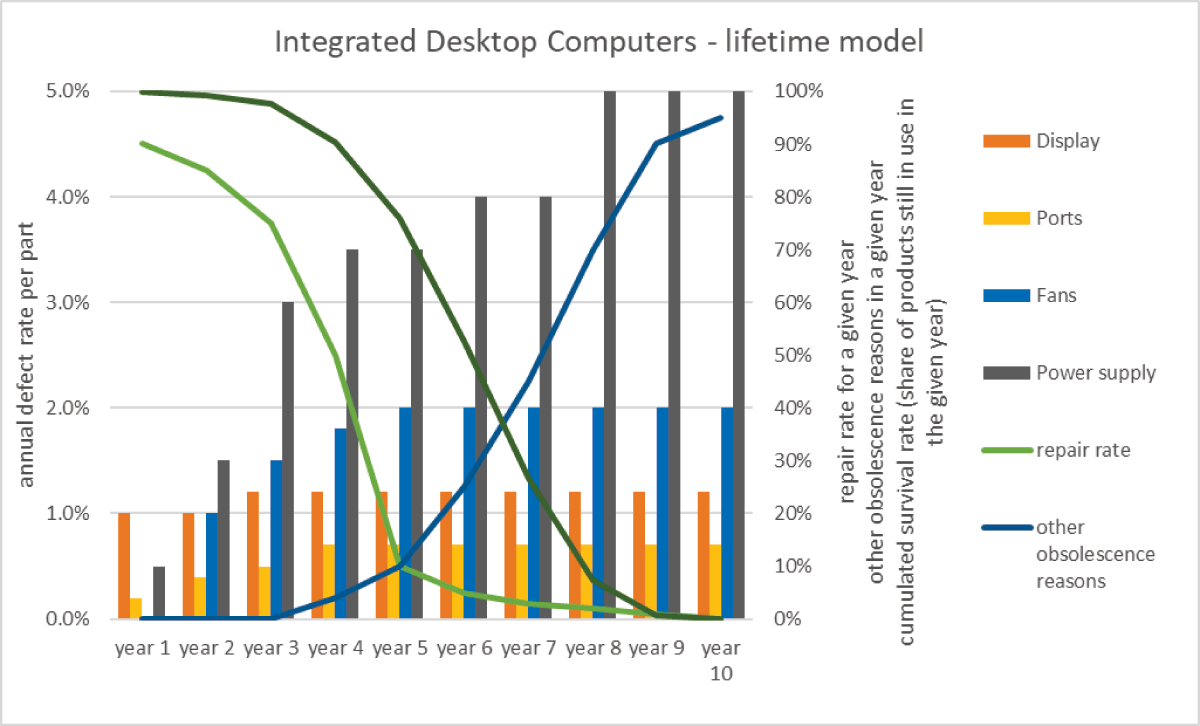
Figure 7
Lifetime model for integrated desktop computers.
The lifetime model for desktop computers other than integrated ones is shown in Table 8.
The correlation of these factors and rates for desktop computers is shown in Figure 8.
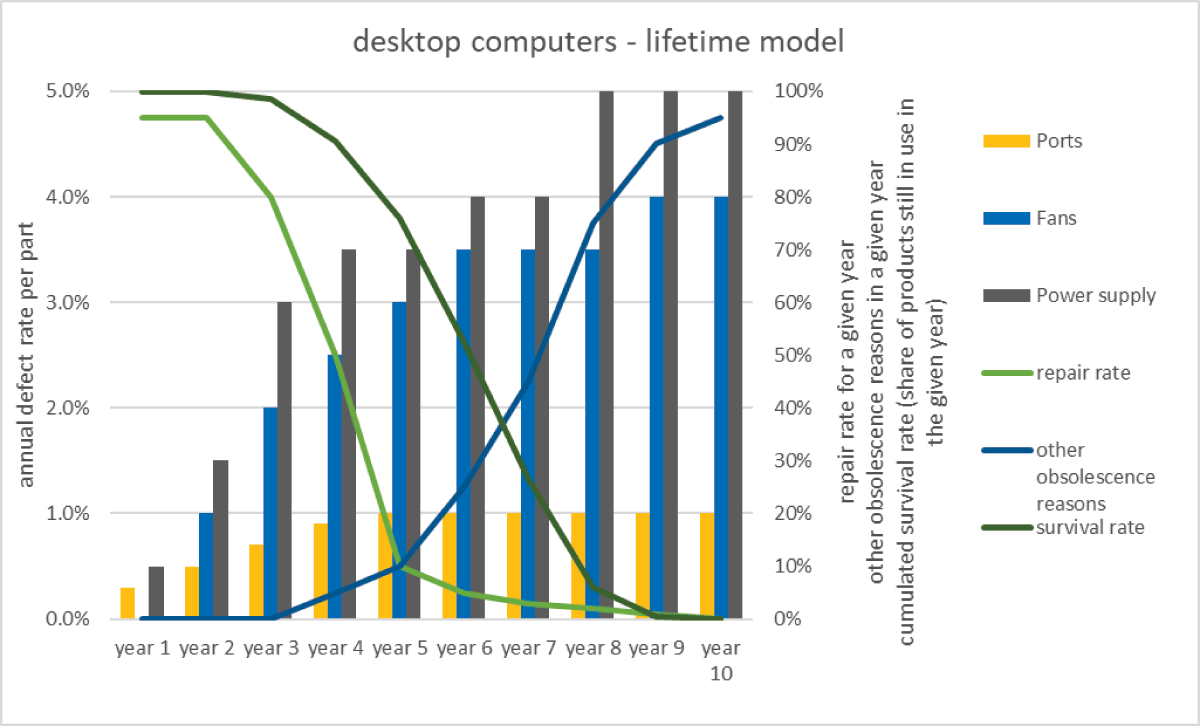
Figure 8
Lifetime model for desktop computers.
Based on this foundation, it is now possible to assess how targeted policy measures influence the expected product lifetime and, consequently, the environmental performance of the devices.
Modelling policy measures
In the course of the review of Ecodesign Directive (EU) 617/2013 and the potential implementation of an EU Energy Label a range of potential individual measures have been identified, which are likely to have a positive environmental impact. In this context it is important to understand, that legislation hardly can regulate the lifetime as such, due to the complexity and statistical variance of lifetime determining parameters. What can be regulated are singulated aspects, which are directly related to potentially lifetime terminating events, such as accidental drops, and indirectly by lowering barriers for repair. Measures related to extending product lifetime are the following:
Minimum requirements under an ecodesign regulation on
(1) repairability
(2) on resistance to accidental drops
(3) water ingress protection
(4) battery endurance
(5) battery management
(6) key abrasion resistance
(7) operating system updates
Energy Labelling, including
(8) repairability scoring
(9) drop resistance classes
(10) battery endurance indication
(11) liquid ingress classes
Further measures apply to energy related aspects (Sánchez et al., 2026), which are assumed not to have a relevant impact on product lifetime, with the exception of battery lifetime related aspects.
Details of the draft policy measures for computers have been presented by European Commission staff (2024a, 2024b) in the context of the Ecodesign and Energy Labelling Consultation Forum and will not be reproduced here. Most of the measures do apply to part of the regulations’ scope only. Some test standards need to be adapted or newly developed: Battery endurance can build on established cycle-testing (CENELEC 2017), repairability on a matrix adapted by JRC to laptop computers specifically (European Commission Staff 2024b) and based on EN 45554 (CEN/CENELEC, 2020), drop tests on established procedures for free falls with determined orientation (IEC 2008). The liquid-ingress tests must be adapted to typical incidents, which is spilling of liquids on the keyboard – a test setting which not yet standardised and needs to be specified as a transitional method. While all tests aim to simulate actual usage conditions, they ultimately measure performance under defined laboratory environments. The extent to which these results translate to a decrease in field failures remains somewhat uncertain.
Lifetime extending effect
The lifetime extending effects are modelled by adjusting the base parameters of the lifetime model. Only the parameter directly targeted by the measure is changed; all other annual component-failure, repair and non-technical-obsolescence parameters remain at the baseline values in Tables 6, 7, 8. Repairability measures increase the year-specific probability of successful repair. Durability measures reduce or postpone the corresponding component-specific failure rates. Operating-system support reduces the non-technical obsolescence term. The survival function is then recalculated, and the difference between the revised and baseline expected lifetime is reported in Table 9. To give examples: The measure to require a minimum battery endurance, in this case 800 charging cycles as a minimum requirement, is assumed to push out battery replacement needs by approximately 0.5 years compared to the current situation. All other obsolescence reasons remain unchanged, but partially materialise instead of the battery lifetime limitation. Similarly, in the lifetime model increased drop resistance will reduce only those defects, which are related to such drops. It should be noted that design measures, such as enhanced drop resistance might come with other benefits, such as reduced wear and tear, which matters in particular for refurbishment and reuse. Such side effects are not considered in the presented calculations, but could be addressed by reducing the effect of other–in this case aesthetic–obsolescence reasons. The data from the IT insurance company (Anonymous Insurance Company 2025) provided insights in drop related defects. It is however speculative how exactly random drop failures will be reduced by a drop resistance established as per standardised drop test. The lifetime model allows to show in such cases at least the corridor of potential lifetime extension. Based on such considerations, reflecting on the effects of individual measures, the lifetime can be remodelled. Resulting values per measure are given in Table 9.
Table 9
Modelled lifetime extension per proposed policy measure.
| NOTEBOOK | INTEGRATED DESKTOP COMPUTER | (OTHER) DESKTOP COMPUTERS | UNDERLYING MODELLING ASSUMPTIONS, WHERE APPLICABLE | |
|---|---|---|---|---|
| Ecodesign measures | ||||
| Reparability | +0.1 years | +0.11 years | +0.13 years | Repair rate of 50% pushed out by 1 year |
| Resistance to accidental drops | +0.04 years | n/a | n/a | Drop related defect rate (25% of all defects) reduced by 50% |
| Water ingress protection | +0.01 years | n/a | n/a | Water ingress related defect rate (5% of all defects) reduced by 50% |
| Battery endurance | +0.05 years | n/a | n/a | Battery failure pushed out by approx. 0.5 years |
| Battery management | +0.03 years | n/a | n/a | Battery failure pushed out by approx. 0.25 years |
| Key abrasion resistance | +0.01 years | n/a | n/a | Keyboard/trackpad defects reduced by 20% from year 3 onwards |
| Operating System updates | +0.3 years | +0.31 years | +0.3 years | Other obsolescence reasons reduced by 50% in year 6–7 |
| Energy Labelling measures | ||||
| Repairability Index | +0.1 years | n/a | n/a | Repair rate of 50% pushed out by 1 year |
| Drop resistance classes | +0.04 years | n/a | n/a | Drop related defect rate (25% of all defects) reduced by 50% |
| Battery endurance indication | +0.05 years | n/a | n/a | Battery failure pushed out by approx. 0.5 years |
| Liquid ingress classes | +0.01 years | n/a | n/a | Water ingress related defect rate (5% of all defects) reduced by 50% |
Improved mechanical robustness may also reduce wear, loosening of connections or damage that is not reported explicitly as a drop event. However, the available insurance data quantify only claims attributed to drops. To avoid assigning unsupported benefits, the central scenario therefore reduces only drop-attributed failures; possible wider robustness benefits are treated as an unquantified upside rather than included in Table 9.
Effects of combining measures are not cumulative. The lifetime model takes into account that a combination of measures in many cases reduces the effect of individual measures. As an example, increased resistance to accidental drops reduces the effect of better repairability, as less devices will need to benefit from better repairability.
Accordingly, the rows in Table 9 represent separate scenarios and must not be summed. A combined package must be run through the model simultaneously because measures can address overlapping devices and failure pathways. For example, preventing a drop-related defect reduces the number of devices for which improved repairability could subsequently avoid replacement.
Lifetime extension of individual measures is, contrary to the general perception, rather low. Looking at the lifetime model, this is mainly due to the fact, that the end of service life is determined by several factors and any of the measures has an effect only on the share of devices. Unlike energy consumption limits, which impact most products in scope of a regulation, measures individually addressing specific lifetime-ending factors only affect the subset of products exposed to those incidents.
Decarbonization effects
The primary focus of this paper is the lifetime model. In the context of regulatory analysis product lifetime modelling serves merely as an intermediate step for quantifying the implications for lifecycle costs and environmental impacts. Following the MEErP methodology, a simplified lifecycle assessment is carried out using the EcoReport tool provided by the European Commission (Eynard et al. 2024) for this purpose, but with the adapted lifetime model. Further data for the lifecycle modelling of computer devices, such as bills of materials, manufacturing process energy, distribution, use phase energy consumption, and end of life scenario have been researched by the authors in the context of the ongoing impact assessment study.
An evaluation of the individual measures listed above results, depending on the product segment under consideration, in the changes in annual greenhouse gas emissions presented in Table 10. In this assessment, the emissions associated with manufacturing are ‘amortized’ over the extended service life. Additional efforts related to the production of spare parts or design modifications required to meet reliability targets are comparatively minor relative to the overall manufacturing burden.
Table 10
Modelled Greenhouse Gas Emissions per proposed policy measure.
| LIFE CYCLE GHG EMISSIONS PER UNIT PER YEAR OF USE (kg CO2e) | PRODUCT CATEGORY | ||
|---|---|---|---|
| POLICY OPTION/MEASURE | NOTEBOOK | INTEGRATED DESKTOP COMPUTER | DESKTOP COMPUTER |
| 1 Business as Usual (BAU) | 55.57 | 99.03 | 86.13 |
| 2 Self-Regulatory Initiative (SRI) | n/a | n/a | n/a |
| 3 Ecodesign | |||
| Reparability | 54.86 | 97.98 | 85.16 |
| Resistance to accidental drops | 55.20 | 99.03 | 86.13 |
| Water ingress protection | 55.48 | 99.03 | 86.13 |
| Battery endurance | 55.14 | 99.03 | 86.13 |
| Battery management | 55.31 | 99.03 | 86.13 |
| Key abrasion resistance | 55.48 | 99.03 | 86.13 |
| Operating System updates | 53.21 | 95.79 | 83.93 |
| 4 Energy Label | |||
| Repairability Index | 54.86 | 99.03 | 86.13 |
| Drop resistance classes | 55.20 | 99.03 | 86.13 |
| Battery endurance indication | 55.14 | 99.03 | 86.13 |
| Liquid ingress classes | 55.48 | 99.03 | 86.13 |
For Table 10, each lifetime from Table 9 is entered separately into the adapted EcoReport life-cycle model while the bill of materials, manufacturing, distribution, use-phase energy and end-of-life assumptions remain unchanged, spare parts production is added, where relevant. Annualized greenhouse gas emissions equal the scenario life-cycle emissions allocated over the corresponding expected service life. Thus, Table 10 reports the annualized result of one measure at a time relative to the business-as-usual lifetime. On the example of notebooks, the step-by-step calculation is as follows:
In the business-as-usual (BAU) scenario, the EcoReport tool estimates total life-cycle greenhouse gas emissions of 277.84 kg CO2 eq. for a notebook with an average service life of five years. Of this total, 205.85 kg CO2 eq. are attributable to raw materials and manufacturing. Annualised over the five-year service life, the life-cycle emissions amount to 55.57 kg CO2 eq. per year of use. Under the Ecodesign measure on repairability, the average notebook lifetime increases from 5.0 to 5.1 years. The EcoReport calculation is adjusted accordingly, including the manufacturing impacts of spare parts required for the additional repairs predicted by the model. This yields total life-cycle emissions of 279.80 kg CO2 eq. Dividing this value by the extended lifetime of 5.1 years results in annualised emissions of 54.86 kg CO2 eq. per year of use. The use of two decimal places should not be interpreted as indicating equivalent precision in the underlying life-cycle greenhouse gas estimates; in product carbon footprint calculations, uncertainty ranges of ±20% are common. Nevertheless, because all scenarios are assessed using the same background data and calculation framework, the relative differences between measures provide a robust indication of the overall trend.
The individual rows in Table 10 are alternative scenarios and cannot be added. The table does not quantify a full policy package or interactions among measures, which is done in the context of the related Impact Assessment Study, but is beyond the scope of this paper.
The results indicate that each individual measure yields a significant, albeit moderate, reduction in greenhouse gas emissions. For notebooks, repairability requirements potentially implemented as part of an Ecodesign regulation reduce greenhouse gas emissions by an average of 0.71 kg CO2e per year compared to a business-as-usual scenario, while improved protection against drop damage results in a reduction of 0.37 kg CO2e per year. These seemingly modest effects reflect the fact that only a fraction of devices would actually benefit from such measures.
The environmental benefit of repair is conditional on the component replaced, the impacts of the spare part and repair logistics, repair success and the additional service life achieved. Replacing a small component and obtaining several additional years of use is more likely to yield a net benefit than replacing an impact-intensive assembly for only a short extension. The current screening model assumes that the impacts of spare parts and design modifications remain minor compared with the impacts avoided through computer manufacturing. However, repairability should not be regarded as inherently beneficial. Maximising repairability typically requires additional modular components and materials, whose environmental impacts may not be offset by the resulting benefits (Schischke et al., 2022b).
The realised effect also depends on the wider policy mix. Spare-part and repair-information obligations increase technical access to repair, while repair incentives, lower repair costs, consumer information, public procurement, reuse and refurbishment systems can increase the probability that this technical potential is used. The model captures this behaviour through the repair-rate parameter, but it does not estimate the additional effects of these complementary instruments.
It should also be noted that measures to address product lifetime often face environmental trade-offs when it comes to hardware implementations, as shown by Ebert et al. (2024) for various design aspects.
Conclusions and outlook
EU product policy is entering a phase in which circularity and lifetime extension are primary levers for reducing environmental impacts. This shift will deepen under the Ecodesign for Sustainable Products Regulation (ESPR). The smartphone/tablet framework has proven that circularitydriven rules can be operationalized in a coherent regulatory package. It now serves as a blueprint for extending similar approaches to computers.
The lifetime modelling documented in this paper provides a more granular and evidencebased foundation for such policy design. Unlike earlier semiquantitative approaches, the model integrates:
Componentspecific annual failure rates, derived from refurbisher, retailer, insurance, and repairplatform data.
Repair probabilities, reflecting realworld behaviour rather than idealised assumptions.
Nontechnical obsolescence factors, including software support limitations and performancedriven replacement.
A survivalfunctionbased structure, allowing the calculation of realistic lifetime distributions rather than single average values.
This approach offers several benefits: It captures the diversity of failure mechanisms across product types, avoids overestimating the effect of repairability alone, and provides a transparent way to test how individual measures influence overall lifetime.
The modelling results combined with recent field data reveal a crucial insight for policymakers: The impact of any single measure is modest. Only a small share of devices will experience the specific failure mode that a given requirement addresses. A more robust port, a longerlasting battery, or improved drop resistance each affects only a fraction of the stock.
However, a package of durability, repairability and software-support measures may produce a larger effect than any single measure. This paper does not quantify that package, and the individual results in Tables 9 and 10 cannot be added because the measures overlap. Quantifying the combined outcome can be done with the presented lifetime model when all affected failure, repair and non-technical-obsolescence parameters are changed simultaneously, but goes beyond the scope of this paper.
It should also be noted that a broader and increasingly coherent policy framework has emerged in the European Union in recent years. Many of these legislative initiatives pursue complementary environmental objectives and are therefore expected to generate synergies with Ecodesign and Energy Labelling requirements. Examples include the Radio Equipment Directive (EU) 2022/2380, which introduces harmonised charging solutions and a common charging interface for a range of portable electronic devices (European Commission 2023c); the Right to Repair Directive (EU) 2024/1799, which aims to reduce barriers to repair by strengthening consumers’ access to repair services and information (European Parliament and Council 2024a); the Empowering Consumers for the Green Transition Directive (EU) 2024/825 (EmpCo Directive), which restricts misleading environmental claims and labels and thereby increases the relevance of credible and regulated information tools such as the EU Energy Label (European Parliament and Council 2024b; Schischke et al. 2023); and the Waste Electrical and Electronic Equipment (WEEE) Directive 2012/19/EU, whose objectives can be supported by more modular and repairable product designs that facilitate disassembly and material recovery at end of life (European Parliament and Council 2012). Together, these measures create a regulatory environment in which the benefits of durability, reparability and resource-efficiency requirements are reinforced by complementary policy instruments. The examples provided above are not exhaustive, as several additional legislative initiatives contribute to the same objectives, but a comprehensive review of all relevant measures would be beyond the scope of this paper.
It is foreseeable, that lifetime extending policy measures will remain a top policy focus, given that the carbon intensity of the electricity grid in Europe is going down. From a scientific perspective this also calls for a shift towards measures addressing product lifetime (Richter, Tähkämö, and Dalhammar, 2019).
Data Accessibility Statement
Publicly available sources used in this study are identified in the reference list. The refurbisher and insurance datasets were provided to the authors for the policy study and cannot be published at record level because of confidentiality restrictions. The manuscript reports aggregated values needed to understand the parameterization. The spreadsheet implementation of the lifetime model and non-confidential aggregated input tables may be made available by the corresponding author upon reasonable request.
Author Contributions
K.S.: Research on lifetime model and lead author.
J.R.: Research on lifetime data and policy context.
D.S.: Research on repair statistics and development of priority parts matrix.
S.-J.B.: Research on life cycle implications of circular design options.