
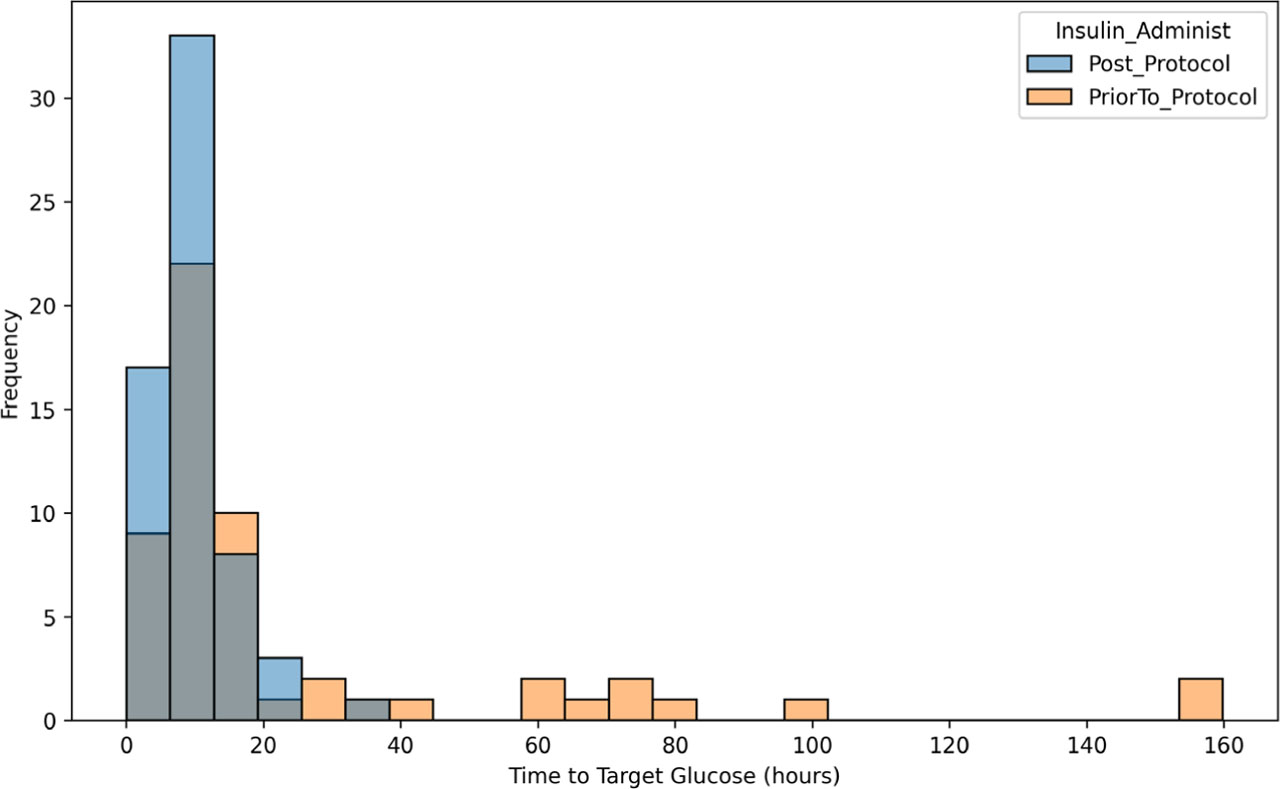
Fig. 1.
Time to Target Glucose in the pre- and post-implementation of Intravenous Insulin Protocol.
Table 1.
Comparison of Mean and Standard Deviation of the Outcomes Pre (Non-IIP group) and Post-Implementation of IIP (IIP group)
| Insulin Protocol | Time to Target Glucose (SD) | Hyperglycemia rate within 7 days of Admission | Hypoglycemia rate within 7 days of Admission | Hospital LOS | ICU LOS |
|---|---|---|---|---|---|
| Post-Implementation (IIP) | 10.06 (5.69) | 56.1% (0.30) | 0.4% (0.1) | 17.09 (18.67) | 11.97(18.48) |
| Pre-Implementation (Non-IIP) | 24.96 (34.59) | 45.3% (0.28) | 0.8% (0.8) | 19.81 (21.55) | 13.84(18.37) |
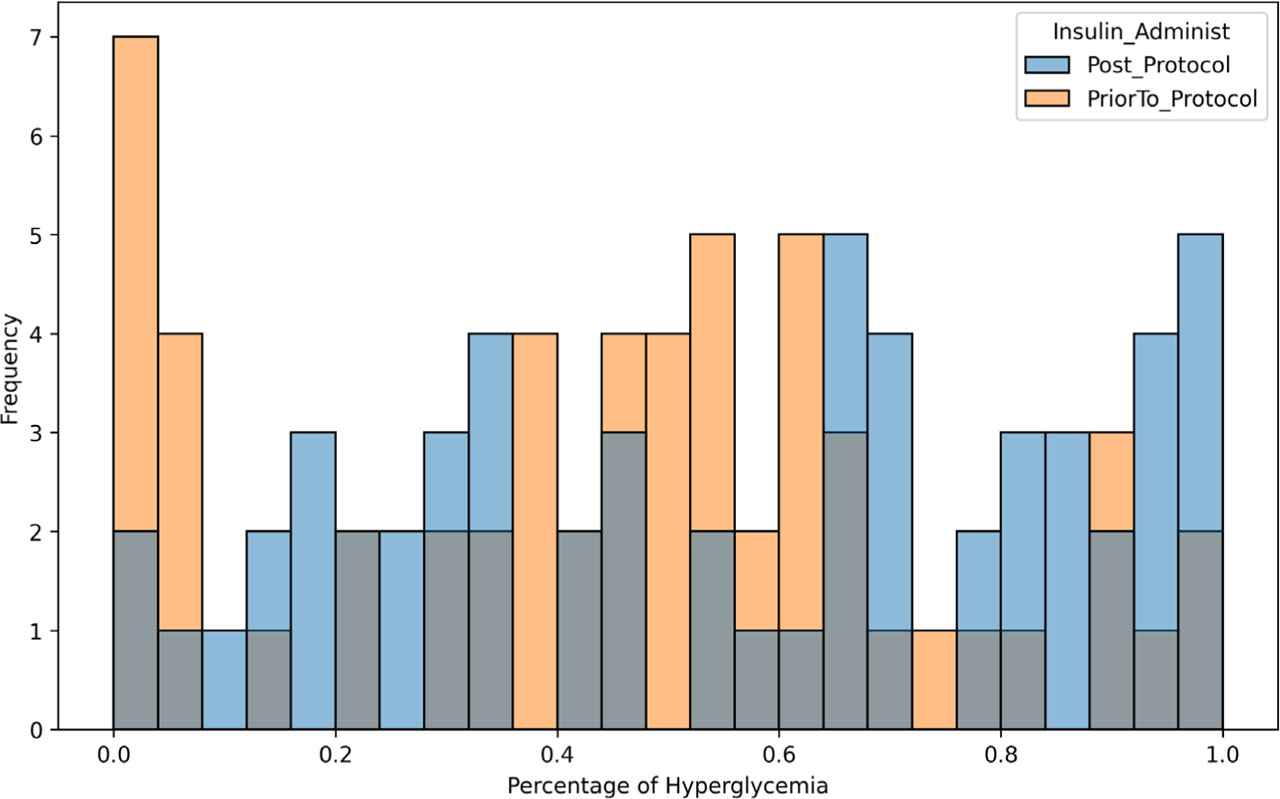
Fig. 2.
Percentage of Hyperglycemia in the pre-and post-implementation of Intravenous Insulin Protocol.
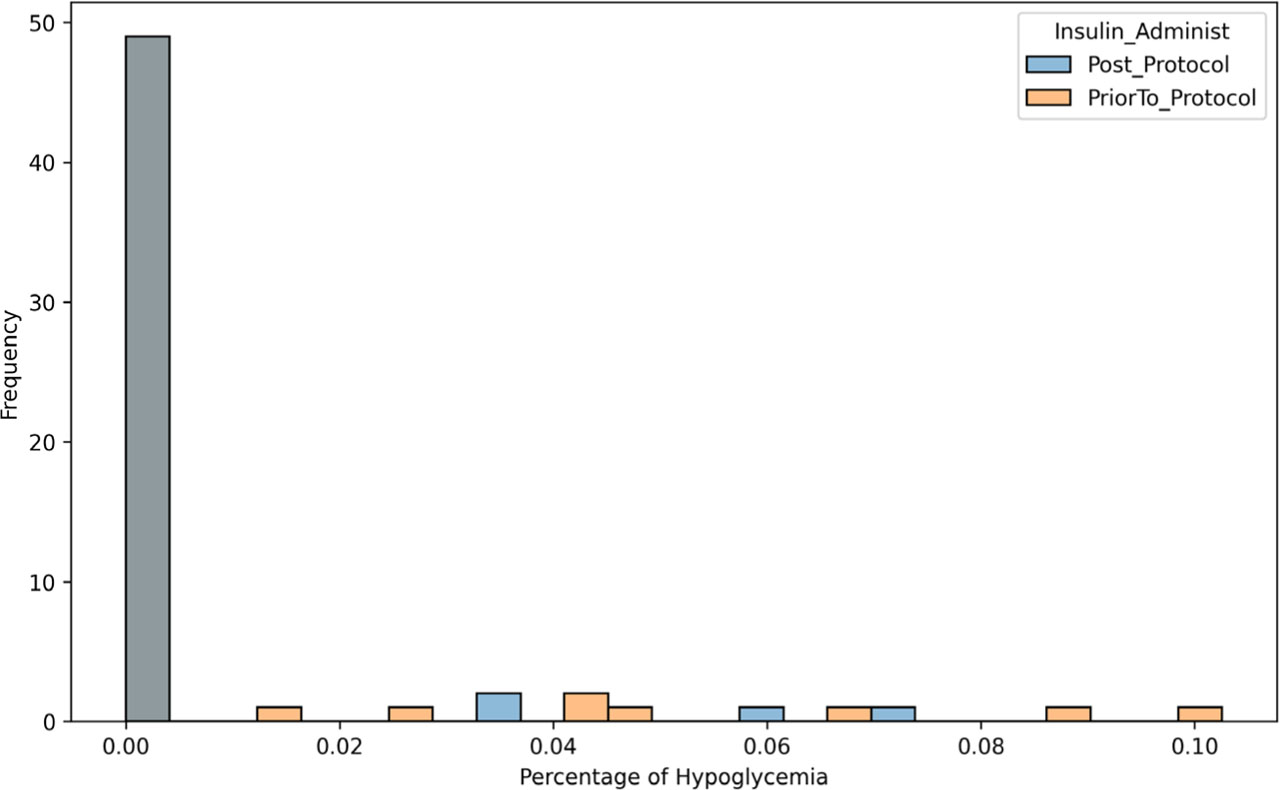
Fig. 3.
Percentage of Hypoglycemia in the pre- and post-implementation of Intravenous Insulin Protocol.
Table 2.
Comparison of Mean and Standard Deviation Percentages of Hyperglycemia and Hypoglycemia During Intravenous and Subcutaneous Insulin Administrations Before and After Protocol Implementation
| Insulin Route of Administrations | Hyperglycemic events (SD) | Hypoglycemic events (SD) |
|---|---|---|
| IV Insulin (Post-Implementation) | 9.8 % (0.14) | 0.2% (0.02) |
| SubQ Insulin (Post-Implementation) | 56.1 % (0.3) | 0.4% (0.01) |
| SubQ Insulin (Pre-Implementation | 45.3% (0.28) | 0.8% (0.02) |