
Table 1
Titles, authors, and word counts for stories.
| TITLE | AUTHOR | WORD COUNT |
|---|---|---|
| An Occurrence at Owl Creek Bridge | Ambrose Bierce | 3763 |
| All Summer in a Day | Ray Bradbury | 1939 |
| The Pedestrian | Ray Bradbury | 1444 |
| The Eyes Have It | Philip K. Dick | 1100 |
| Harrison Bergeron | Kurt Vonnegut | 2184 |
| 2BR02B | Kurt Vonnegut | 2527 |
Table 2
Spoiler examples (for “An Occurrence at Owl Creek Bridge”).
| Thematic spoiler A hanged man is brought to the edges of his psyche, dwelling in the interim between death and life. Ultimately a symbol of the power of surrender, the hanged man sacrifices his reality as he moves forward in time to face the inevitable. The hanged man is not only judged by his actions, but judged by his own psyche as he faces a choice between acceptance and resistance to meet his end. |
| Full spoiler A man and his executioners stand on a bridge in Alabama during the Civil War. As the man awaits his hanging, he fantasizes about escaping. At the moment of his hanging, he frees himself, swims to safety, and reaches his home. But as he is about to embrace his wife, he feels a blow against his neck. He has died, his neck broken, hanging from the bridge; he never escaped. |
Table 3
Linear mixed models fit in the analyses of each outcome.
| Step 1: modeling outcomes with experimental factors and their interactions |
| DV ~ spoiler type × delay + (1 | story) + (1 | participant) |
| Step 2: adding in an individual-difference variable and its interactions with the experimental factors |
| DV ~ spoiler type × delay × individual difference + (1 | story) + (1 | participant) |
[i] Note: In these models, spoiler type, delay, and individual differences were treated as fixed-effect predictors, whereas stories and participants were treated as random-effects predictors (i.e., intercepts). DV represents each outcome measure.
Table 4
Individual-difference descriptive statistics and correlations.
| VARIABLE (POSSIBLE RANGE) | M (SD) | α | max | min | 1 | 2 |
|---|---|---|---|---|---|---|
| 1. Need for cognition (–4 to +4) | 0.57 (1.04) | .89 | 3.28 | –2.67 | ||
| 2. Author recognition test (–20 to + 20) | 3.61 (2.19) | .73 | 15 | –4 | .19*** | |
| 3. Need for (cognitive) closure (1 to 6) | 3.55 (0.51) | .78 | 4.8 | 1 | –.14* | –.003 |
[i] Note. For need for cognition and the ART, n = 326. For the need for closure, n = 234. *p < .05, ***p < .001.
Table 5
Estimated per-word reading times in msec (and 95% CIs) as a function of spoiler-type and delay.
| DELAY | SPOILER TYPE | |||
|---|---|---|---|---|
| CONTROL | FULL | THEMATIC | ||
| long | 230 (218, 242) | 233 (221, 245) | 231 (219, 243) | 231 (221, 242) |
| short | 234 (222, 246) | 232 (220, 244) | 233 (221, 245) | 233 (223, 244) |
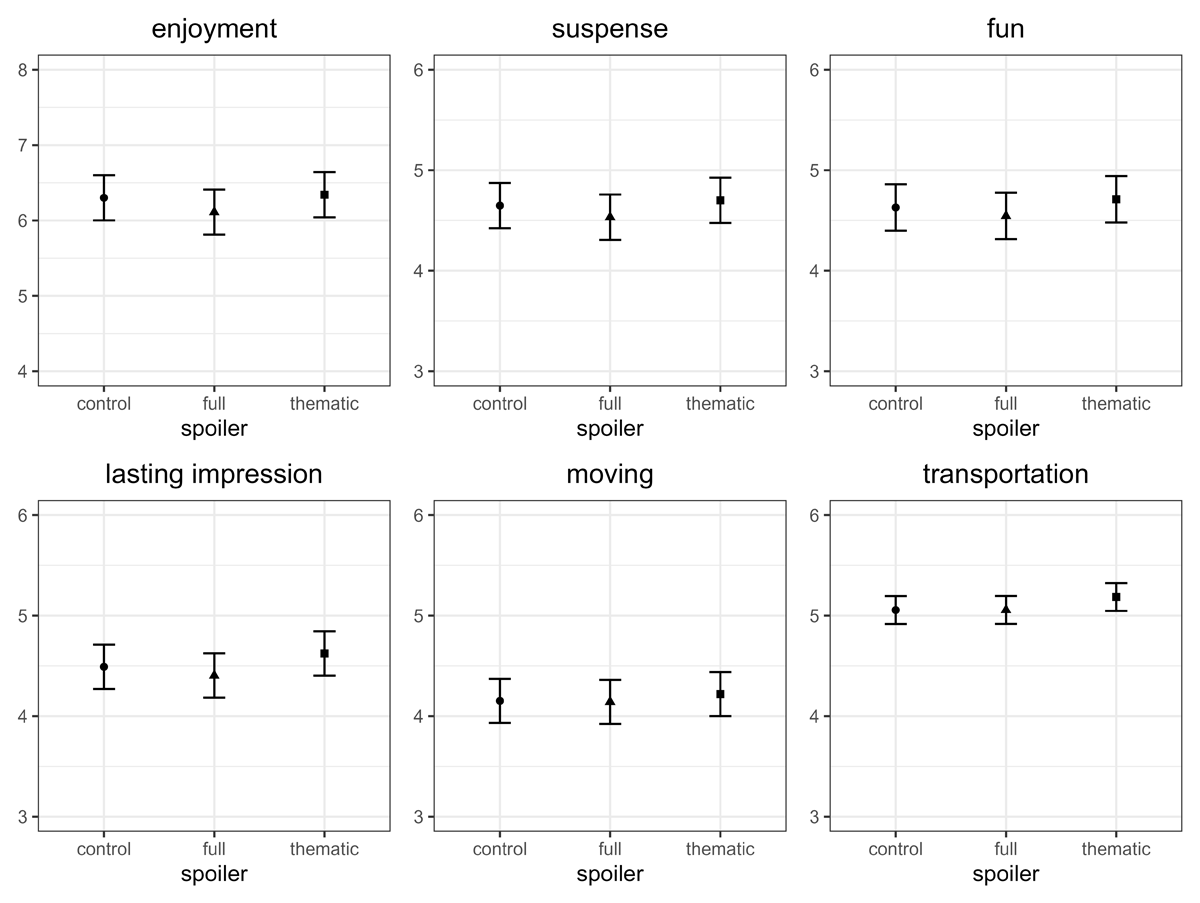
Figure 1
Model-estimated means for all outcomes as a function of spoiler condition. Error bars represent 95% repeated-measures confidence intervals (Jarmasz & Hollands, 2009). The vertical scale of the outcome measures has been expanded to allow closer inspection of the pattern of results.
Table 6
Moderation analyses: Slopes (and 95% CIs) for individual differences variables predicting outcomes, overall and by spoiler condition.
| MODERATOR | OUTCOME | ||
|---|---|---|---|
| ENJOYMENT | SUSPENSE | FUN | |
| need for cognition | 0.39 (0.22, 0.56) | 0.19 (0.08, 0.31) | 0.33 (0.22, 0.44) |
| control slope | 0.38 (0.13, 0.62) | 0.17 (–0.01, 0.34) | 0.29 (0.12, 0.47) |
| full-spoiler slope | 0.57 (0.33, 0.80) | 0.14 (–0.03, 0.31) | 0.45 (0.28, 0.62) |
| theme-spoiler slope | 0.23 (–0.02, 0.47) | 0.27 (0.09, 0.45) | 0.24 (0.06, 0.42) |
| interaction F | F = 2.52 | F < 1 | F = 1.82 |
| print exposure (ART) | 0.09 (0.01, 0.17) | –0.01 (–0.06, 0.05) | 0.08 (0.03, 0.14) |
| control slope | 0.10 (–0.01, 0.21) | 0.04 (–0.04, 0.12) | 0.08 (0.00, 0.17) |
| full-spoiler slope | 0.10 (–0.01, 0.22) | –0.04 (–0.13, 0.04) | 0.07 (–0.02, 0.15) |
| theme-spoiler slope | 0.07 (–0.05, 0.19) | –0.03 (–0.11, 0.06) | 0.10 (0.02, 0.19) |
| interaction F | F < 1 | F = 1.37 | F < 1 |
| need for closure | 0.30 (–0.12, 0.71) | 0.45 (0.18, 0.73) | 0.13 (–0.16, 0.42) |
| control slope | 0.21 (–0.38, 0.80) | 0.42 (0.00, 0.84) | –0.09 (–0.52, 0.34) |
| full-spoiler slope | 0.52 (–0.07, 1.11) | 0.42 (0.00, 0.84) | 0.39 (–0.04, 0.82) |
| theme-spoiler slope | 0.16 (–0.44, 0.76) | 0.51 (0.08, 0.93) | 0.09 (–0.35, 0.53) |
| interaction F | F < 1 | F < 1 | F = 1.47 |
| MODERATOR | LASTING IMPRESSION | MOVING | TRANSPORTATION |
| need for cognition | 0.29 (0.16, 0.41) | 0.28 (0.16, 0.40) | 0.30 (0.22, 0.38) |
| control slope | 0.29 (0.11, 0.47) | 0.24 (0.06, 0.42) | 0.29 (0.18, 0.41) |
| full-spoiler slope | 0.43 (0.26, 0.60) | 0.41 (0.24, 0.58) | 0.34 (0.23, 0.45) |
| theme-spoiler slope | 0.14 (–0.04, 0.32) | 0.19 (0.01, 0.37) | 0.27 (0.15, 0.38) |
| interaction F | F = 3.43* | F = 2.09 | F = 0.59 |
| print exposure (ART) | 0.04 (–0.02, 0.10) | 0.01 (–0.05, 0.07) | 0.04 (0.00, 0.08) |
| control slope | 0.08 (–0.01, 0.16) | 0.02 (–0.07, 0.10) | 0.03 (–0.02, 0.09) |
| full-spoiler slope | –0.01 (–0.09, 0.08) | 0.02 (–0.07, 0.10) | 0.02 (–0.03, 0.08) |
| theme-spoiler slope | 0.04 (–0.05, 0.13) | 0.00 (–0.09, 0.08) | 0.06 (0.00, 0.12) |
| interaction F | F = 1.24 | F = 0.10 | F = 0.72 |
| need for closure | 0.41 (0.10, 0.71) | 0.45 (0.16, 0.75) | 0.21 (0.00, 0.43) |
| control slope | 0.37 (–0.07, 0.80) | 0.36 (–0.06, 0.78) | 0.29 (0.00, 0.58) |
| full-spoiler slope | 0.50 (0.06, 0.93) | 0.58 (0.16, 1.00) | 0.33 (0.04, 0.62) |
| theme-spoiler slope | 0.36 (–0.09, 0.80) | 0.42 (–0.01, 0.85) | 0.02 (–0.27, 0.32) |
| interaction F | F = 0.16 | F = 0.36 | F = 1.78 |
[i] Note. Boldfaced slopes are significantly different from 0 (α = .05). Slopes are unstandardized. *p < .05.
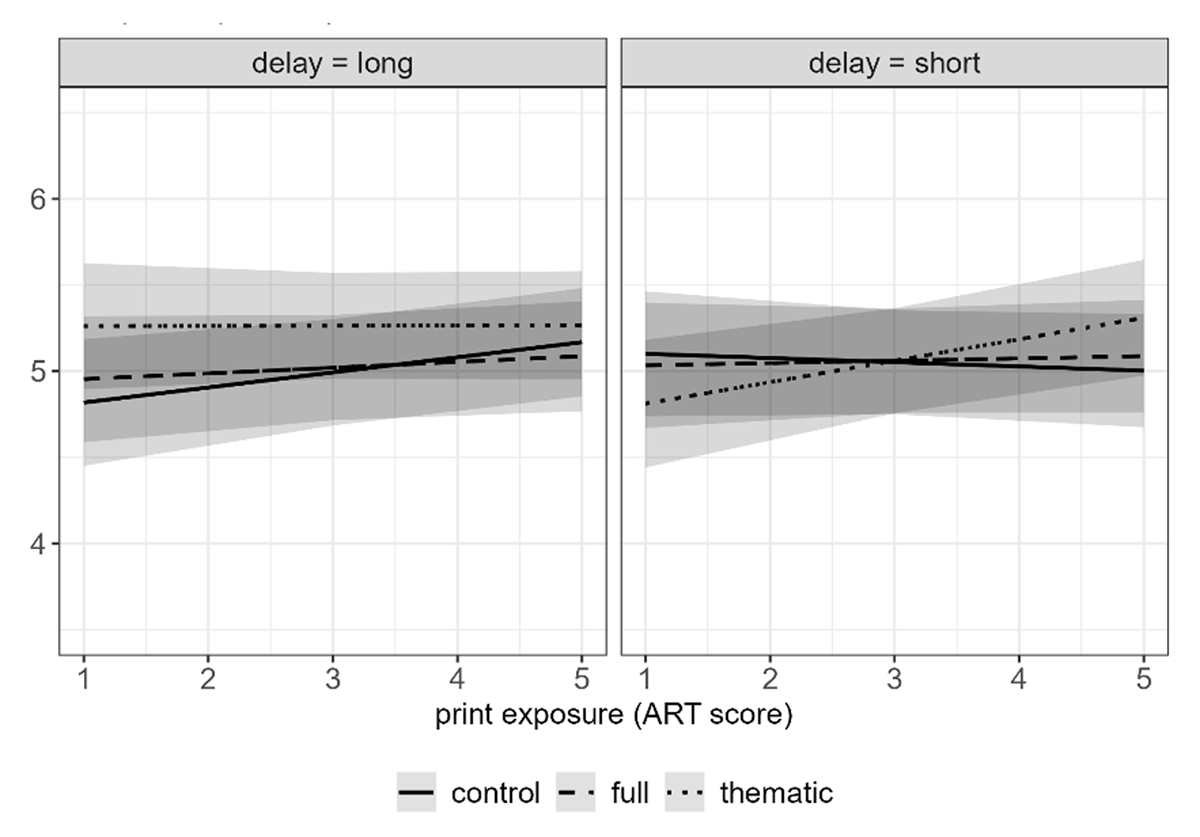
Figure 2
Model-estimated transportation as a function of spoiler condition, delay condition, and print exposure. Bands represent 95% confidence intervals.