
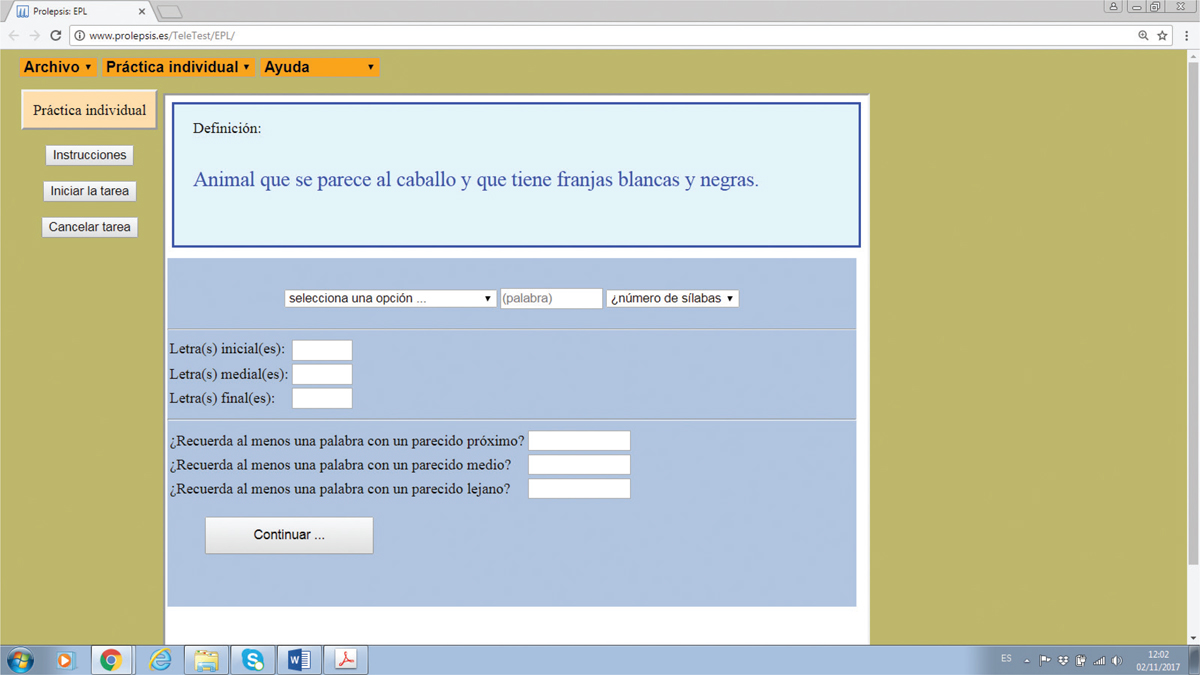
Figure 1
Screenshot of a trial of the TOT procedure
Table 1
Study A: Mean hit rates in target and non-target items of the exam for the practiced and unpracticed participants.
| Non-target items | Target items | Difference | |
|---|---|---|---|
| Practiced Group | .67 (.03) | .35 (.04) | .32 |
| Unpracticed group | .56 (.03) | .11 (.04) | .45 |
| Difference | .11 | .24 |
[i] The corresponding mean standard errors can be seen within parentheses
Table 2
Study A: Mean net values in target and non-target items of the exam for the practiced and unpracticed participants
| Non-target items | Target items | Difference | |
|---|---|---|---|
| Practiced Group | 6.05 (.29) | 2.44 (.47) | 3.61 |
| Unpracticed group | 4.23 (.43) | .53 (.39) | 3.70 |
| Difference | 1.81 | 1.91 |
[i] The corresponding mean standard errors can be seen within parentheses.
Table 3
Study B: Mean hit rates in target and non-target items of the exam for the practiced and unpracticed participants
| Non-target items | Target items | Difference | |
|---|---|---|---|
| Practiced Group | .49 (.01) | .50 (.03) | -.01 |
| Unpracticed group | .46 (.01) | .16 (.02) | .30 |
| Difference | .03 | .34 |
[i] The corresponding mean standard errors can be seen within parentheses.
Table 4
Study B: Mean net values in target and non-target items of the exam for the practiced and unpracticed participants.
| Non-target items | Target items | Difference | |
|---|---|---|---|
| Practiced Group | 3.83 (.17) | 3.91 (.28) | -.08 |
| Unpracticed group | 2.99 (.20) | .70 (.15) | 2.29 |
| Difference | .84 | 3.21 |
[i] The corresponding mean standard errors can be seen within parentheses.