
Table 1
Journal statistics per year (2013–2020)
| 2013, volume 5 issues 1-4 | 2014, volume 6 issues 1-4 | 2015, volume 7 issues 1-4 | 2016, volume 8 issues 1-4 | 2017, volume 9 issues 1-4 | 2018, volume 10 issues 1-4 | 2019, volume 11 issues 1-4 | 2020, volume 12 issues 1-4 | |
|---|---|---|---|---|---|---|---|---|
| Issues published | 4 | 4 | 4 | 4 | 4 | 4 | 4 | 4 |
| Items published | 38 | 35 | 33 | 34 | 38 | 36 | 37 | 42 |
| Research papers | 21 | 16 | 13 | 14 | 21 | 20 | 20 | 33 |
| Innovative practice papers | 2 | 6 | 3 | 2 | 4 | 3 | 2 | 3 |
| Special papers* | 9 | 9 | 11 | 8 | 7 | 7 | 10 | - |
| Editorial | 4 | 4 | 4 | 4 | 4 | 5 | 4 | 4 |
| Software or book reviews | 2 | - | 2 | 6 | 2 | 1 | 1 | 2 |
| Total submissions | 56 | 52 | 57 | 63 | 65 | 54 | 61 | 63 |
| Rejected before peer-review | 10 | 10 | 10 | 15 (+ 4 book reviews) | 17 (+ 3 book reviews) | 10 (+ 3 book reviews) | 16 (+ 2 book reviews) | 13 |
| Peer reviewed | 44 | 42 | 45 | 38 | 43 | 40 | 42 | 48 |
| Accepted | 32 | 31 | 27 | 24 | 32 | 27 | 32 | 38 |
| Days to review | 47 | 41 | 56 | 63 | 56 | 61 | 57 | 73 |
| Days to publication | 107 | 118 | 117 | 158 | 169 | 163 | 167 | 199 |
| Acceptance rate | 60,70% | 59,61% | 50,88% | 45,28% | 53,33% | 54% | 54% | 63,5% |
| Number of authors | 65 | 81 | 71 | 65 | 80 | 70 | 105 | 100 |
| Average authors per paper | 1,71 | 2,31 | 2,15 | 1,91 | 2,11 | 1,94 | 2,84 | 2,38 |
| Number of reviewers | 45 | 53 | 61 | 59 | 66 | 58 | 59 | 62 |
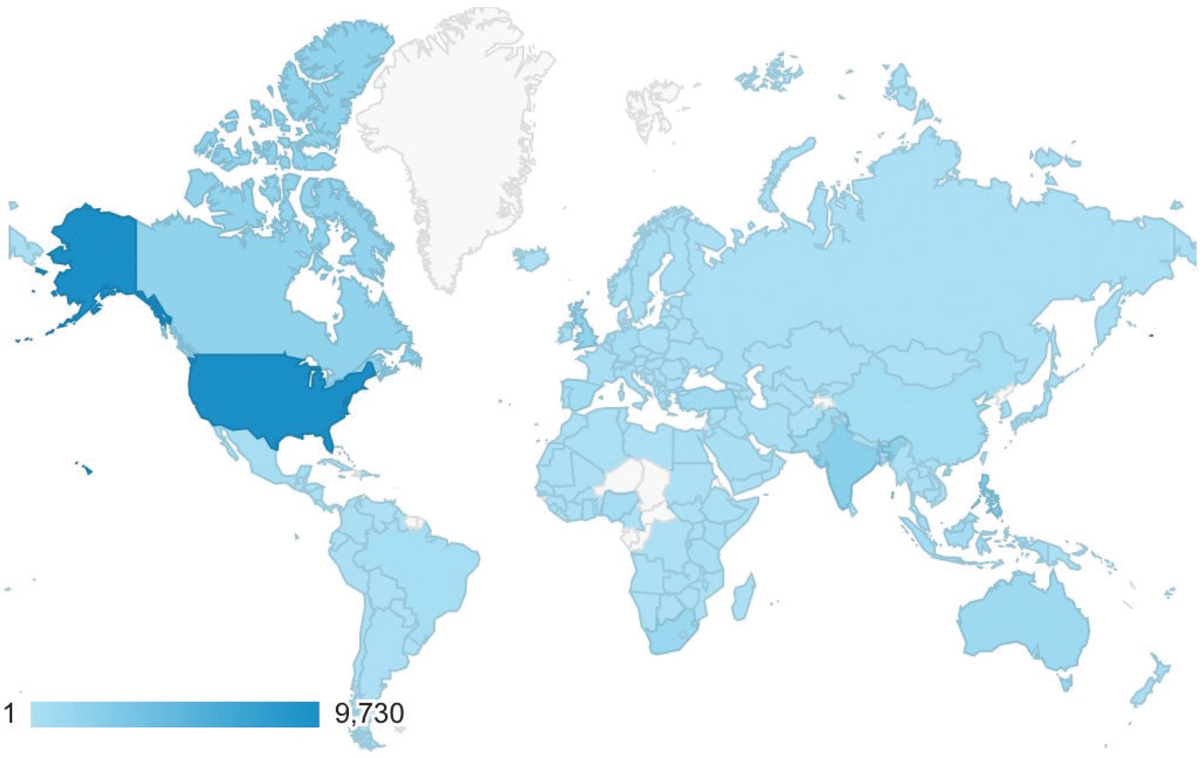
Figure 1
Location of visitors to Open Praxis website (January–December 2020)
Source: Google Analytics
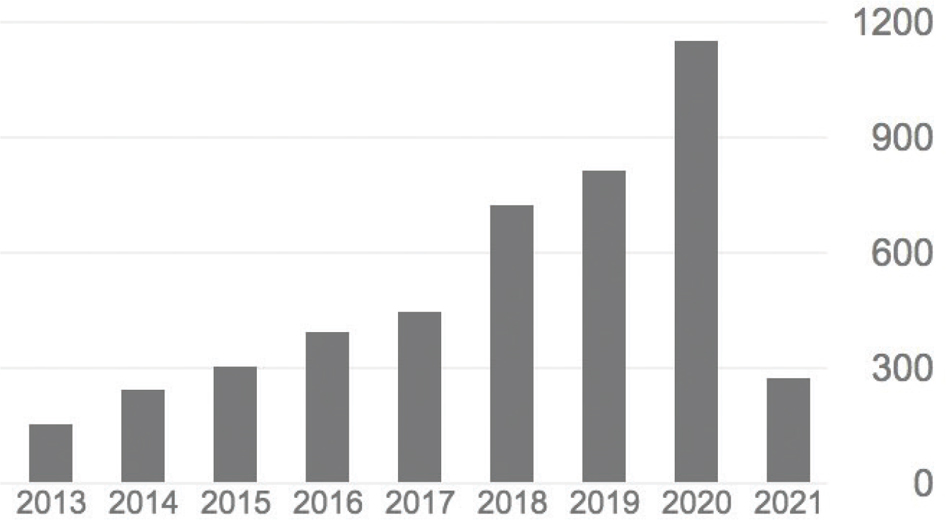
Figure 2
Citations to Open Praxis per year. 2013–2021
Source: Google Scholar