
Table 1
Research design.
| Group | Procedures | Post-test |
|---|---|---|
| A (Bounce Rate) | e-Learning Interaction (URL, Time) | GPA, Engagement Time |
| B (Average Group) | e-Learning Interaction (URL, Time) | GPA, Engagement Time |
| C (Advance Group) | e-Learning Interaction (URL, Time) | GPA, Engagement Time |
[i] *A=Control Group; B=Experimental Group 1; C=Experimental Group 2
Table 2
Distribution of the learners according to the courses they are registered.
| Course | Frequency | Percent |
|---|---|---|
| Basic Information Technologies I | 79,089 | 24.5 |
| Basic Concepts of Law | 100,880 | 31.2 |
| Ataturk’s Principles and Revolution History I | 74,523 | 23.1 |
| Introduction to Economics I | 68,772 | 21.3 |
| Total | 323,264 | 100.0 |
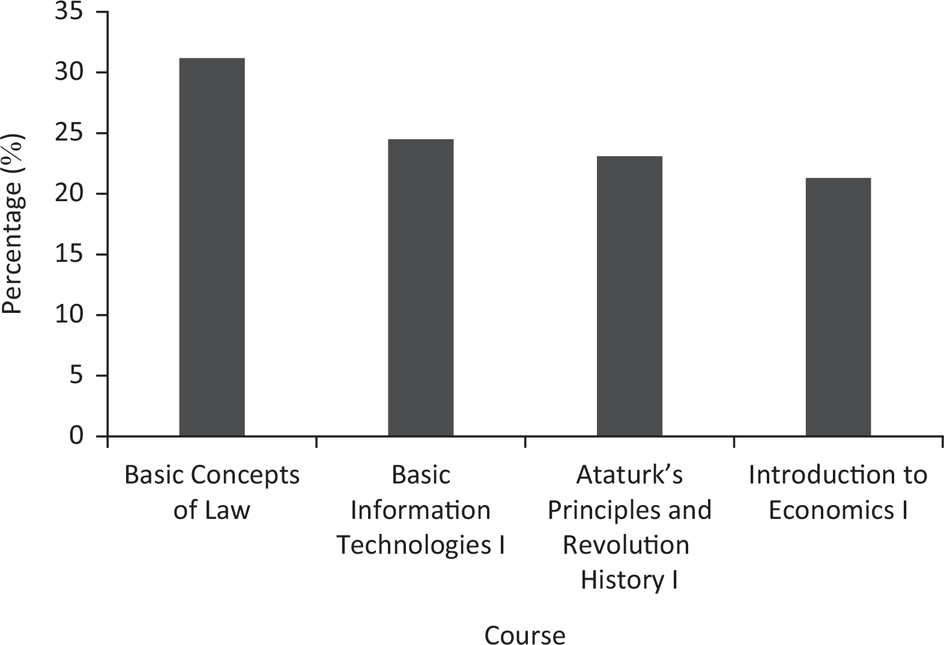
Figure 1
Distribution of the materials accessed (hits) on the e-learning portal according to the courses.
Table 3
Distribution of the learners according to their engagement time level.
| Engagement | Frequency | Percent |
|---|---|---|
| Bounce Rate | 90,083 | 27.9 |
| Average Group | 140,790 | 43.6 |
| Advance Group | 92,391 | 28.6 |
| Total | 323,264 | 100.0 |
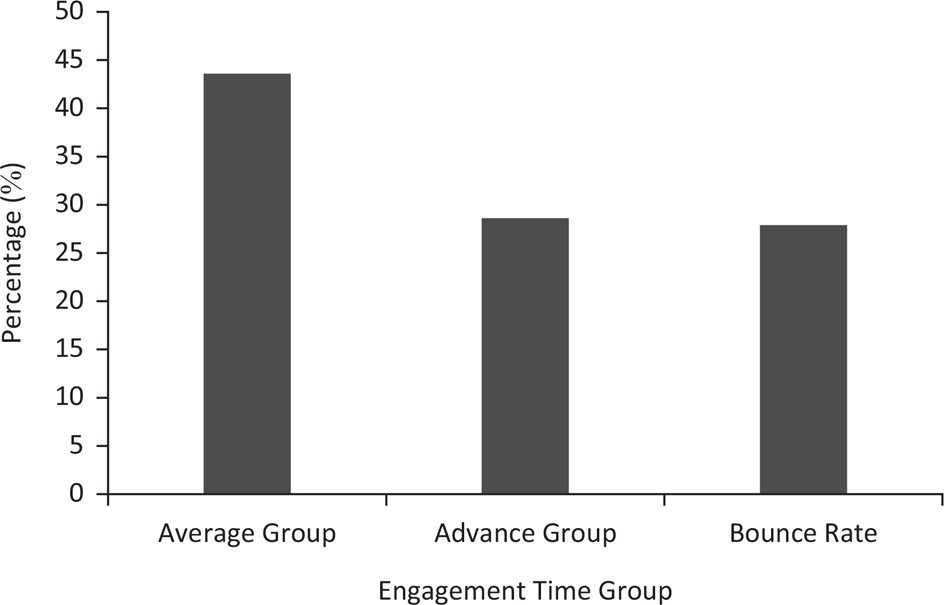
Figure 2
Distribution of the learners in engagement groups.
Table 4
Distribution of the learners according to their academic achievement.
| Types | Frequency | Percent |
|---|---|---|
| Dropout | 9,793 | 3.0 |
| Normal | 313,471 | 97.0 |
| Total | 323,264 | 100.0 |
Table 5
The time learners spent on the e-learning portal according to the courses.
| Course | Mean (TotalTime- Second) | Mean (TotalTime- Minute) | Std. Deviation (TotalTime- Second) | Std. Deviation (TotalTime-Minute) |
|---|---|---|---|---|
| Basic Information Technologies I | 19738.06 | 328.97 | 57004.73 | 950.08 |
| Basic Concepts of Law | 23338.48 | 388.97 | 61341.48 | 1022.358 |
| Ataturk’s Principles and Revolution History I | 25490.03 | 424.83 | 65655.59 | 1094.26 |
| Introduction to Economics I | 21347.24 | 355.79 | 57658.06 | 960.97 |
| Total | 22529.99 | 375.50 | 60618.95 | 1010.32 |
Table 6
One-way ANOVA findings of the time spent on the portal according to the courses.
| Variables | Groups | df | MS | F | p (two tailed) |
|---|---|---|---|---|---|
| Real Time | Between Groups | 3 | 47719809787 | 130.017 | p<.001 |
| Within Groups | 323,260 | 367026352 | |||
| Total | 323,263 |
Table 7
Post Hoc findings of the time spent on the portal according to the courses.
| (I) group | (J) Group | MD (I-J) |
|---|---|---|
| Basic Information Technologies I | Basic Concepts of Law | -3600.42034* |
| Ataturk’s Principles and Revolution History I | -5751.97250* | |
| Introduction to Economics I | -1609.17921* | |
| Basic Concepts of Law | Basic Information Technologies I | 3600.42034* |
| Ataturk’s Principles and Revolution History I | -2151.55215* | |
| Introduction to Economics I | 1991.24114* | |
| Ataturk’s Principles and Revolution History I | Basic Information Technologies I | 5751.97250* |
| Basic Concepts of Law | 2151.5215* | |
| Introduction to Economics I | 4142.79329* | |
| Introduction to Economics I | Basic Information Technologies I | 1609.17921* |
| Basic Concepts of Law | -1991.24114* | |
| Ataturk’s Principles and Revolution History I | -4142.79329* |
Table 8
Learners’ academic achievement according to the time they spent on the e-learning portal.
| Engagement Time Group | Mean (GPA) | Std. Deviation (GPA) |
|---|---|---|
| Bounce Rate | 37.2658 | 17.75675 |
| Average Group | 39.5740 | 17.87560 |
| Advance Group | 43.8007 | 17.28946 |
| Total | 40.1388 | 17.85317 |
Table 9
One-way ANOVA findings of the comparison of academic achievement according to engagement time level.
| Variable | Groups | df | MS | F | p (two tailed) |
|---|---|---|---|---|---|
| GPA | Between Groups | 2 | 1013677 | 3244.123 | *p<.001 |
| Within Groups | 323,261 | 312 | |||
| Total | 323,263 |
Table 10
Post Hoc findings about the comparison of academic achievement according to engagement time level groups.
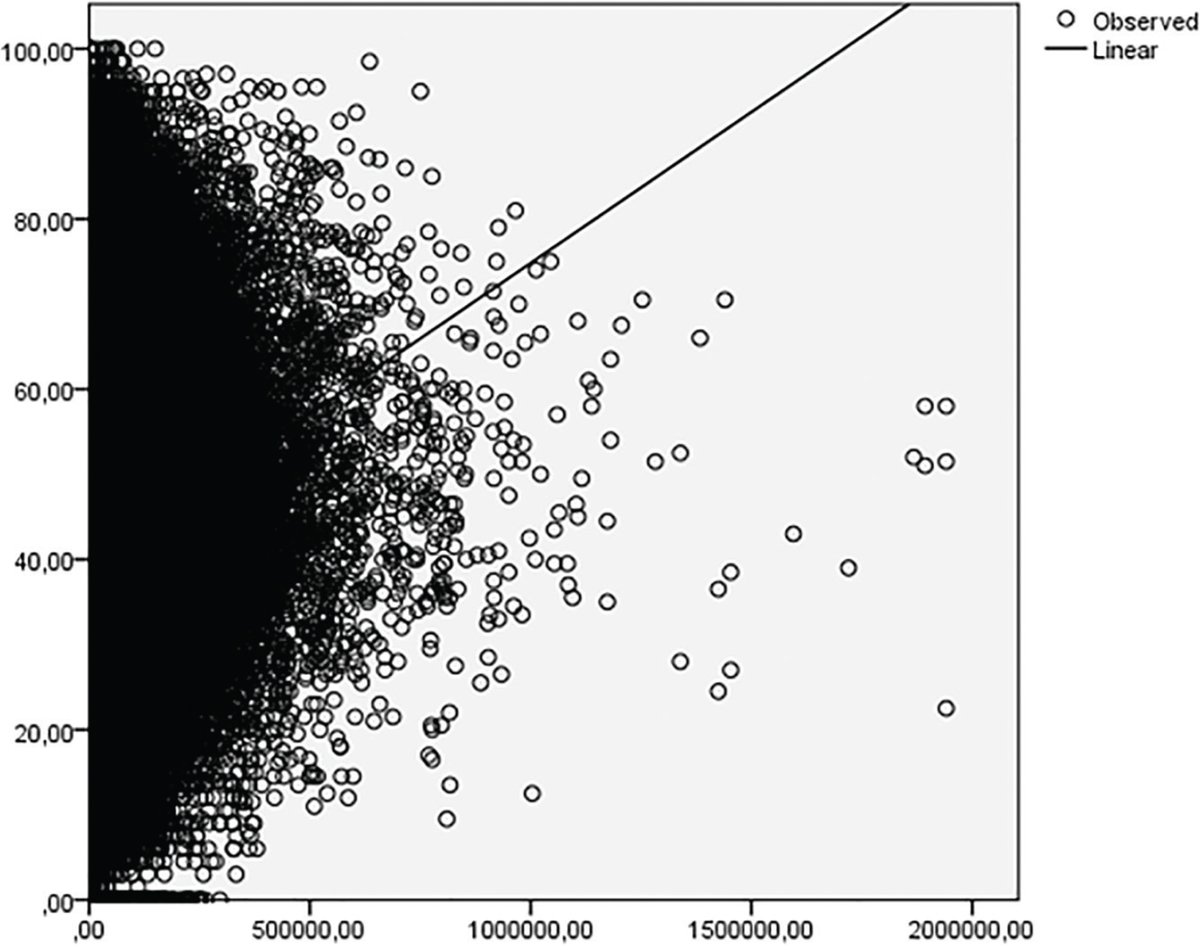
Figure 3
Regression curve of engagement and academic achievement.