
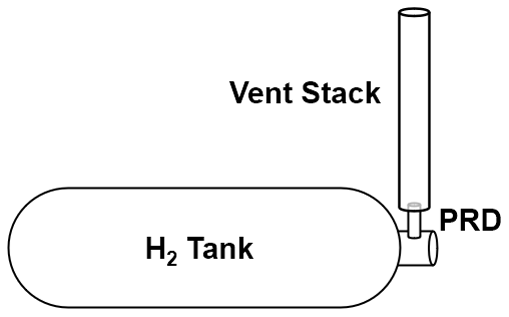
Figure 1
Generic vent stack design used for study.
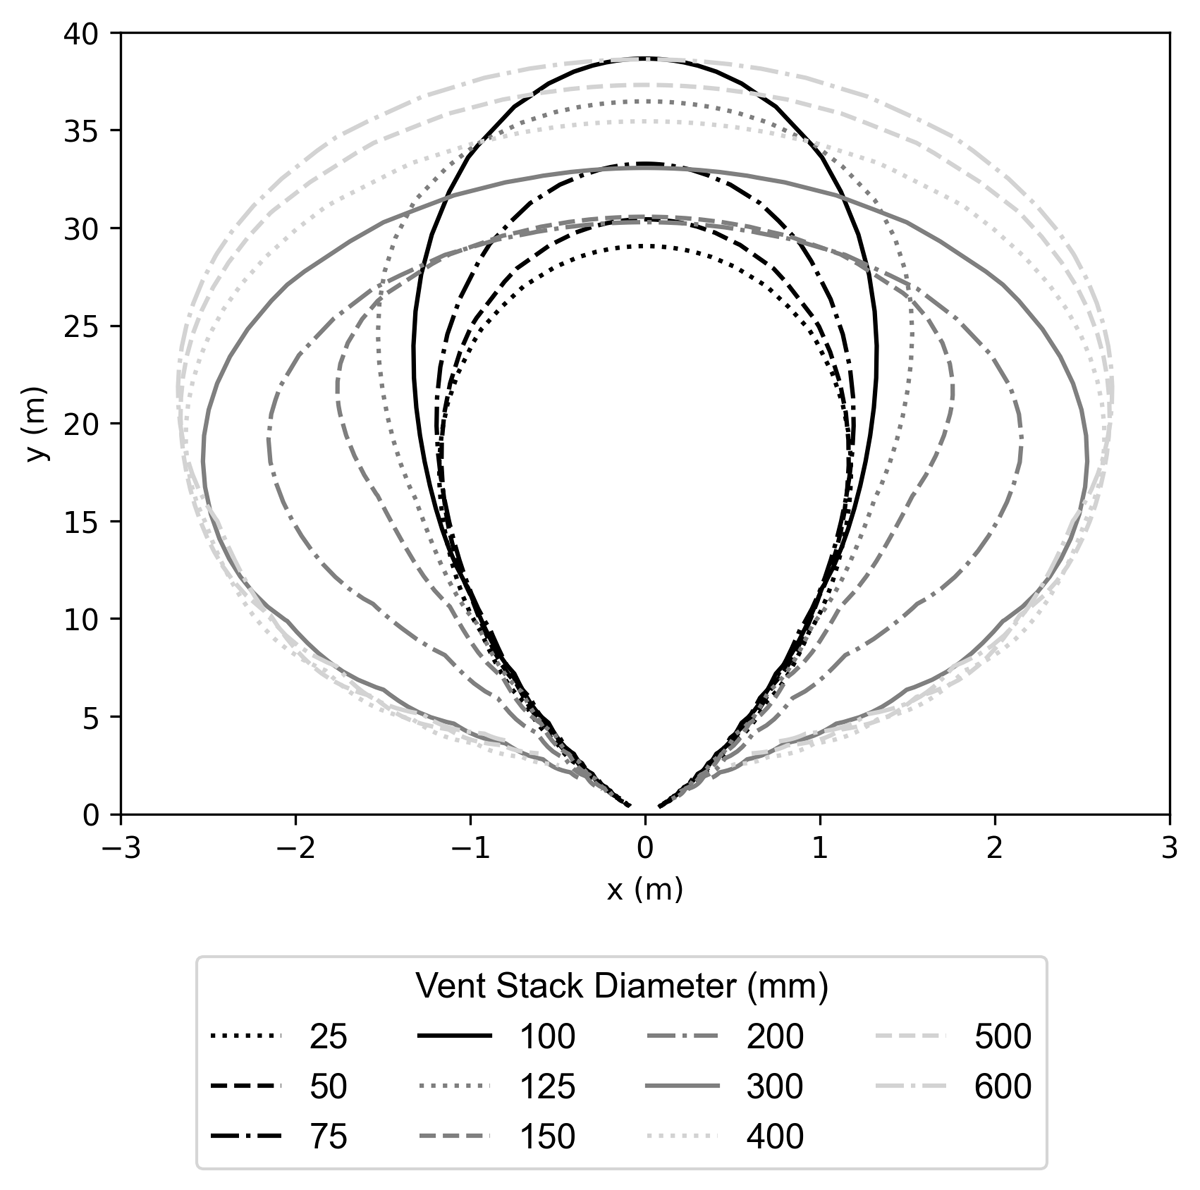
Figure 2
Jet plume concentration contours showing 4 mol% concentration by volume of hydrogen for vent stack releases with a constant mass flow rate of 750 g/s.
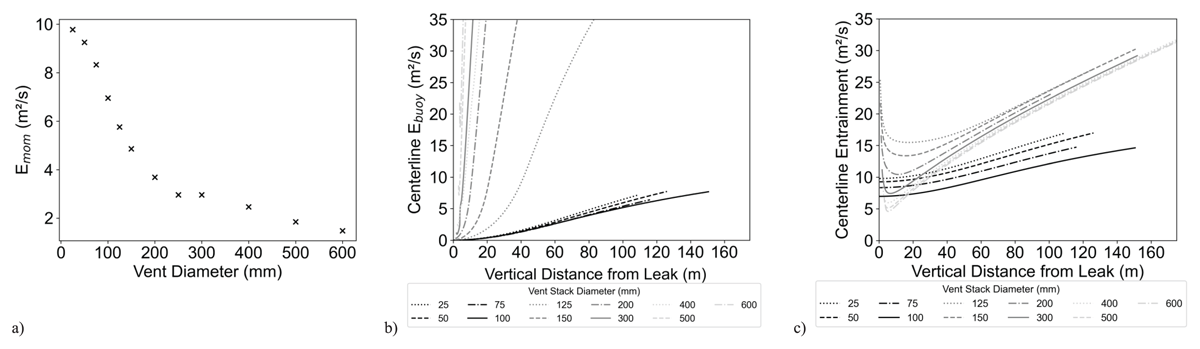
Figure 3
a) Momentum-driven entrainment as a function of vent diameter, b) buoyancy-driven entrainment as a function of distance from the leak, and c) overall entrainment as a function of vertical distance from the leak.
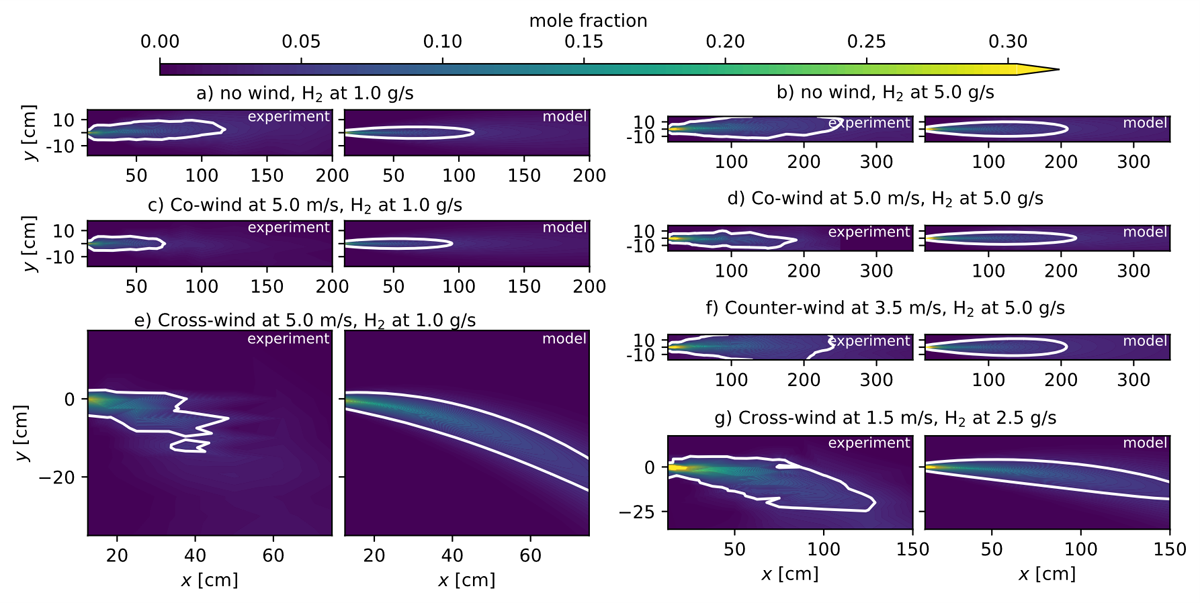
Figure 4
Comparison of horizontal release plume behavior for Grüne et al. (2021) experiments (left frames) and HyRAM+ model (right frames) for various wind and hydrogen flow conditions described above each pair of plots for a) no wind, H2 at 1 g/s; b) no wind, H2 at 5 g/s; c) co-flowing wind at 5 m/s, H2 at 1 g/s; d) co-flowing wind at 5 m/s, H2 at 5 g/s; e) cross-flowing wind at 5 m/s, H2 at 1 g/s; f) counter-flowing wind at 3.5 m/s, H2 at 5 g/s; g) cross-flowing wind at 1.5 m/s, H2 at 2.5 g/s, using the optimized entrainment coefficients where R2 = 0.86.
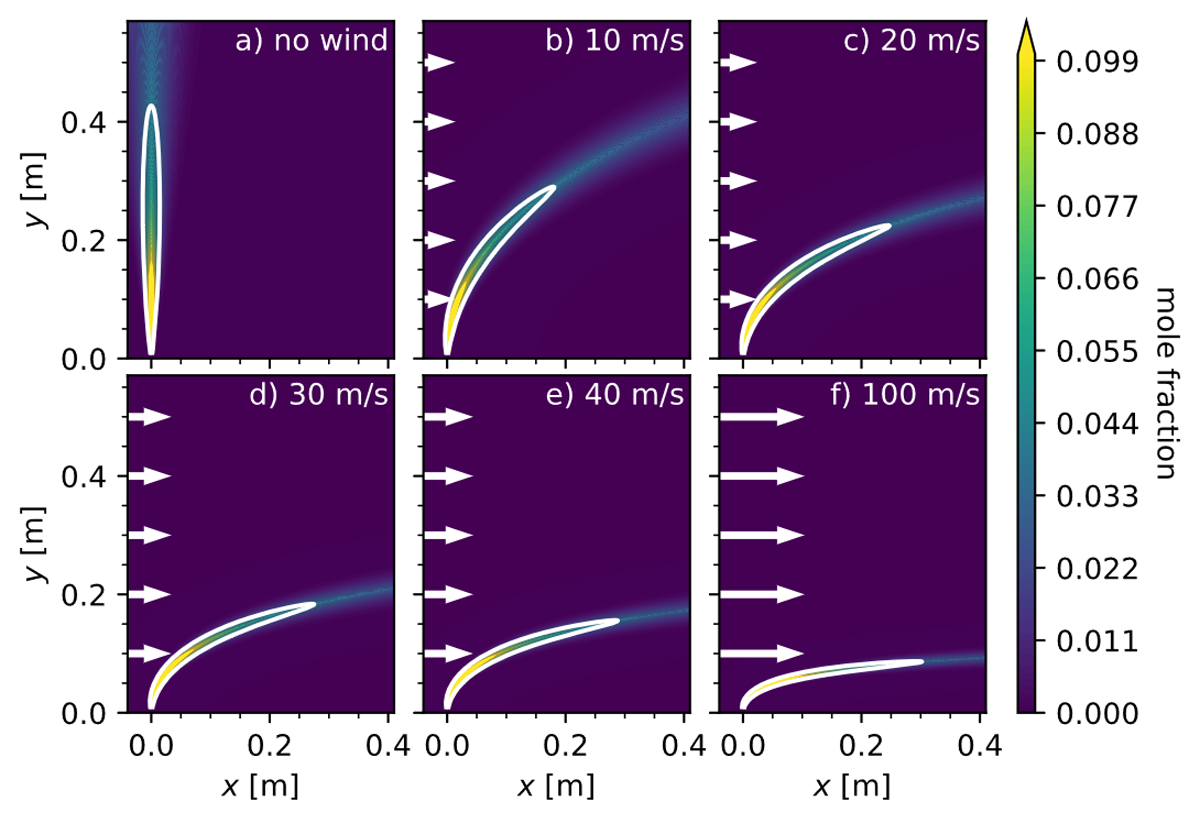
Figure 5
Hydrogen mole fraction in air contours using the HyRAM+ plume model with wind modifications, for hydrogen stored at 0.3 MPa (43 psi) and 25°C (77°F) and released vertically upward through a 1 mm orifice, subject to a) no wind, b) 10 m/s wind at 0°, c) 20 m/s wind at 0°, d) 30 m/s wind at 0°, e) 40 m/s wind at 0°, and f) 100 m/s wind at 0°. White boundary lines correspond to 0.04 hydrogen mole fraction.
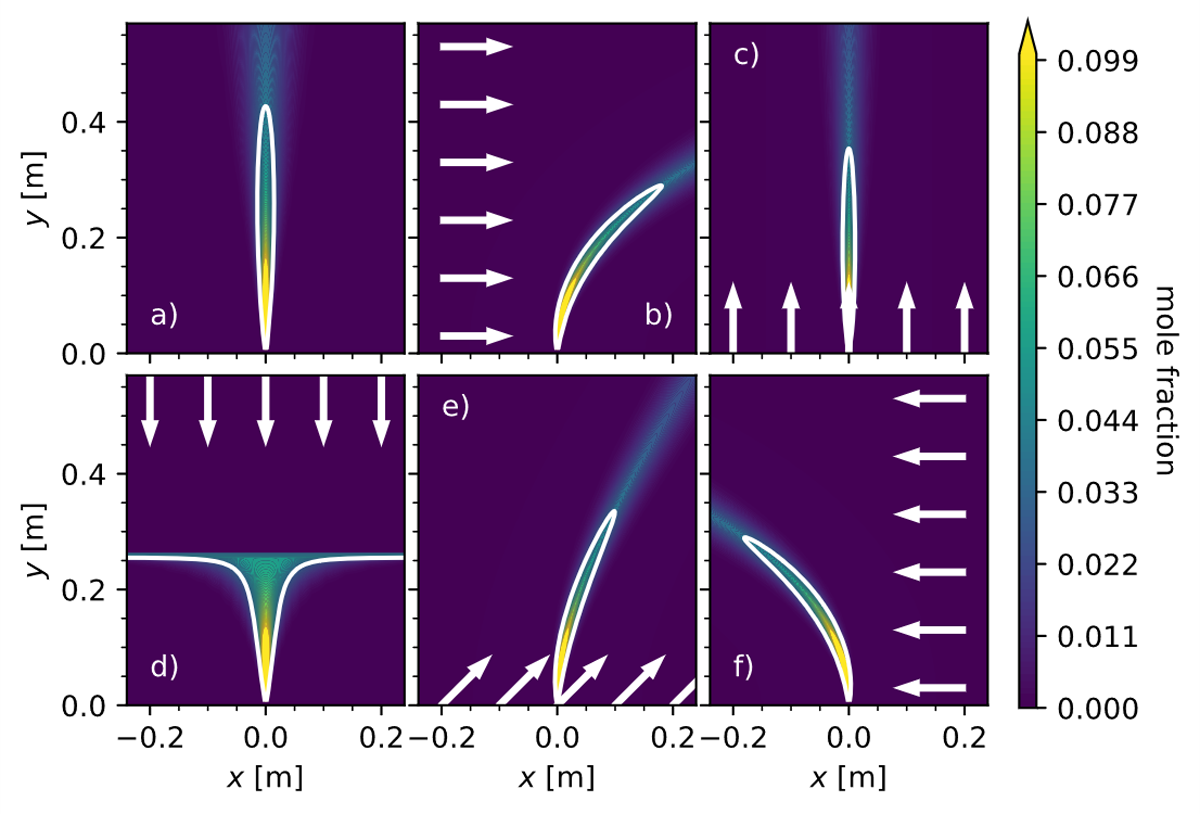
Figure 6
Hydrogen mole fraction in air contours using the HyRAM+ plume model with wind modifications, for hydrogen stored at 0.3 MPa (43 psi) and 25°C (77°F) and released vertically through a 1 mm orifice, subject to a) no wind, b) 10 m/s wind at 0°, c) 10 m/s at 90°, d) 10 m/s at –90°, e) 10 m/s at 45°, and f) 10 m/s at 180°. White boundary lines correspond to 0.04 hydrogen mole fraction.
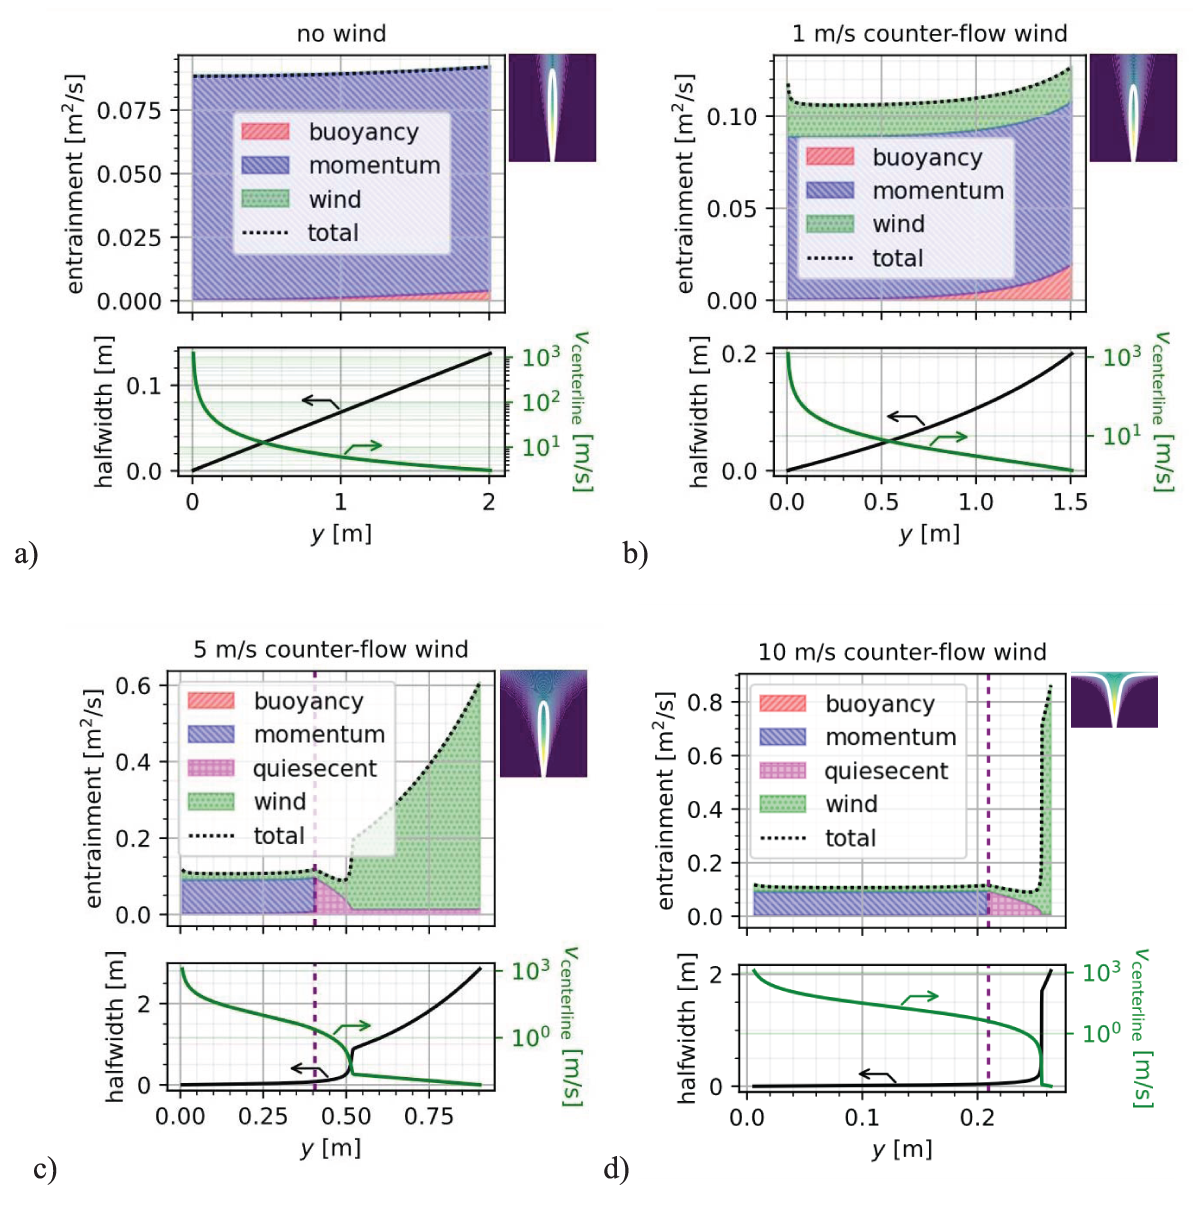
Figure 7
HyRAM+ wind entrainment model behavior for vertically counter-flowing wind for a vertically upward release with a) no wind b) 1 m/s, c) 5 m/s, and d) 10 m/s. The dashed purple vertical line designates the point at which momentum and buoyancy entrainment are limited in the HyRAM+ model.