
1 Introduction
Hydrogen systems include pressure relief devices (PRDs) and attached vent stacks to prevent over-pressurization and explosion of storage tanks and other components. In many cases, vent stacks are stationary (e.g., hydrogen production and refueling infrastructure) or have a low volume of hazardous material to vent (e.g., light-duty vehicles). However, heavy-duty applications, such as industrial use or heavy-duty vehicles such as trains, may potentially have a large volume of hazardous material that could vent to the atmosphere. Upon release, the hydrogen can also mix and be affected by wind velocity and relative direction. The physical behavior of hydrogen in such an environment should be better characterized in order to develop models to predict behavior for use in safety assessments. Such models can be useful in quantitative risk assessments or hazard distance calculations.
Most public hydrogen dispersion datasets are for smaller free jets (i.e., no stack) and/or quiescent conditions, and the vent stack geometry changes the size and rate of release (e.g., diameter, exit state, choking). There are some published studies regarding the behavior, characteristics, and modeling of jet plume releases from vent stacks. Hecht and Killingsworth (2021) published experimental work studying the behavior of cryogenic hydrogen plumes released out of vent stacks into the open air; these results were used to validate and improve Gaussian plume modeling, but were largely qualitative. Many of the models in the literature are based on releases by fluids or particulates other than hydrogen, such as water (Gebhart, Hilder and Kelleher, 1984), volcanic ash (Dürig et al., 2023), helium (Shu et al., 2022), and petroleum (American Petroleum Institute, 1997). Some of these require a flowrate as an input or these models calculate a generic flowrate, disregarding choked flow and real-gas behavior of hydrogen. Quantitative experimental data for vent stack releases is extremely limited, due to the difficulties in obtaining concentration field data for larger releases.
Zhang and Ghoniem (1993) developed a computational model for wind-blown, buoyancy-driven flows and potential atmospheric stratification. Existing studies of plume behavior in wind reveal that turbulent mixing from the interaction of the plume and ambient air has a substantial effect on plume entrainment and plume geometry (Suzuki and Koyaguchi, 2015). Previous studies comparing simulation to observed fluid behavior have tested models where the perpendicular and parallel velocity components do not equally impact the entrainment of the plume (Devenish, Rooney and Thomson, 2010), and model equations similarly reflect this premise. However, none of these models have been developed or validated specifically for hydrogen, meaning that the wide flammability range and dispersion characteristics of hydrogen in particular may not be well captured.
The release of an unignited hydrogen jet plume out of a vent stack and the behavior of hydrogen in the presence of wind are two phenomena examined in this current work. This is similar to previous work on this topic (Louie et al., 2024), but the validation data for the entrainment model has been extended. The study presented in this paper is unique because of the focus on reduced-order modeling of hydrogen plumes—previously-published models may be more computationally-involved (Giannissi et al., 2021) or focused on releases of substances other than hydrogen into air (Mahesh, 2013; Taylor, Grimmett and Comings, 1951). In this work, we focus on fast-running models that can be incorporated into quantitative risk assessments and ensuring that the relevant modeling parameters are valid for use with hydrogen releases.
2 Methods
2.1 Models for hydrogen release through a vent stack
An understanding of hydrogen plume formation characteristics from a vent stack release can inform safe design. The generic schematic shown in Figure 1 shows a vent stack design in which a PRD is mounted on a hydrogen tank and connected to a vent stack that has a larger diameter compared to the PRD. To relieve pressure if the tank experiences overheating or overpressurization, hydrogen is released and moves away from the system via the vent stack before being released into the surrounding air.
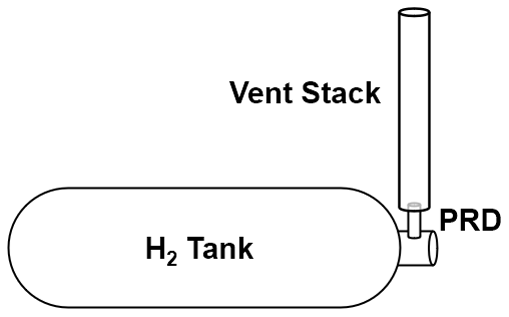
Figure 1
Generic vent stack design used for study.
The physics modeling for plume formation was done using HyRAM+ v5.1 (Sandia National Laboratories, 2023), where the plume modeling starts only at the exit of the vent stack. The PRD orifice and vent stack have different flow areas, and it is assumed that the mass flow rate of hydrogen exiting the PRD and entering the vent stack is equal to the mass flow rate of hydrogen exiting the vent stack. It is further assumed that the hydrogen exiting the vent stack is pure hydrogen at steady-state; this assumes that the initial flow of hydrogen out of the PRD would have swept out the air within the vent stack before reaching steady-state. This assumption of steady-state flow does not consider time-dependent behavior, such as the blowdown of a tank, but rather calculates the flow at a specific tank pressure. This is the maximum flow at the highest tank pressure; more refined time-dependent models would be needed to capture the flow and dispersion behavior over time. This was implemented by first calculating the mass flow rate based on the storage conditions and the PRD flow diameter; this flow restriction thus forms the flowrate which exits the vent stack. It was then assumed that the conditions at the vent stack exit are ambient temperature and pressure, although this can be changed as an input to an analysis. An iterative solver was then used to find an intermediate vent stack pressure that gives the same mass flow rate that was calculated through the PRD but instead using the conditions and diameter of the vent stack exit.
A tank temperature of 27°C, tank pressure of 45 MPa, and PRD inner diameter of 6 mm were used. The ambient conditions were set at 20°C and 0.1 MPa. Friction and heat loss were assumed to be negligible within the vent stack. The resulting mass flow rate out of the PRD and out of the vent stack was 750 g/s.
One of the main vent stack design parameters is the diameter. As the diameter changes, the velocity of hydrogen out of the vent stack changes, which affects the shape of the plume. The vent stack diameter was varied between 25 and 600 mm. The upper part of this tested range represents diameters that are likely much larger than would be needed for most vent stacks, but the objective of the study was to demonstrate trends in plume size and shape overall.
2.2 Models for hydrogen jet plume behavior in wind
For this current work, an approach was developed for incorporating wind into existing HyRAM+ plume models, which do not currently account for wind (Ehrhart et al., 2023). It was assumed that the wind direction and velocity were constant across the jet plume. A wind term (pwind,x) was added to the governing equation for momentum in the x-direction, and is calculated as
where S is the distance along the plume streamline [m]; ρ is the density [kg/m3]; v is the velocity [m/s]; θ is the polar angle of the leak with respect to horizontal; r is the plume radius [m]; pwind,x is the momentum of the wind [kg-m/s]; vwind is the wind velocity [m/s]; θwind is the wind angle with respect to horizontal; ρambient is the density of the ambient air [kg/m3]; E is the entrainment [m2/s].
Similarly, a new wind term was added to the governing equation for momentum in the y-direction (pwind,y), which looks similar to x-momentum, but has a term accounting for buoyancy due to gravity where g is acceleration due to gravity [m/s2]:
where
The air entrainment was calculated as
where Emomentum [m2/s] is entrainment due to momentum, Ebuoy [m2/s] is entrainment due to buoyancy, and Ewind [m2/s] is a new wind entrainment term
where B is the halfwidth of the Gaussian plume [m], vcl,plume is the centerline velocity of the plume [m/s], c⊥ is an empirical constant related to the component of wind perpendicular to the leak [dimensionless] and c∥ is an empirical constant related to the component of wind parallel to the leak [dimensionless].
The model modifications are similar to other Gaussian plume models that include wind, many of which have been validated by release experiments, as summarized by (Gebhart, Hilder and Kelleher, 1984). However, models in the literature were based on releases by fluids or particulates other than hydrogen and may not be valid for hydrogen plumes. A paper by Grüne et al. (2021) reported data for hydrogen concentration at specific points along a hydrogen plume under varied wind speed and direction. The Grüne et al. (2021) experiment was conducted within a test vessel and the publication provided data for mass flow rates of 1 and 5 g/s, orifice sizes of 1 and 4 mm, and hydrogen temperature of 20°C. The wind directions included co-flow (parallel to the direction of the hydrogen release) and counter-flow (anti-parallel to the direction of the hydrogen release) at speeds of 1.5, 3.5, and 5 m/s. Grüne provided the entire flow-fields measured in a private communication and these data were used in this work to calculate the c⊥ and c∥ coefficients in the entrainment model for hydrogen plumes released into a flowing air stream (Equation 5).
3 Results and Discussion
3.1 Results of hydrogen release through a vent stack
Contours for the lower flammability limit (LFL) of 4% by volume in air are shown in Figure 2 for various vent stack diameters. The plume shape lengthens vertically (axially) and widens (radially) as the vent diameter increases from 25 to 100 mm. Between diameters of 100 and 150 mm, the plume appears to shorten vertically and become much wider. For diameters over 150 mm, the original trend of the plume lengthening and widening with increasing diameter is again observed.
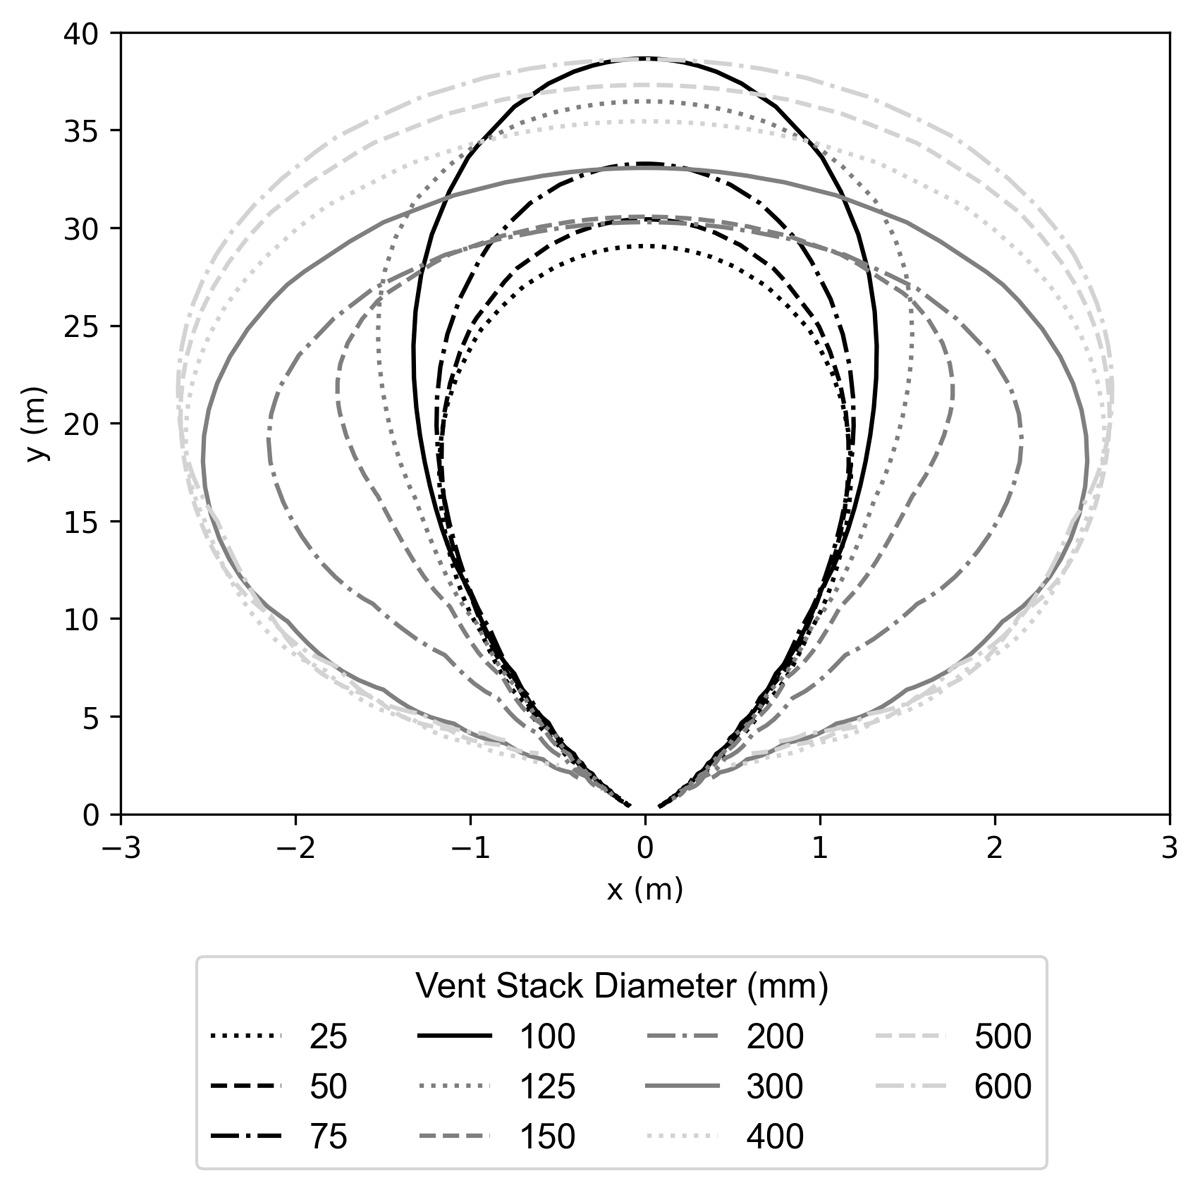
Figure 2
Jet plume concentration contours showing 4 mol% concentration by volume of hydrogen for vent stack releases with a constant mass flow rate of 750 g/s.
The observed trend of increasing plume length with increasing diameter for vent stack diameters within two groups of diameters (25–100 mm and >150 mm) may be unintuitive if assuming velocity would decrease with an increasing vent diameter at a constant effluent mass flow rate. However, there are distinct physical velocity thresholds between the three groups. The effluent from vent stacks with diameters of up to 75 mm are choked, which means their velocities are equal to the speed of sound at the vent stack outlet (i.e., the velocities are nearly the same for each of these diameters). The mass flow rate is the same for all simulations; for choked flow at a specified ambient temperature, the pressure and density of the hydrogen at the vent stack outlet decrease as the diameter increases. For the same conditions, flow is unchoked for vent stacks with diameters of 100 mm and larger, meaning the exit velocity is subsonic, the vent stack pressure is near-ambient, the density of hydrogen is constant, and the velocity decreases as the diameter increases.
The entrainment model is also partially responsible for the variation in plume length with increasing vent stack diameter. Entrainment is a measure of the mixing and dilution of the exiting hydrogen in air, and it affects the spatial hydrogen concentration profile. Entrainment is influenced by both momentum and buoyancy, and the HyRAM+ Technical Reference Manual provides the equations for both of these entrainment modes (Ehrhart et al., 2023).
In the current HyRAM+ models, momentum-driven entrainment is influenced by the diameter of the plume at the release point, the hydrogen density at the release point in relation to the ambient density, and the release velocity (Ehrhart et al., 2023). Buoyancy-driven entrainment is based on the densimetric Froude number (Frden), the velocity at the plume centerline, and the plume radius. Momentum-driven entrainment only depends on the release conditions (there is only one momentum-driven entrainment value for a plume), while buoyancy-driven entrainment depends on conditions that change along the length of the plume and therefore must be characterized with respect to distance from the release point. The effect of vent diameter on momentum-driven entrainment, the effect of vertical distance from the leak on buoyancy-driven entrainment, and centerline total (overall) entrainment are shown in Figure 3. As might be expected, the momentum-driven entrainment decreases as vent diameter increases, due to decreasing velocity and turbulent mixing between exiting hydrogen and ambient air. Figure 3b shows how buoyancy-driven entrainment increases along the streamline (further from the leak) for each plume as the centerline velocity decreases. The larger-diameter vent sizes with lower exit velocities show a greater rate of increase in buoyancy-driven entrainment along the centerline than the smaller-diameter vent sizes. Buoyancy-driven entrainment is proportional to vcl,plumeB/Frl, where the local Froude number, Frl, is in turn proportional to the square of the plume centerline velocity, making buoyancy-driven entrainment proportional to B/vcl,plume. A smaller initial velocity and larger diameter (which is closely related to the halfwidth of the plume) therefore increase buoyancy-driven entrainment overall, and the higher rate of increase in halfwidth and decay in velocity along the plume increase the rate of increase in buoyancy-driven entrainment for the large vent stacks compared to smaller vent stacks.
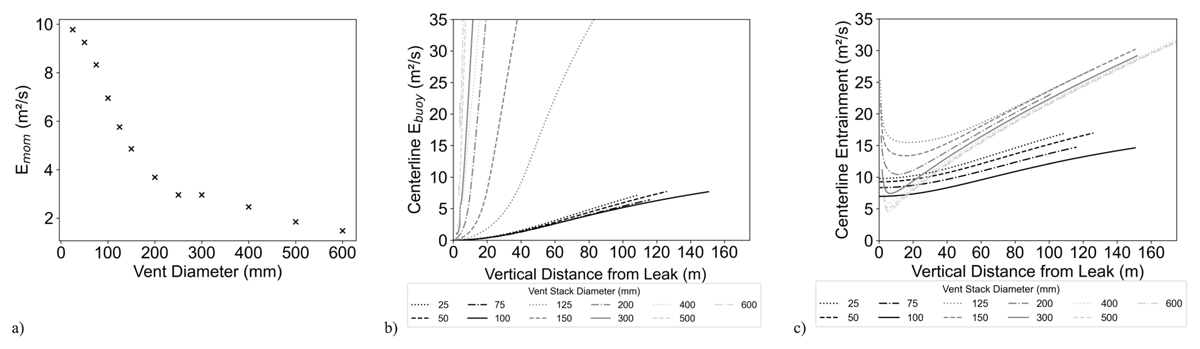
Figure 3
a) Momentum-driven entrainment as a function of vent diameter, b) buoyancy-driven entrainment as a function of distance from the leak, and c) overall entrainment as a function of vertical distance from the leak.
The trends in Figure 2 are likely related to those shown in Figure 3a. Frden is the ratio of flow inertia to buoyancy. For vent stacks, these are the forces created from differences in density between the plug flow region directly after the vent stack and the ambient air. In HyRAM+, an Frden of 268 or greater is a limiting value where the buoyancy-driven entrainment model changes (Ehrhart et al., 2023). The flow regimes corresponding to limits of Frden largely match with the choked and unchoked velocity regimes, namely, the flows exiting the vent stacks smaller than 100 mm in diameter have Frden > 268 and are choked while the flows exiting larger vent stacks have Frden ≤ 268 and are unchoked. Thus, trends in buoyancy-driven entrainment and changes in Frden across the different vent stack diameters are likely responsible for the plume length trends shown in Figure 2. For example, in Figure 3c, near the leak, values of overall entrainment overlap for vent diameters from 25 to 100 mm and 400 to 600 mm. This corresponds to similar plume lengthening for these diameters, as shown in Figure 2. For diameters between 125 and 300 mm, overall entrainment is greater, especially further from the leak, corresponding to plumes that are shorter and wider.
Additionally, the magnitudes of the two types of entrainment in comparison to each other may explain the trends within the group of intermediate diameters between 100 and 150 mm. The momentum-driven component dominates the overall entrainment for the smaller-diameter, higher-velocity, higher-momentum jets. As the vent diameter increases, buoyancy-driven entrainment dominates the plume’s momentum-driven entrainment closer to the leak point. For the two largest tested diameters, the buoyancy-driven entrainment dominates throughout the entire plume. This shift between momentum- versus buoyancy-driven entrainment seems to occur around the intermediate diameter range, which also coincides with the transition between choked and unchoked flow regimes.
While this study was able to highlight the model features causing the trends shown in Figure 2, the increasing plume length with increasing vent diameter and associated decrease in exit velocity remain unexplained by physical phenomena and may be an artifact of the modeling approach. It is possible that lower velocities and the associated lower entrainment values promote less turbulent mixing and dilution of hydrogen in air, resulting in relatively higher hydrogen concentrations farther from the orifice. Ultimately, there is no experimental data available in the literature that gives a quantitative measurement of a concentration field for a vent stack release such as that described by this particular model. This lack of experimental validation data makes it difficult to quantitatively compare the model results to know if the dispersion trends observed here are physical or numerical artifacts. As such, the model should be used with caution until validation can be completed.
3.2 Results of hydrogen jet plume behavior in wind
After adding terms to the momentum and entrainment equations in HyRAM+ to account for a non-quiescent atmosphere, as described in Section 2.2, the coefficients c∥ and c⊥ were first tuned using data from Grüne et al. (2021) in addition to data from the entire experimental campaign of horizontal releases received via private communication from Grüne. The modified plume model was run with the experimentally given conditions as well as ambient conditions of 20°C and 101 kPa. Each measured data point was compared to HyRAM+ results for a given set of constants, and the error between experiments and the model was minimized. Optimization of the model with the Grüne et al. (2021) data resulted in fitting empirical constants of 0.0417 for c∥, the constant related to the component of the wind parallel to the leak direction, and 0.0142 for c⊥, the constant related to the component of the wind perpendicular to the leak direction.
Several comparisons between the modified HyRAM+ model results and the Grüne et al. (2021) data are provided in Figure 4. In this figure, contour plots of the mole fraction fields are provided, with a white contour line drawn at 0.04, the LFL mole fraction for hydrogen in air. A selection of wind directions and mass flow rates of hydrogen are provided, as described in each label. It should be noted that mass flow rate data was provided in the Grüne et al. (2021) data, and, for a more accurate comparison of the plume behavior in wind rather than the plume formation itself between the model and the data, the HyRAM+ plumes were generated based on a common mass flow rate with the Grüne et al. (2021) data rather than a common pressure. At both 1 and 5 g/s with no wind (Figure 4a and b), the contours and 0.04 mole fraction are very similar between the data (left frames) and the HyRAM+ predictions (right frames), although the empirical data shows a slightly wider and longer plume. The co-flowing wind shortens the plume; both the data and the model show this in Figure 4c and 4d. A counter-flowing wind also shortens the plume while widening it, as shown in Figure 4f. The cross-flowing wind in Figure 4e and 4g shortens the plume as well as causes it to bend in the direction of the wind flow (negative y-direction). The empirical data shows that cross-flowing wind in particular seems to shorten the plume and cause it to disperse more than the model predicts. The angle of deflection is similar between the data and the model. This suggests that while the model for momentum change due to the wind is reasonably representative, the entrainment model may need additional tuning and adaptation for improved accuracy.
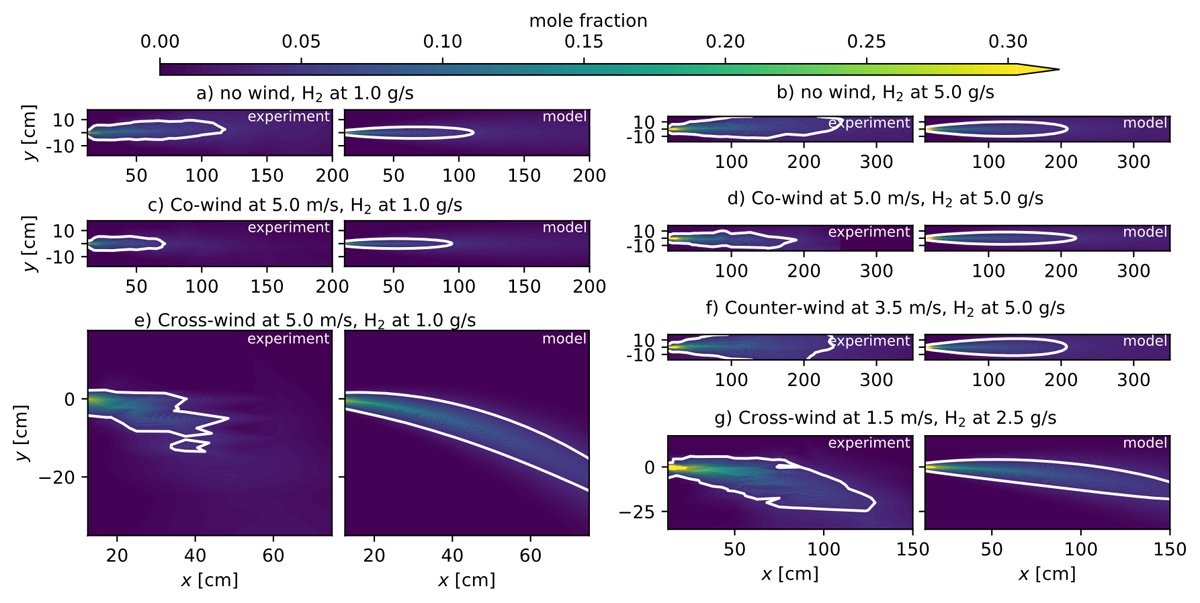
Figure 4
Comparison of horizontal release plume behavior for Grüne et al. (2021) experiments (left frames) and HyRAM+ model (right frames) for various wind and hydrogen flow conditions described above each pair of plots for a) no wind, H2 at 1 g/s; b) no wind, H2 at 5 g/s; c) co-flowing wind at 5 m/s, H2 at 1 g/s; d) co-flowing wind at 5 m/s, H2 at 5 g/s; e) cross-flowing wind at 5 m/s, H2 at 1 g/s; f) counter-flowing wind at 3.5 m/s, H2 at 5 g/s; g) cross-flowing wind at 1.5 m/s, H2 at 2.5 g/s, using the optimized entrainment coefficients where R2 = 0.86.
Figure 5 shows the model-predicted plume behavior under different wind speeds for a vertically discharged jet in horizontal cross-flowing wind. The angle at which the plume bends in the direction of the wind increases with wind speed. The plume shape along the streamline also changes, with higher winds leading to shorter and narrower plumes. This is intuitively what would be expected. As demonstrated in Figure 4, the entrainment coefficient in the cross-wind may be low; the plumes still extend a considerable distance even in a 100 m/s cross-wind. The model may need to account for the increase in turbulence that might be expected as the wind speed increases. It is important to note that this is a steady-state model and the only way an increase in turbulent fluctuations could be manifested in these results is to lower the average concentration and/or the extent of the mole fraction contour. There is no expectation that there would be independent (separated) contour bubbles as the wind sheared off parts of the plume, as was observed in the Grüne et al. (2021) data in Figure 4e and might be expected on a limited timescale.
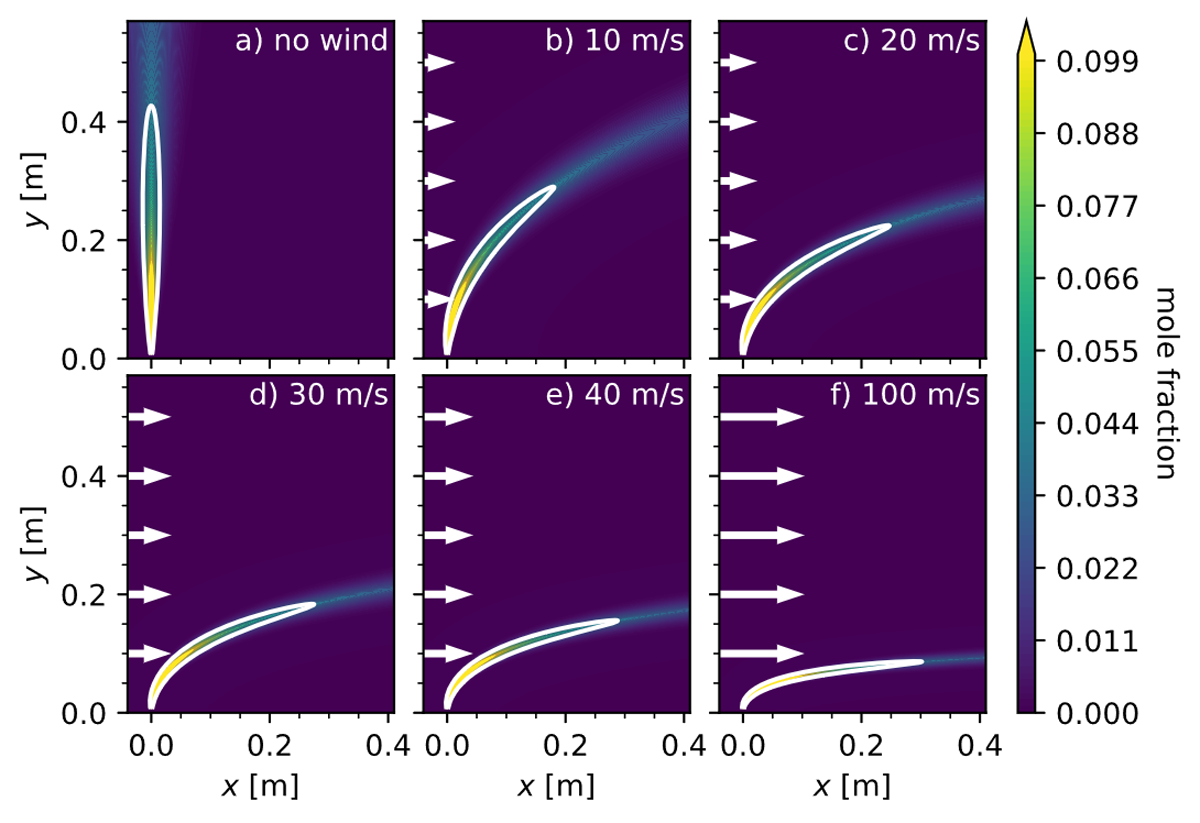
Figure 5
Hydrogen mole fraction in air contours using the HyRAM+ plume model with wind modifications, for hydrogen stored at 0.3 MPa (43 psi) and 25°C (77°F) and released vertically upward through a 1 mm orifice, subject to a) no wind, b) 10 m/s wind at 0°, c) 20 m/s wind at 0°, d) 30 m/s wind at 0°, e) 40 m/s wind at 0°, and f) 100 m/s wind at 0°. White boundary lines correspond to 0.04 hydrogen mole fraction.
The graphics in Figure 6b–6f show a spatial representation of plume behavior in different wind directions, compared to the original no-wind model shown in Figure 6a. The behavior of the plume in the different conditions is generally intuitive, with the plume bending depending on the angle of the wind in each case. The overall streamline length of the plumes also decreases with wind in every case shown, which is consistent with the observation in the Grüne et al. (2021) data that shorter plumes were detected in the presence of wind (including co-flow). The physical reason behind this observation is increased entrainment in wind, in which higher turbulent mixing between hydrogen and air leads to faster mixing, dilution, and dispersion. The counter-flow case has numerical and visualization limitations in HyRAM+ because the high wind speed seemingly causes the momentum of the plume to stop at certain y-distance from the release point.
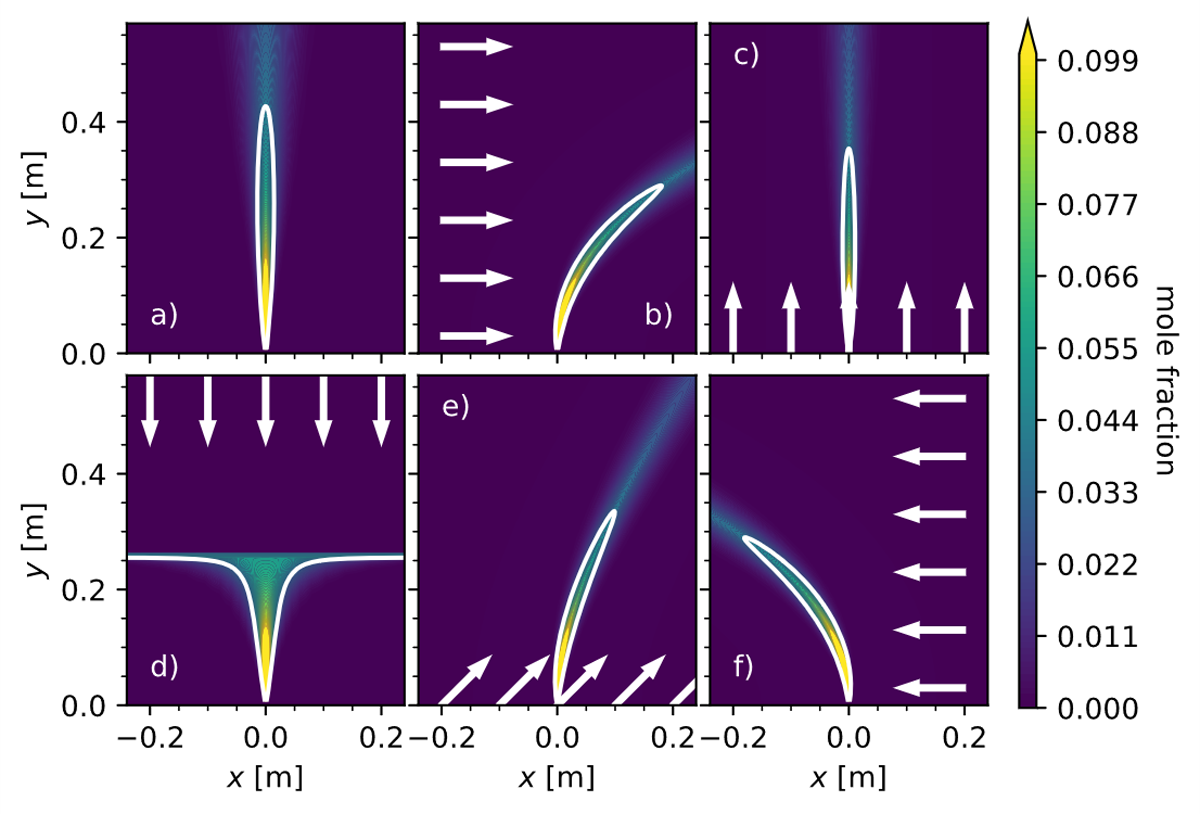
Figure 6
Hydrogen mole fraction in air contours using the HyRAM+ plume model with wind modifications, for hydrogen stored at 0.3 MPa (43 psi) and 25°C (77°F) and released vertically through a 1 mm orifice, subject to a) no wind, b) 10 m/s wind at 0°, c) 10 m/s at 90°, d) 10 m/s at –90°, e) 10 m/s at 45°, and f) 10 m/s at 180°. White boundary lines correspond to 0.04 hydrogen mole fraction.
In order to better illustrate the plume behavior in a counter-flow scenario, Figure 7 shows the entrainment behavior of a vertically released plume encountering different counter-flowing winds. Figure 7a shows that, without wind, the majority of plume entrainment is from momentum, with a small contribution from buoyancy near the end of the plume where the velocity drops to a very low value. In Figure 7b, entrainment with 1 m/s counter-flowing wind is similar to that without wind, with a nearly steady additional wind driven entrainment term. Buoyancy-driven entrainment is a little larger than without wind at the end of the plume, and the entire plume is shorter. Entrainment in the 5 m/s counter-flowing wind, shown in Figure 7c, is similar to the 1 m/s wind in Figure 7b up until the purple vertical dashed line at approximately 0.4 m. The purple vertical line in the figure is the point at which momentum and buoyancy entrainment are limited in the HyRAM+ model, as discussed by Ehrhart et al. (2023). Past this point, entrainment labeled as ‘quiescent’ is entrainment not caused by wind (replacing the separate buoyancy and momentum driven entrainment terms), proportional to the product of the halfwidth and the centerline velocity (see Eq. 86 in Ehrhart et al., 2023). The quiescent entrainment drops steadily (because it is proportional to the velocity), reaching a minimum where the velocity drops nearly to 0 while the halfwidth and wind driven entrainment increase. Quiescent entrainment remains steady, at a very low value for the remainder of the plume, while wind-driven entrainment continues to increase, the velocity continues to drop, and the halfwidth continues to grow. Doubling the wind to 10 m/s, as in Figure 7d, results in similar behavior to the 5 m/s wind in Figure 7c up until the point that the quiescent entrainment drops to its minimum value. In this case, quiescent entrainment drops all the way to zero, the plume wind driven entrainment and plume halfwidth grow much larger than with the 5 m/s wind, and the plume seems to simply diffuse horizontally (almost as though it has hit a ceiling, as also shown in Figure 6d). Numerically, increasing entrainment to too high a value can decrease the mole fraction of hydrogen to an unrealistic value below zero, if the step size in the integral model is too large. Some sort of limitation on wind driven entrainment or alternative way of visualizing the end of the plume may be needed, for the high-wind scenario so that the mole fraction contours can close and provide a more physical representation of the scenario. Although the Figure 6d depiction of the plume behavior in a counter-flowing wind may be unrealistic, Figure 7 shows that the model results seem to behave intuitively up to the point where the force of the wind balances the force of the plume (slightly past 0.2 m). The model or visualization of the model results seem to be limited past this point. The reasonable agreement of the modified plume model with the Grüne et al. (2021) data shown in Figure 4 also indicates that the new model is a fair predictor of plume behavior, even if the accuracy and visualization may be challenged for some conditions with high wind speeds.
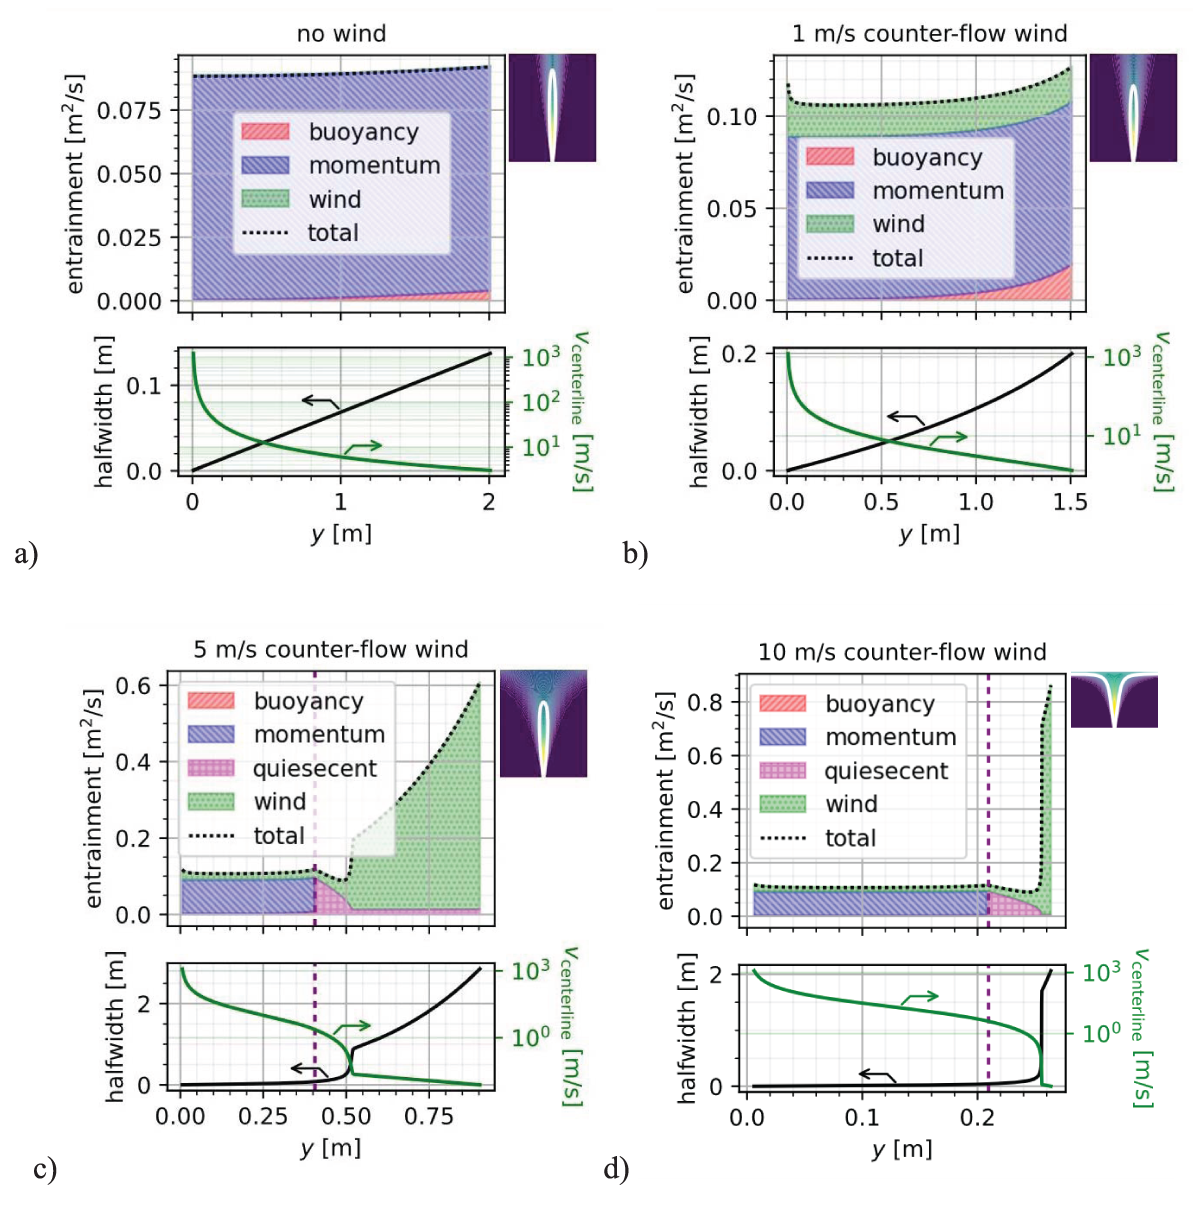
Figure 7
HyRAM+ wind entrainment model behavior for vertically counter-flowing wind for a vertically upward release with a) no wind b) 1 m/s, c) 5 m/s, and d) 10 m/s. The dashed purple vertical line designates the point at which momentum and buoyancy entrainment are limited in the HyRAM+ model.
4 Conclusions
Two physical phenomena relevant to hydrogen safety assessments were studied: hydrogen releases through a vent stack and wind effects on hydrogen plume dispersion. A vent stack model is proposed that assumes steady-state flow between a flow restriction (PRD) and the outlet of a vent stack. Flammable plumes from increasing vent stack diameters increased in length and diameter, even with an associated decrease in velocity. The predicted plume shapes vary distinctively based on the flow regime (choked vs. unchoked) and densimetric Froude number. The model predicts that, within each flow regime, increasing diameter and decreasing hydrogen exit velocity or pressure can lead to lower entrainment, mixing, and dilution of hydrogen in air at a given distance from the vent stack exit, but further experimental work or validation with literature may be necessary to verify the observed trends. This underscores that reduced-order plume models can be highly sensitive to how the release state at the stack exit and to regime changes that occur as the stack diameter varies. From a safety-assessment standpoint, this means that a vent stack sizing decision based on ‘larger diameter reduces hazard’ intuition may not be true, or that the physical results are not reliably captured by the present modeling approach.
A wind effect model was developed that modifies the vertical and horizontal momentum effects and increases entrainment along with the subsequent for greater hydrogen-air mixing. This model considers a wind that is steady-state in both direction and speed. The base model in HyRAM+ on which this model was built is a steady-state model that generates average mole fraction and velocity fields; more complex scenarios with variability in wind or release rate, or where intermittency or peak values in turbulent plume releases are needed would require an alternative modeling approach. A risk assessment using this model could include running the model multiple times with variations in parameters (e.g., wind direction, speed, hydrogen release rate), which can highlight sensitivities and result in a distribution of risk. The entrainment model specifically may be fuel-dependent; different fuels and their associated characteristics (e.g., buoyancy, diffusivity) might behave differently in a plume. A generic entrainment model was fitted to experimental data from hydrogen releases in a wind tunnel. Performing simulations using a model with coefficients fitted for hydrogen for several scenarios showed that increased wind bends the plume in the direction of the wind while shortening the flammable extent along the streamline. Plume bending is caused by the wind momentum while decreasing flammable extent is caused by increased entrainment, turbulent mixing, and dilution by air at higher wind speeds. Some visualizations of plumes in the presence of wind were unintuitive or perhaps non-physical, specifically, a vertically discharged jet with counter-flowing wind. The model results seem to behave intuitively up to the point where the force of the wind balances the force of the plume. The model and visualization of results seem to be limited past this point, suggesting that additional modeling physics or guardrails may be needed for certain scenarios. The behaviors of plumes for other scenarios (various jet and wind directions and speeds) appeared to follow expected behaviors.
Overall, the work supports the value of incorporating regime-aware discharge calculations and wind-enhanced entrainment into existing models as a step toward more realistic, accessible hydrogen dispersion estimates. While some literature was found for both physical phenomena, little quantitative experimental data was available for validation of the vent stack or wind models. Additional experimental validation (e.g., with higher hydrogen mass flow rates, larger vent stack diameters, additional wind directions and speeds) is crucial to model refinement and can help further research to enable hydrogen systems for numerous applications and their associated safety standards and protocols.
Acknowledgements
The authors are thankful to Joachim Grüne for providing experimental data. The authors also wish to thank Marina Miletic, Chris LaFleur, and Kristin Hertz of Sandia National Laboratories for their review of this work.
Author Contributions
Melissa Louie led the vent stack analysis and manuscript writing and supported the wind modeling analysis. Ethan Hecht led the development of the jet plume models experiencing wind impacts, and implementation of the models in Python. Brian Ehrhart managed the project and provided feedback to inform the direction of the studies. All authors contributed to writing and revision of the manuscript.