
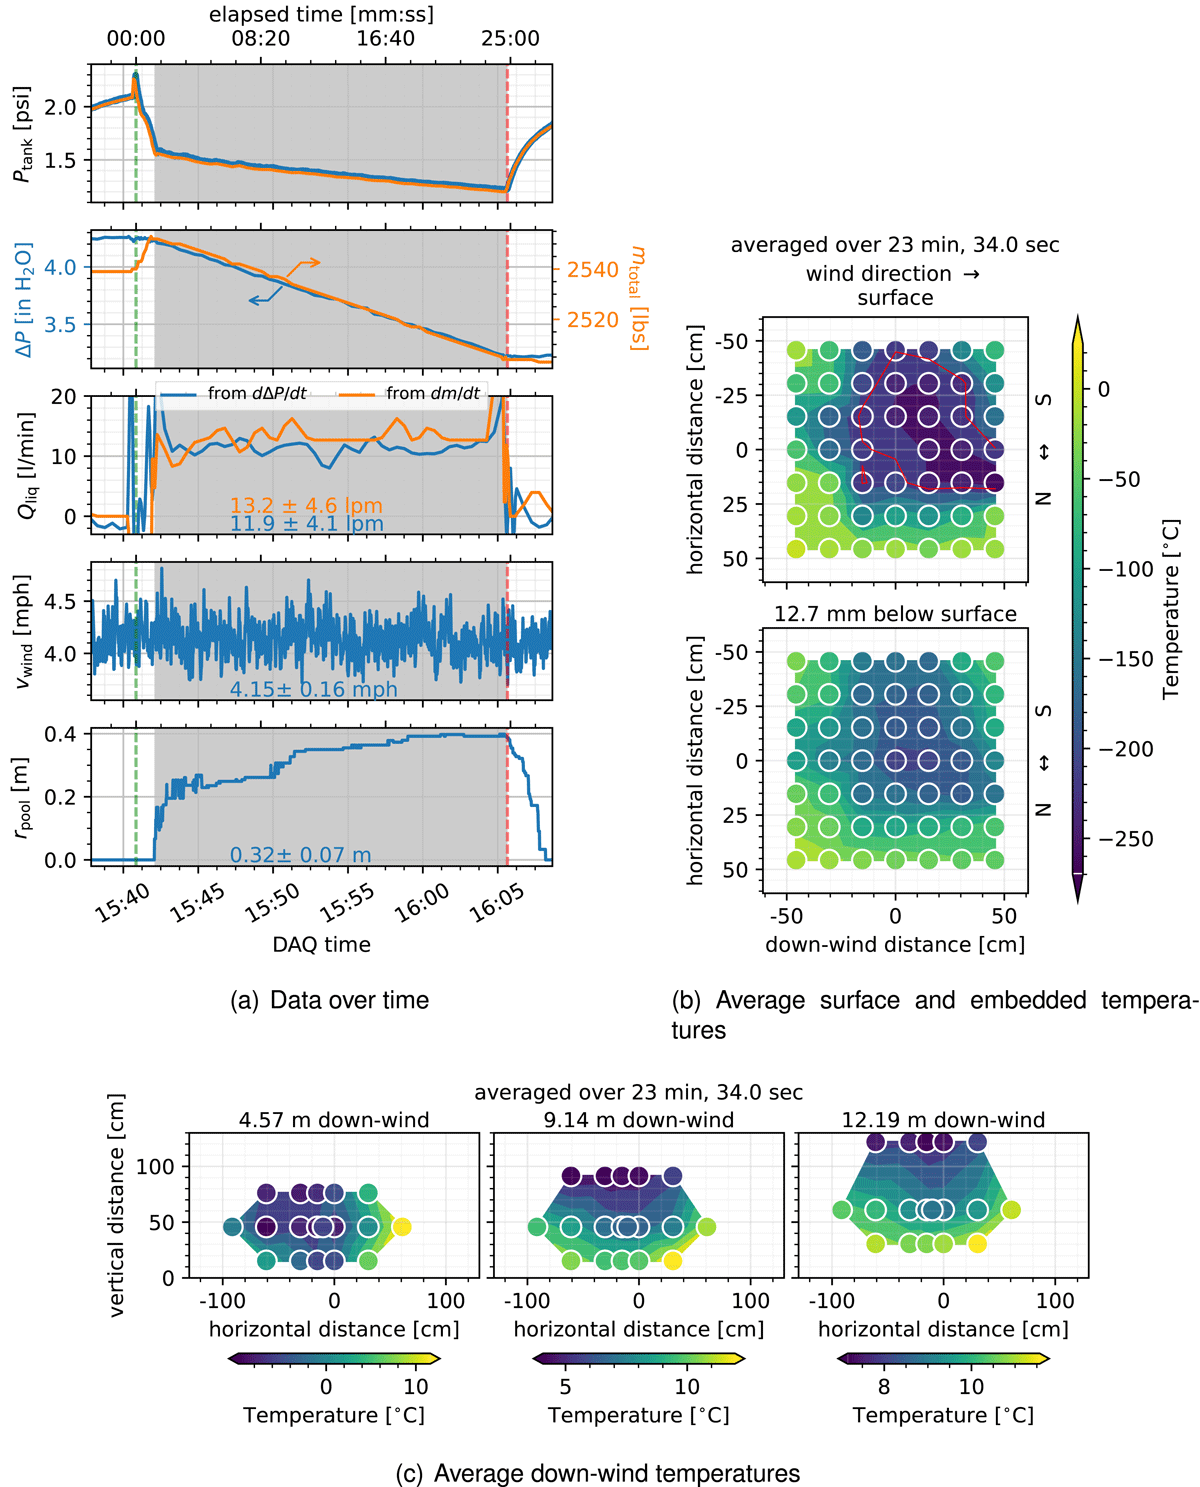
Figure 1
Experimental results for a 12.5 lpm release of LH2 onto concrete with a 4 mph cross-wind.
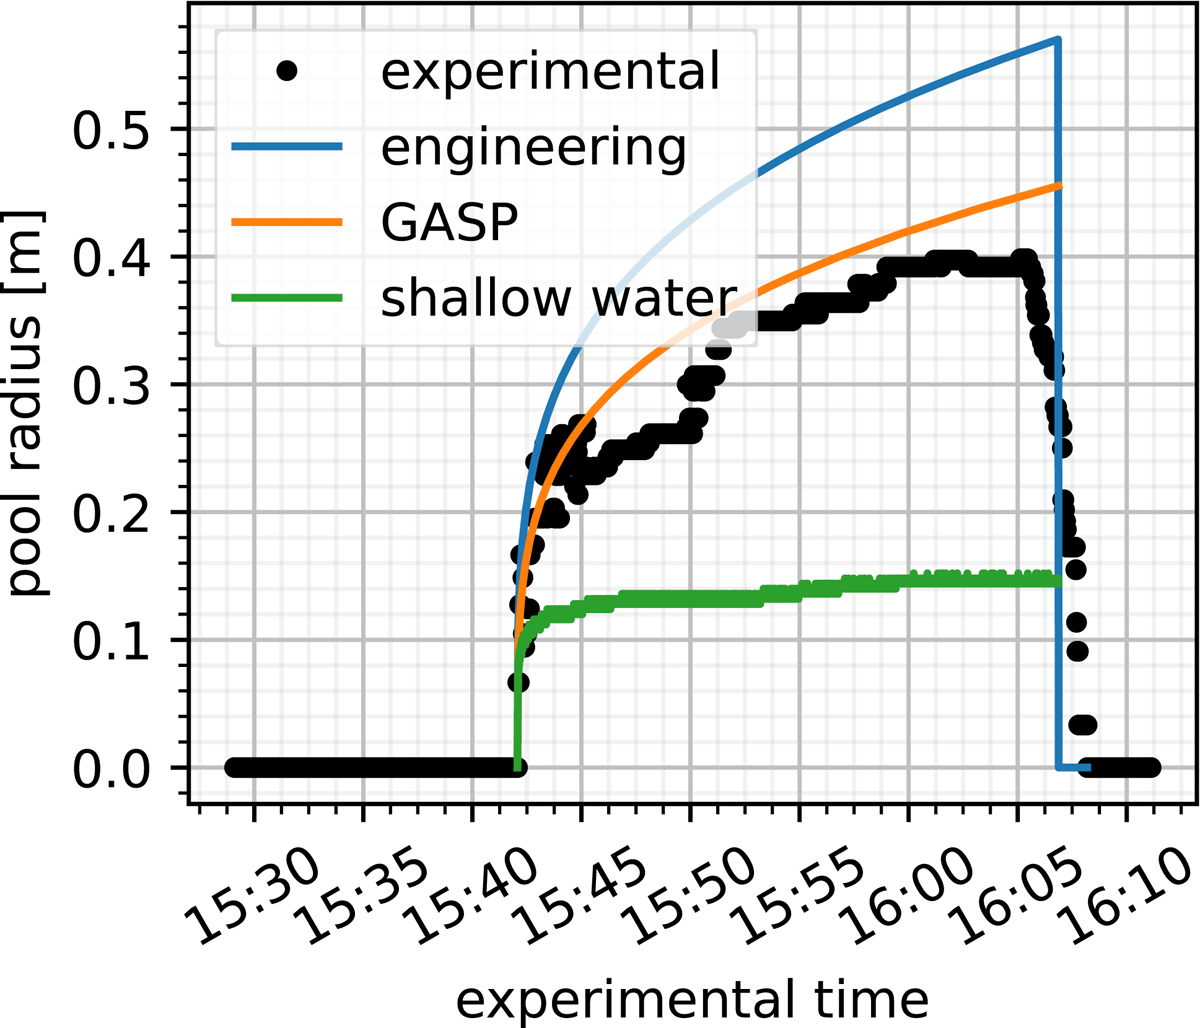
Figure 2
Experimental data of pool radius for the test shown in Figure 1 (12.5 lpm liquid hydrogen flow) compared to the different pooling models for concrete with properties of k = 1.4 W/m-K, α = 6.9 × 10⁻⁷ m2/s.
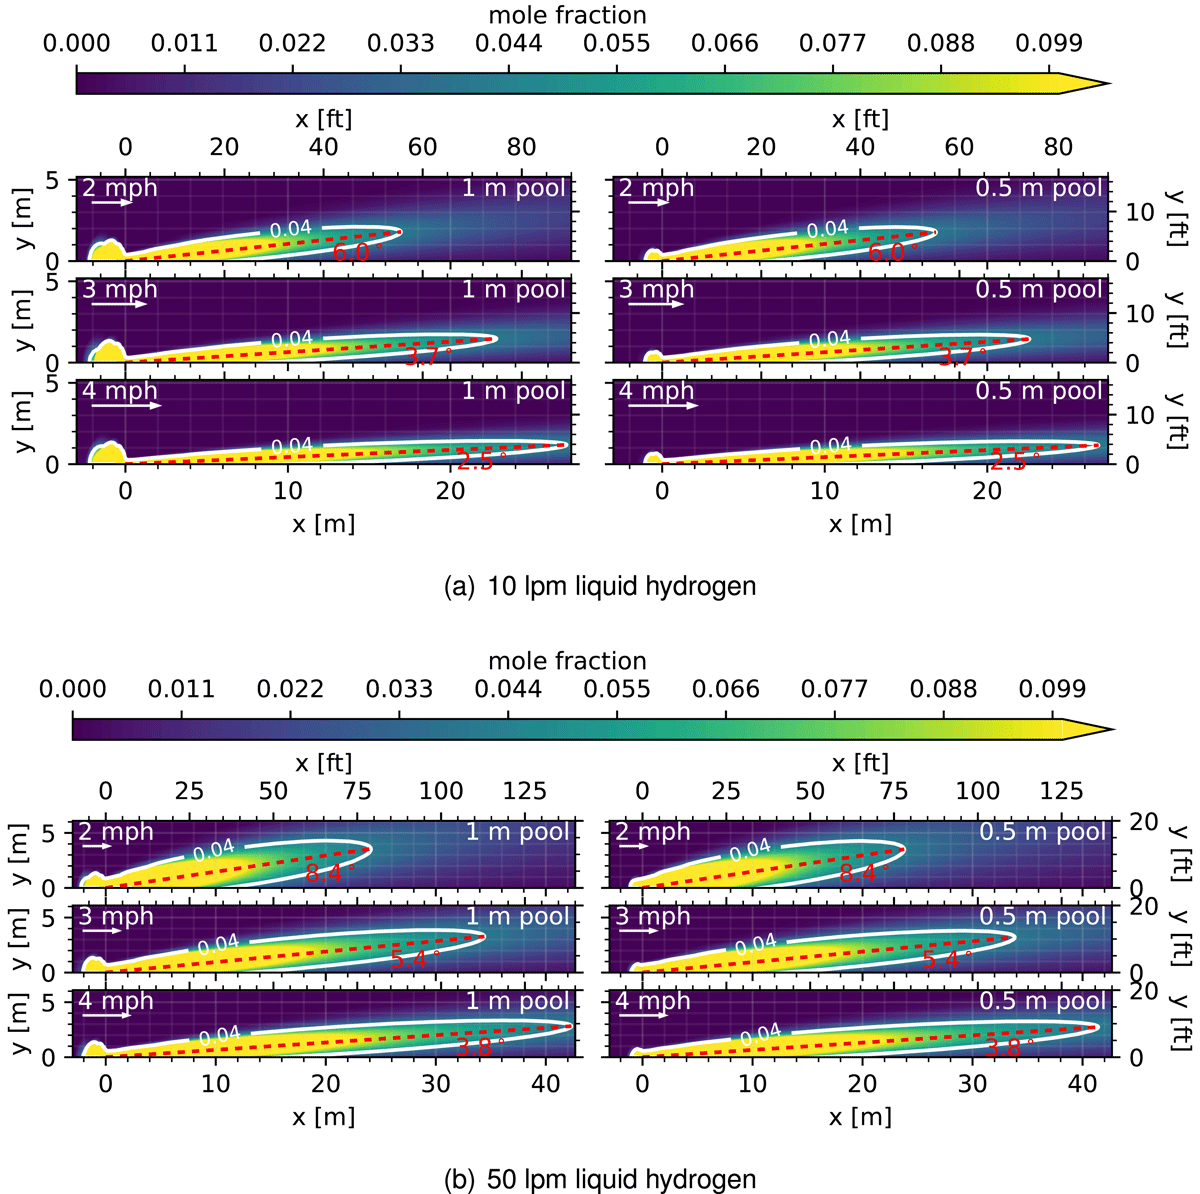
Figure 3
HyRAM+ dispersion model with variations in wind speed (rows) and source pool diameter (columns).
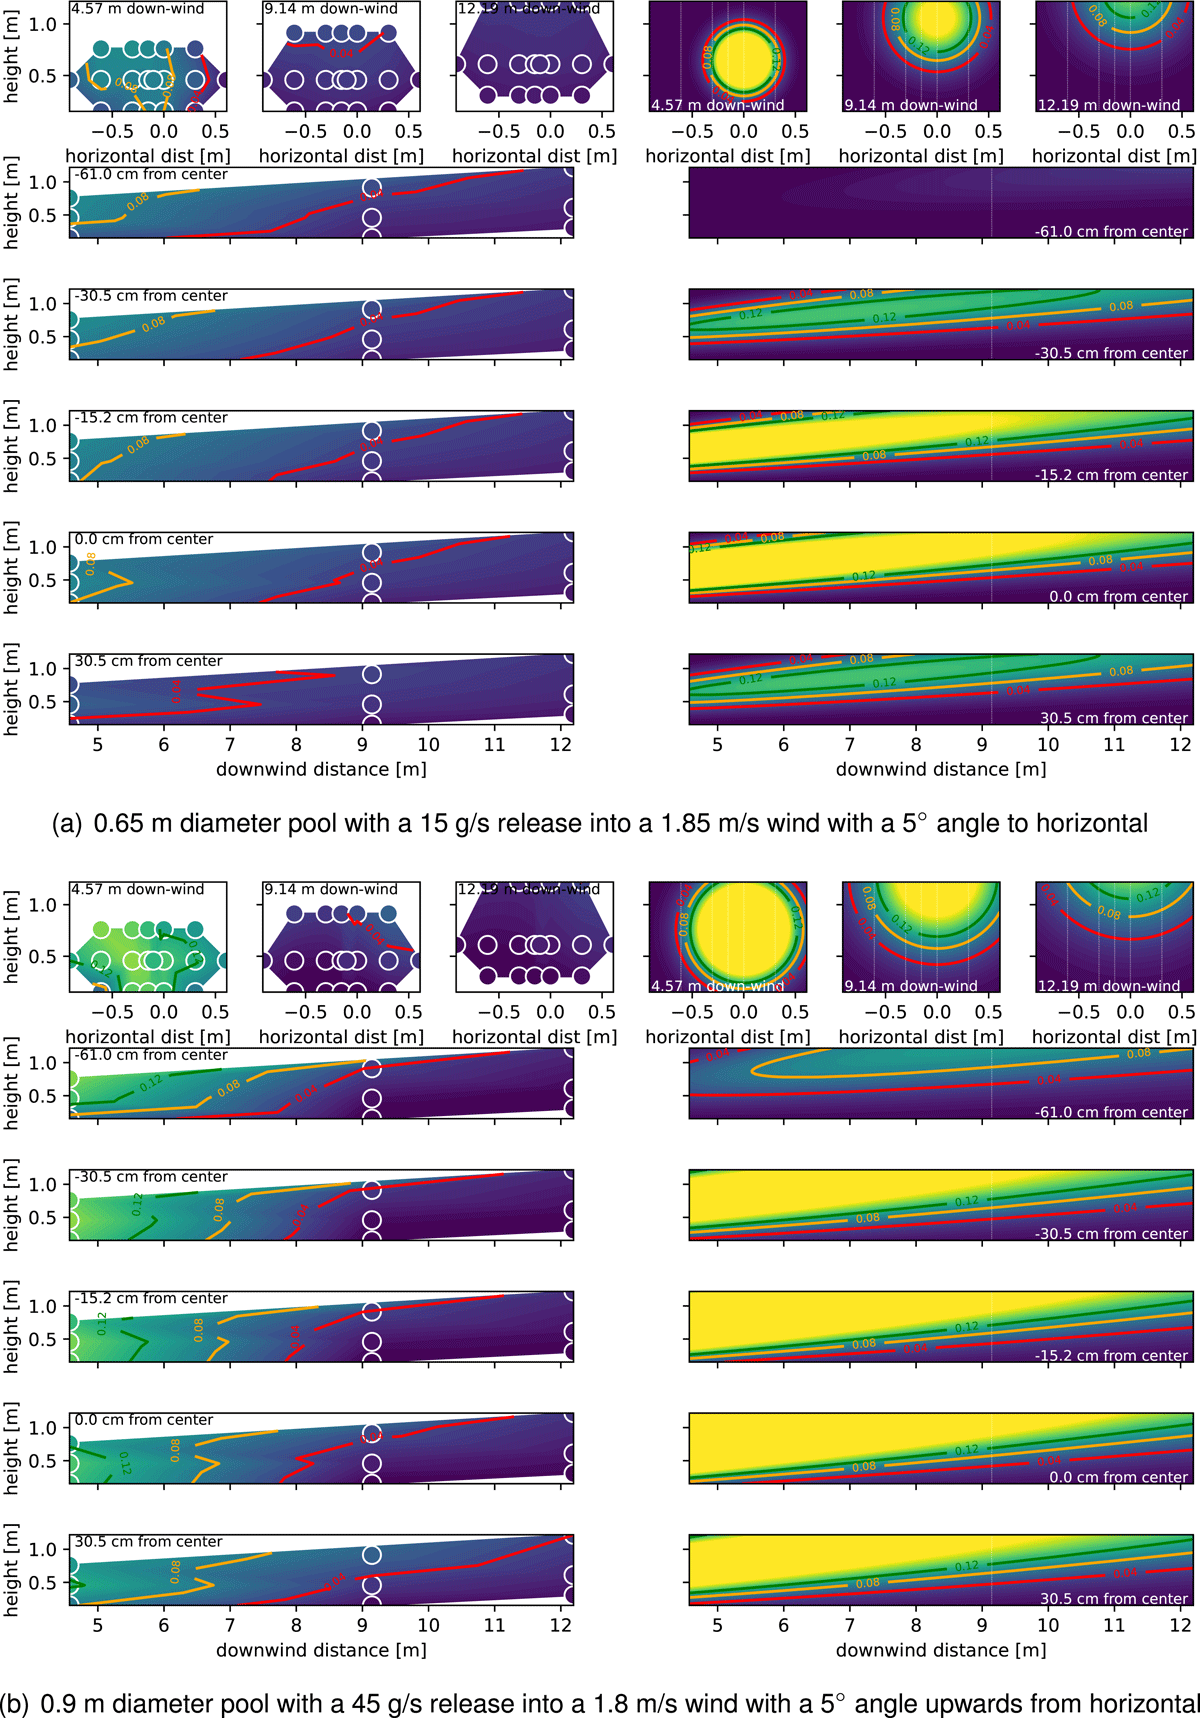
Figure 4
Experimental data (left) compared to HyRAM+ dispersion model (right) for two different conditions. Top row contains slices in the downwind direction and bottom 5 frames are the same data, but sliced in the horizontal direction.
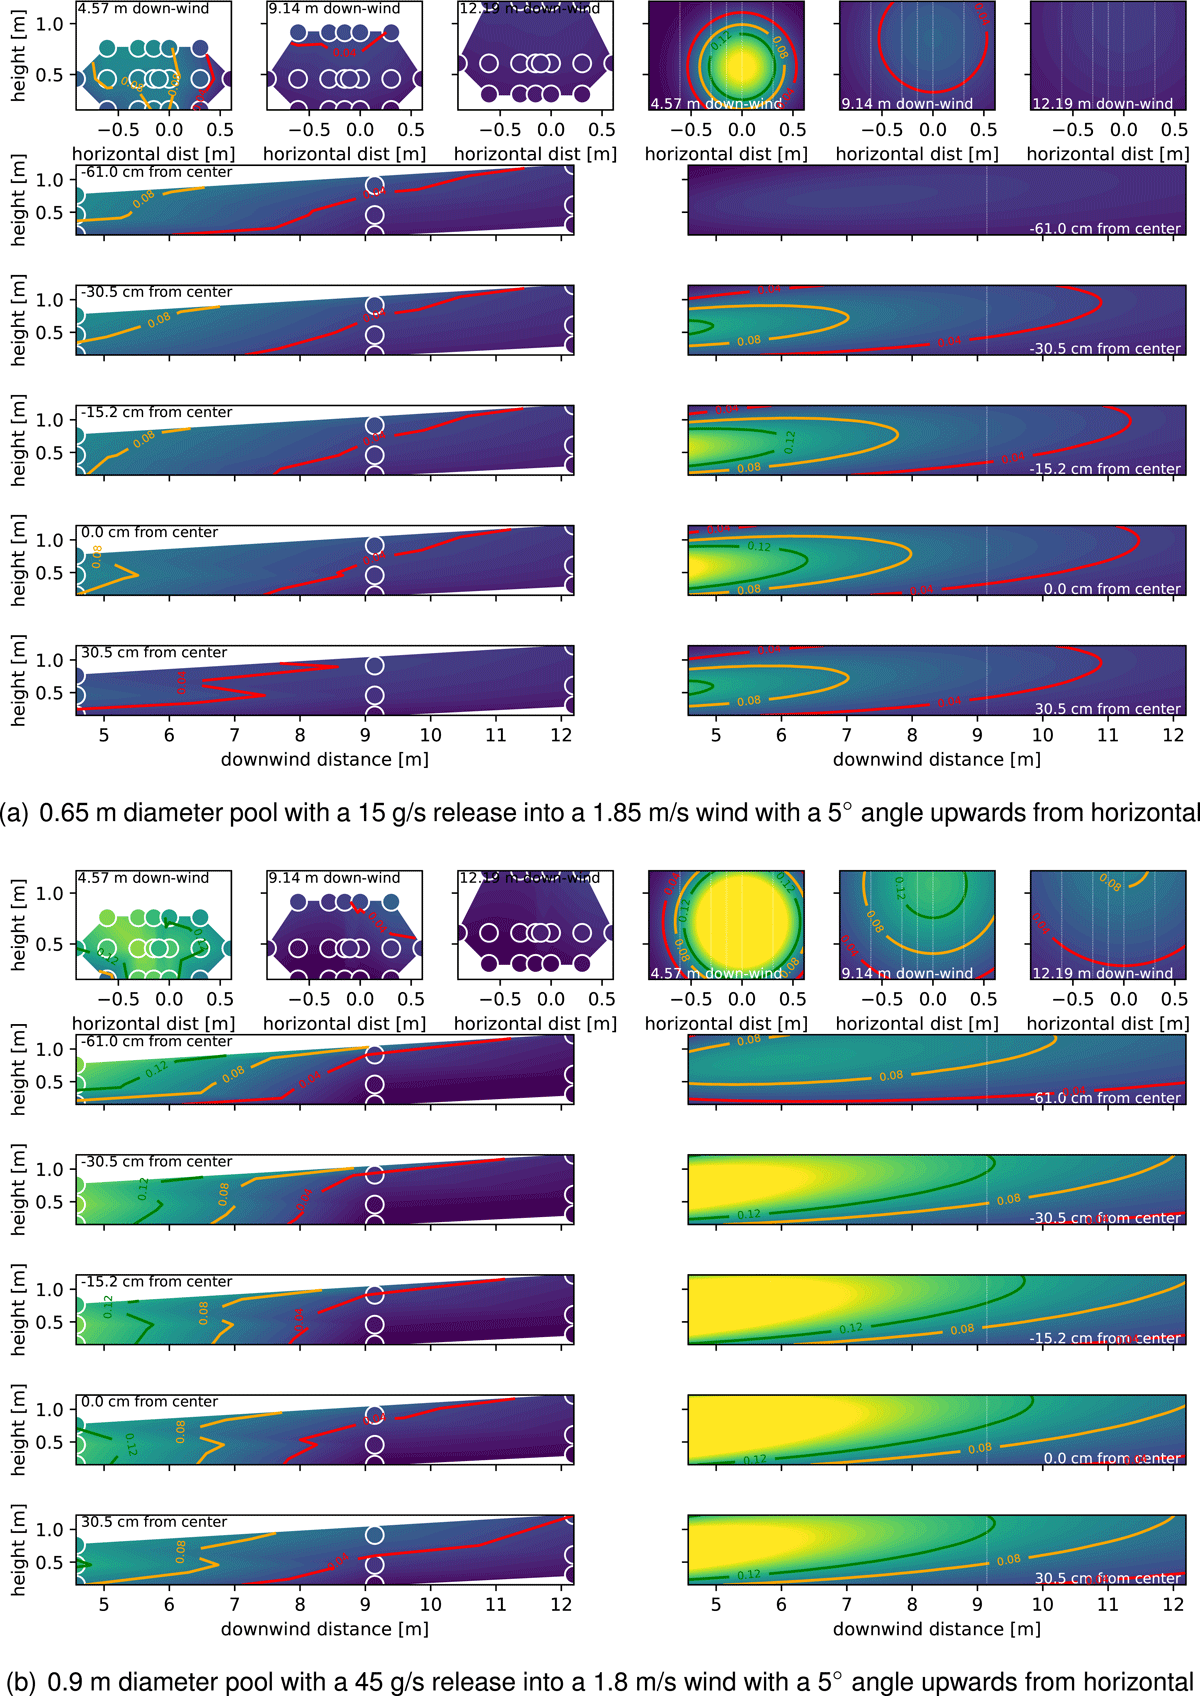
Figure 5
Experimental data (left) compared to HyRAM+ dispersion model (right) for two different conditions, with entrainment coefficients changed to and . Top row contains slices in the downwind direction and bottom 5 frames are the same data, but sliced in the horizontal direction.