
1.0 Introduction
Any transition to hydrogen energy brings with it a set of engineering challenges that need to be overcome to realise a safe and efficient energy transition. The properties of hydrogen are much studied and often compared to those of methane or natural gas: it has a lower density, higher energy content per unit mass, lower energy content per unit volume, increased reactivity and lower minimum ignition energy. Quantification of risk requires the prediction of the physical and chemical processes by which hydrogen can escape from containment, mix with air and accumulate in flammable volumes, ignite, explode and then combust. Two elements of this quantification can only be dealt with in a probabilistic fashion: the failure of containment and the ignition. Failure of pressurised containment is well understood for both hydrocarbons and hydrogen in existing usage; where hydrogen research is currently focused is in scenarios where the usage of hydrogen is likely to be different to that of current industrial processes today—for example, re-purposing of natural gas assets (Green, Mitchell and Adams, 2021) or high-pressure transportation applications (Barthélémy et al., 2021).
Ignition of hydrocarbons is well understood in both mechanism and probability—that is, the likelihood of ignition can simply be determined by interrogation of the decades of incident data collected from hydrocarbon installations. The likelihood of ignition can be shown to increase with the size of any release, and models exist to allow some quantification of ignition probability based on flammable sources and facility make-up (e.g., Lloyd’s Register Consulting, 2018). Ignition modelling for hydrogen facilities is a topic of current research where, for example, the SAFEN project (Fossan et al., 2024) attempts to modify existing hydrocarbon models for application to hydrogen. It is impossible to fully test these modified models against a case history, as the incidents have simply not happened in enough numbers to allow statistically significant validation to be performed.
The increased reactivity of hydrogen compared to the fuels that it is tasked to replace means that the consequences of any ignition have the potential to be greater than those posed by similar events with the incumbent fuel. Significant explosions have been reported in the literature from delayed ignition of real hydrogen releases (Jallais et al., 2018), and the mechanisms of the flame acceleration, transition to detonation and overpressure generation are topics of significant current research (Crewe, 2024).
This paper will present the experience of the researchers at DNV’s Spadeadam Research Centre in the UK in relation to the ignition of gaseous hydrogen in experiments ranging from small to large scale. Whilst a limited amount of data was available relating to liquid hydrogen experiments (Allason et al., 2021), this was not deemed extensive enough for any meaningful statistical analysis.
2.0 Ignition Mechanisms
Many excellent reviews of ignition mechanisms exist in the literature already (see Astbury and Hawksworth (2007) and the SAFEN project literature review (Safetec, 2023)). Broadly, these ignition mechanisms can be broken down into three categories: hot surfaces/flames, electric/electrostatic sparks, and adiabatic compression or shock waves. Each category has several sub-categories of mechanisms, and the likelihood of all needs to be understood if the probability of ignition is to be predicted for any given release.
For ignition to occur, a mechanism of ignition needs to be present, with sufficient energy, in the same location as a flammable mixture of fuel and air. Ignition probability, therefore, is also subject to temporal and geometric factors.
The experimental results examined in this paper are analysed for their release rate, type of release and whether ignition occurred or not. Where experiments were confined and hydrogen was allowed to accumulate within enclosures or buildings, the maximum concentration achieved is also recorded. As such, comparisons are made against the bulk ignition probability, and examination of the ignition mechanism, location or time is not conducted.
3.0 Ignition Probability Models
The SAFEN has proposed a refined hydrogen ignition probability model in Fossan et al.’s (2024) work, which refines the broader earlier efforts by others (e.g. HyRAM (Ehrhart, Hecht and Schroeder, 2023) and HYEX (Aarskog et al., 2020). The more complex model proposed by SAFEN includes factors to predict the ignition probability for releases from a particular facility based on elements like facility layout, presence of different equipment types, inventory and ignition delay. Testing of the refined model is difficult in that there is very little by way of real-world data on the release and ignition of hydrogen. This paper does not attempt to replicate the SAFEN ignition model but will make use of the simpler HyRAM and HYEX models described in the SAFEN literature review (Safetec, 2023) to attempt to put the experimental data into context. Separate guidance provided in the UKOOA (Energy Institute, 2006) gives two other ignition probability trends for large- and small-scale plants, respectively. The UKOAA model is mainly based on hydrocarbons, and the report recommends doubling the ignition probability for gases with lower ignition energies, such as hydrogen and acetylene. For a given scenario, that is, a combination of leak orifice area and pressure, the mass flow rate of hydrogen is typically around one-third of that for natural gas. Hence, even doubling the ignition probability still results in predicted ignition probabilities that are similar for hydrogen and natural gas, for the same scenario. Some people account for this by converting a hydrogen release to a natural gas release with the same volumetric flow rate, to account for the lower density of hydrogen, then by using double the UKOAA lookup table values for that natural gas flow rate, to account for the lower ignition energy of hydrogen. The figure below shows the curves with the simple doubling using an equivalent volumetric flow rate in addition to doubling, for two UKOAA example curves, ‘Onshore Large Plant – Gas/LPG’ and ‘Onshore Small Plant – Gas/LPG’.
The three ignition probability models are well described in other documents and have been plotted below in Figure 1. All models assume a compound probability of ignition for all ignition mechanisms, and where they might split the probability into that of immediate and delayed, this has been summed to give an overall ignition probability across all ignition mechanisms, regardless of ignition timing.
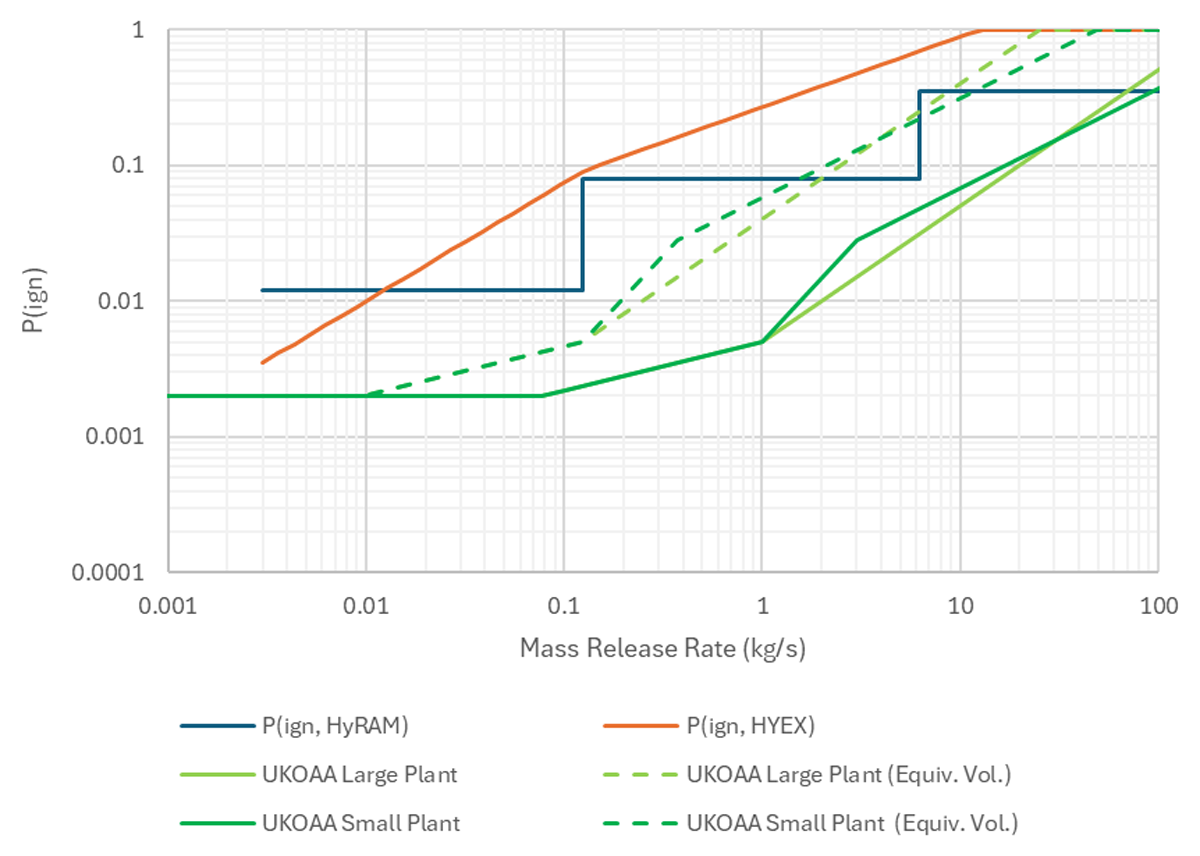
Figure 1
Simple ignition probability models (HyRAM and HYEX, reproduced from Ehrhart, Hecht and Schroeder (2023) and Aarskog et al. (2020) respectively, UKOOA from Energy Institute (2006)).
4.0 Project References
A total of 1,336 experimental releases across 21 project work packages, spanning more than 20 years, have been included in this analysis. Other experimental data was deemed unavailable due to confidentiality requirements or lack of detailed documentation.
All experiments were conducted at the DNV Spadeadam Research Centre in Cumbria, UK. The centre has a long history of major hazards research dating back to the 1970s when it was first established by British Gas. The earliest experimental work dates back to some hydrogen filling station research experiments conducted on behalf of Osaka Gas (Tanaka et al., 2007).
Each experiment was categorised for the type of release as either being ‘Unburied’, ‘Buried’ or ‘Accumulating’. Unburied releases were from the pipework where the release point was deemed to have had a direct path-to-atmosphere (but may have still been below ground in an excavation). Buried releases were where the release point was buried in either sand or soil or clay. Accumulating releases were releases that were directly or indirectly into a confined area (room, house, chamber, pipe or enclosure). Typically, Accumulating releases were either conducted to investigate the dispersion and accumulation of hydrogen within a confined area or to deliberately develop a hydrogen-air atmosphere ahead of an explosion experiment or demonstration. These types of releases may have had a direct release into the confined space, or the hydrogen may have been injected into a recirculation system before entry into the confined space. A summary of the cases included is given in Table 1.
Table 1
Summary of experimental programmes.
| PROJECT REFERENCE | NO. RELEASES | NON-DELIBERATE IGNITION | RELEASE TYPE (NON-DELIBERATE IGNITIONS) | ||
|---|---|---|---|---|---|
| UNBURIED | BURIED | ACCUMULATING | |||
| H21 WBS1 (Northern Gas Networks, 2021) | 136 | 0 | 0 | 112 | 24 |
| H21 WBS2 (Northern Gas Networks, 2021) | 85 | 2 | 53 | 32 (2) | 0 |
| H21 WBS3 (Northern Gas Networks, 2021) | 73 | 0 | 73 | 0 | 0 |
| H21 WBS4 (Northern Gas Networks, 2021) | 38 | 0 | 0 | 0 | 38 |
| H21 WBS5 (Northern Gas Networks, 2021) | 8 | 1 | 2 | 6 (1) | 0 |
| H21 2a Vents and Purges (Northern Gas Networks, 2023) | 5 | 0 | 3 | 0 | 2 |
| Hy4Heat WP7 Lot2 (DNV, 2020a) | 40 | 0 | 0 | 0 | 40 |
| Hy4Heat WP7 Lot3 (DNV, 2020b) | 53 | 0 | 0 | 0 | 53 |
| Hy4Heat WP7 Lot4 (DNV, 2020c) | 44 | 0 | 0 | 0 | 44 |
| FutureGrid Ruptures (National Grid Transmission, 2024) | 5 | 2 | 5 (2) | 0 | 0 |
| HAC H2 Detonation1 | 633 | 0 | 0 | 0 | 633 |
| Explosion Chamber General2 | 38 | 0 | 0 | 0 | 38 |
| NIA344 (Energy Networks Association, 2023) | 63 | 0 | 0 | 0 | 63 |
| Air Products Jets (Rian, 2019) | 3 | 0 | 3 | 0 | 0 |
| CostFX Jets (Crewe, 2024) | 37 | 0 | 37 | 0 | 0 |
| CostFX Quiescent (Crewe, 2024) | 5 | 0 | 0 | 0 | 5 |
| Osaka Gas Accumulation (Tanaka et al., 2007) | 27 | 0 | 0 | 0 | 27 |
| Osaka Gas Transient Dispersion (Tanaka et al., 2007) | 13 | 0 | 6 | 0 | 7 |
| Osaka Gas Transient Explosion (Tanaka et al., 2007) | 7 | 0 | 6 | 0 | 1 |
| Osaka Gas Homogeneous Explosion (Tanaka et al., 2007) | 3 | 0 | 0 | 0 | 3 |
| Osaka Gas Ph1 Explosions (Tanaka et al., 2007) | 20 | 0 | 0 | 0 | 20 |
| Totals | 1336 | 5 | 188 | 150 | 998 |
[i] 115.6 m3 detonation demonstration conducted approximately 1.5 times per week for 422 weeks to date.
211 m3 hydrogen confined, vented explosion chamber used for various clients and applications.
5.0 Analysis
To interrogate the 1,136 experiments included in the collated data for insight into ignition likelihood, it is pertinent to consider experiments where ignition was not deliberately initiated—termed herein ‘Non-deliberate ignition’. These are experiments where an ignition occurred that was not initiated by the engineers or scientists conducting the experiment. Many of the experiments included in the set were eventually ignited as part of the experimental procedure, either by electric spark, electro-chemical fuse, incendiary firework or high explosives. The period of time prior to the deliberate initiation is included as a non-ignition case—the period may range from a few seconds to several hours.
A total of five non-deliberate ignition events have been identified amongst 1,336 hydrogen release experiments.
For all cases, a mass flow rate has been established either from the measured outflow during the experiment, or by estimation where the outflow rate is unknown. These mass flow rates are then placed in the order-of-magnitude flow rate categories commonly used in ignition probability models as discussed earlier. For example, the 633 hydrogen detonation demonstrations are filled from a multi-cylinder hydrogen pack through a pressure regulator at a flow rate of considerably less than 1 g.s–1.
Similarly, it was possible to classify all of the ‘Accumulating’ experiments by the maximum concentration in the experiment. For this, the experiments were placed into concentration groups nominally representing the non-flammable, flammable but low reactivity, high reactivity/fuel lean, high reactivity/fuel rich and then the 50+ %vol category. The accumulation experiments covered a wide range of enclosure sizes and ventilation regimes, from low ventilation/high volume in domestic buildings to high ventilation/low volume in the case of ventilated enclosures from gas distribution facilities. Ultimately, no non-deliberate ignition events occurred in any of the accumulation experiments but the categorisation serves to illustrate that all concentration ranges were well represented.
It is worth noting that experiments at a large scale will typically involve the presence of some non-ATEX equipment on the premise that the aim of the experiment is to study a fire or explosion so that deliberate ignition is already accounted for in safety procedures. Low-voltage oxygen depletion sensors, thermocouples and dynamic piezoelectric pressure sensors are examples of equipment often present in experiments. In the case of the accumulating experiments in the research houses at Spadeadam in H21 (Northern Gas Networks, 2023) and Hy4Heat (DNV, 2020a; DNV, 2020b), the mains electric was isolated and all domestic pipework was earthed as per normal installation regulations.
Table 2 breaks down the 1,136 experiments by various categories. Where broken down by release rate, it is apparent that the number of non-deliberate ignition events as a proportion of the number of experiments increases with the rate of release. This ratio is plotted against the HyRAM, HYEX and UKOOA (small plant) ignition models discussed earlier in Figure 2, where the cumulative ignition probability is plotted against the mid-point of the flow rate band on the logarithmic scaling. Error bars plotted alongside the experiment data are calculated as the binomial confidence limits for the calculated probability. It is apparent that the experimental data presents the same trend of increasing probability with flow rate, but at a significantly lower frequency than the HyRAM and HYEX models. The UKOOA model seems to best represent the data when the equivalent volumetric release rate correction is made. The 100% probability of ignition in the experimental data set for releases in the 10–100 kg.s-1 category is only determined from the one experiment at this flow rate in the data set. Further experimentation supporting this probability range is currently ongoing at this scale and updates will be forthcoming in the next few years after this publication.
Table 2
Breakdown of experiments by various properties.
| NO. RELEASES | NON-DELIBERATE IGNITION COUNT | RATIO | |||
|---|---|---|---|---|---|
| BY MASS RELEASE RATE BAND (kg/s) | |||||
| LOW | HIGH | ||||
| Mass Release Rate Band (kg/s) | 0 | 0.01 | 1172 | 1 | 0.1% |
| 0.01 | 0.1 | 55 | 0 | 0.0% | |
| 0.1 | 1 | 88 | 2 | 2.3% | |
| 1 | 10 | 20 | 1 | 5.0% | |
| 10 | 100 | 1 | 1 | 100.0% | |
| BY RELEASE TYPE | |||||
| Release Type | Unburied | 188 | 2 | 1.1% | |
| Buried | 150 | 3 | 2.0% | ||
| Accumulating | 998 | 0 | 0.0% | ||
| BY RELEASE TYPE AND MASS RELEASE RATE (kg/s) | |||||
| LOW | HIGH | ||||
| Unburied | 0 | 0.01 | 83 | 0 | 0.0% |
| 0.01 | 0.1 | 24 | 0 | 0.0% | |
| 0.1 | 1 | 60 | 0 | 0.0% | |
| 1 | 10 | 20 | 1 | 5.0% | |
| 10 | 100 | 1 | 1 | 100.0% | |
| Buried | 0 | 0.01 | 122 | 1 | 0.8% |
| 0.01 | 0.1 | 4 | 0 | 0.0% | |
| 0.1 | 1 | 24 | 2 | 8.3% | |
| 1 | 10 | 0 | 0 | – | |
| 10 | 100 | 0 | 0 | – | |
| Accumulating | 0 | 0.01 | 967 | 0 | 0.0% |
| 0.01 | 0.1 | 27 | 0 | 0.0% | |
| 0.1 | 1 | 4 | 0 | 0.0% | |
| 1 | 10 | 0 | 0 | – | |
| 10 | 100 | 0 | 0 | – | |
| BY MAXIMUM CONC. (%vol) | |||||
| LOW | HIGH | ||||
| Accumulating | 0% | 5% | 8 | 0 | 0.0% |
| 5% | 15% | 88 | 0 | 0.0% | |
| 15% | 30% | 193 | 0 | 0.0% | |
| 30% | 50% | 691 | 0 | 0.0% | |
| 50% | 100% | 18 | 0 | 0.0% | |
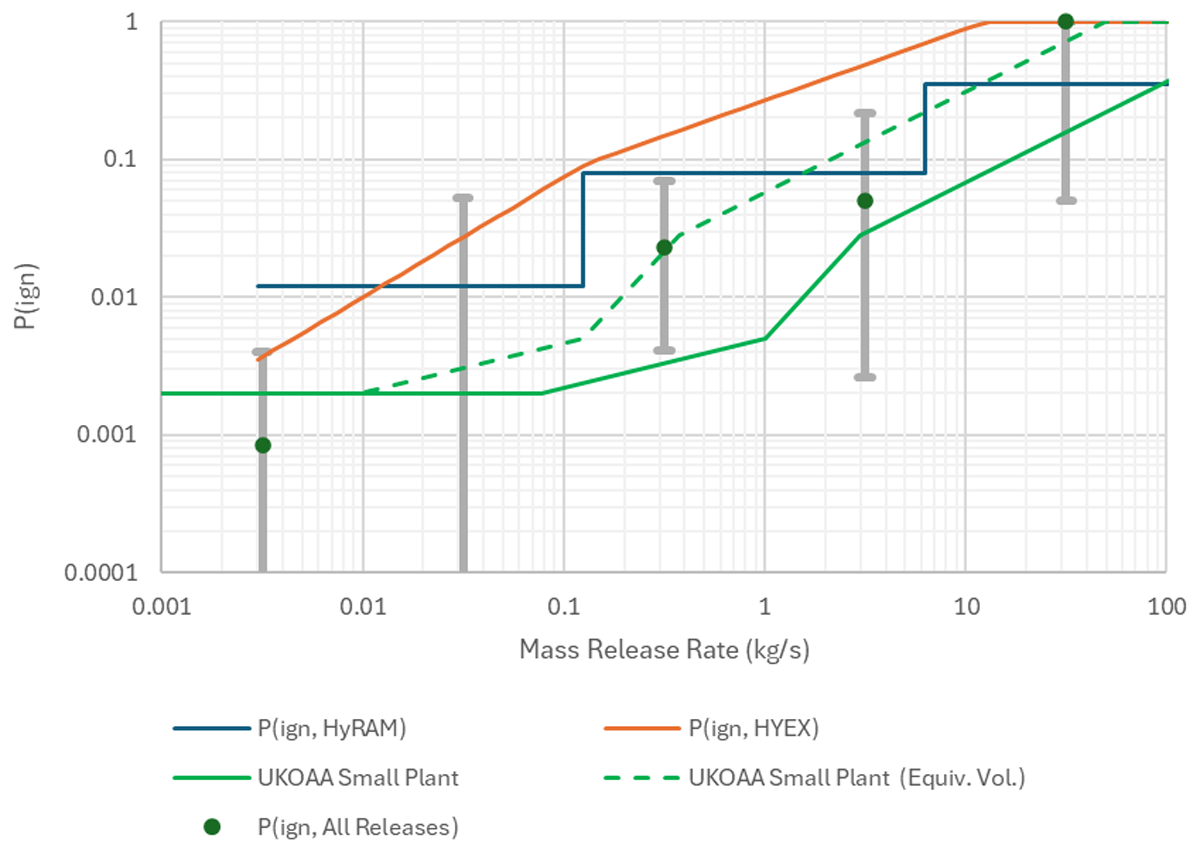
Figure 2
Non-deliberate ignition events by release rate against HyRAM, HYEX and UKOOA ignition models (The UKOAA large plant curves, which are similar to the small plant curves, have been omitted from the figure for clarity).
The breakdown of the experiments by type illustrates that all non-deliberate ignition events occurred in either buried or unburied releases, with none in the accumulating releases, which were predominantly all conducted with lower flow rates.
The non-deliberate ignition events in the unburied category were both at higher flow rates and during the pipeline rupture experiments in National Grid Transmission (2024). Both of these ignition events occurred at high outflow rates from 6” NB full-bore and double-ended releases, which were mechanically initiated either by the opening of an upstream valve or the hoop-stress failure of a partial wall thickness slot. The high outflow rates, pressures and the presence of moisture and dust would be sufficient to speculate with some confidence on either electrostatics or adiabatic compression as the ignition mechanism.
In the buried experiments, the three ignition events were at considerably lower flow rates than those in the unburied scenarios. Two of the experiments involved hydrogen leakage from a buried intermediate-pressure pipe in the H21 WBS2 ‘Large releases’ experiments (Northern Gas Networks, 2021). These experiments were conducted at a pressure of 7 barg and through a 70 mm and 20 mm hole in the side of a pipe buried under clay, soil and sand, respectively. Both experiments produced hydrogen jets with entrained soil or sand impacting steel supports holding non-ATEX oxygen depletion sensors. The ignition is speculated to have been due to electrostatics, given the lack of ignition events in other similar releases where the ground was less dry or the jet produced little or no dust entrainment. The final non-deliberate ignition event was also observed in the H21 project, in the WBS5 part entitled Operational Safety Testing. The ignition occurred whilst a remotely operated excavator was being used to clear away a broken-up road surface covering above a live hydrogen leak from a 10 mm diameter hole in the side of a 30 mbarg pipeline buried in clay and covered with a Type ‘A’ road surface (UK Government Department for Transport, 2020). The surface of the tarmac had already been broken using a hydraulic breaker attached to the remotely operated excavator (see Figure 3), and the ignition occurred after changing over to a toothless bucket for clearing the broken material. No other ignition events were observed in several other excavation activities in the programme. The ignition mechanism is speculated to have been by mechanical spark, given the diffuse nature of the migrating hydrogen and the mechanical activities underway at the time.
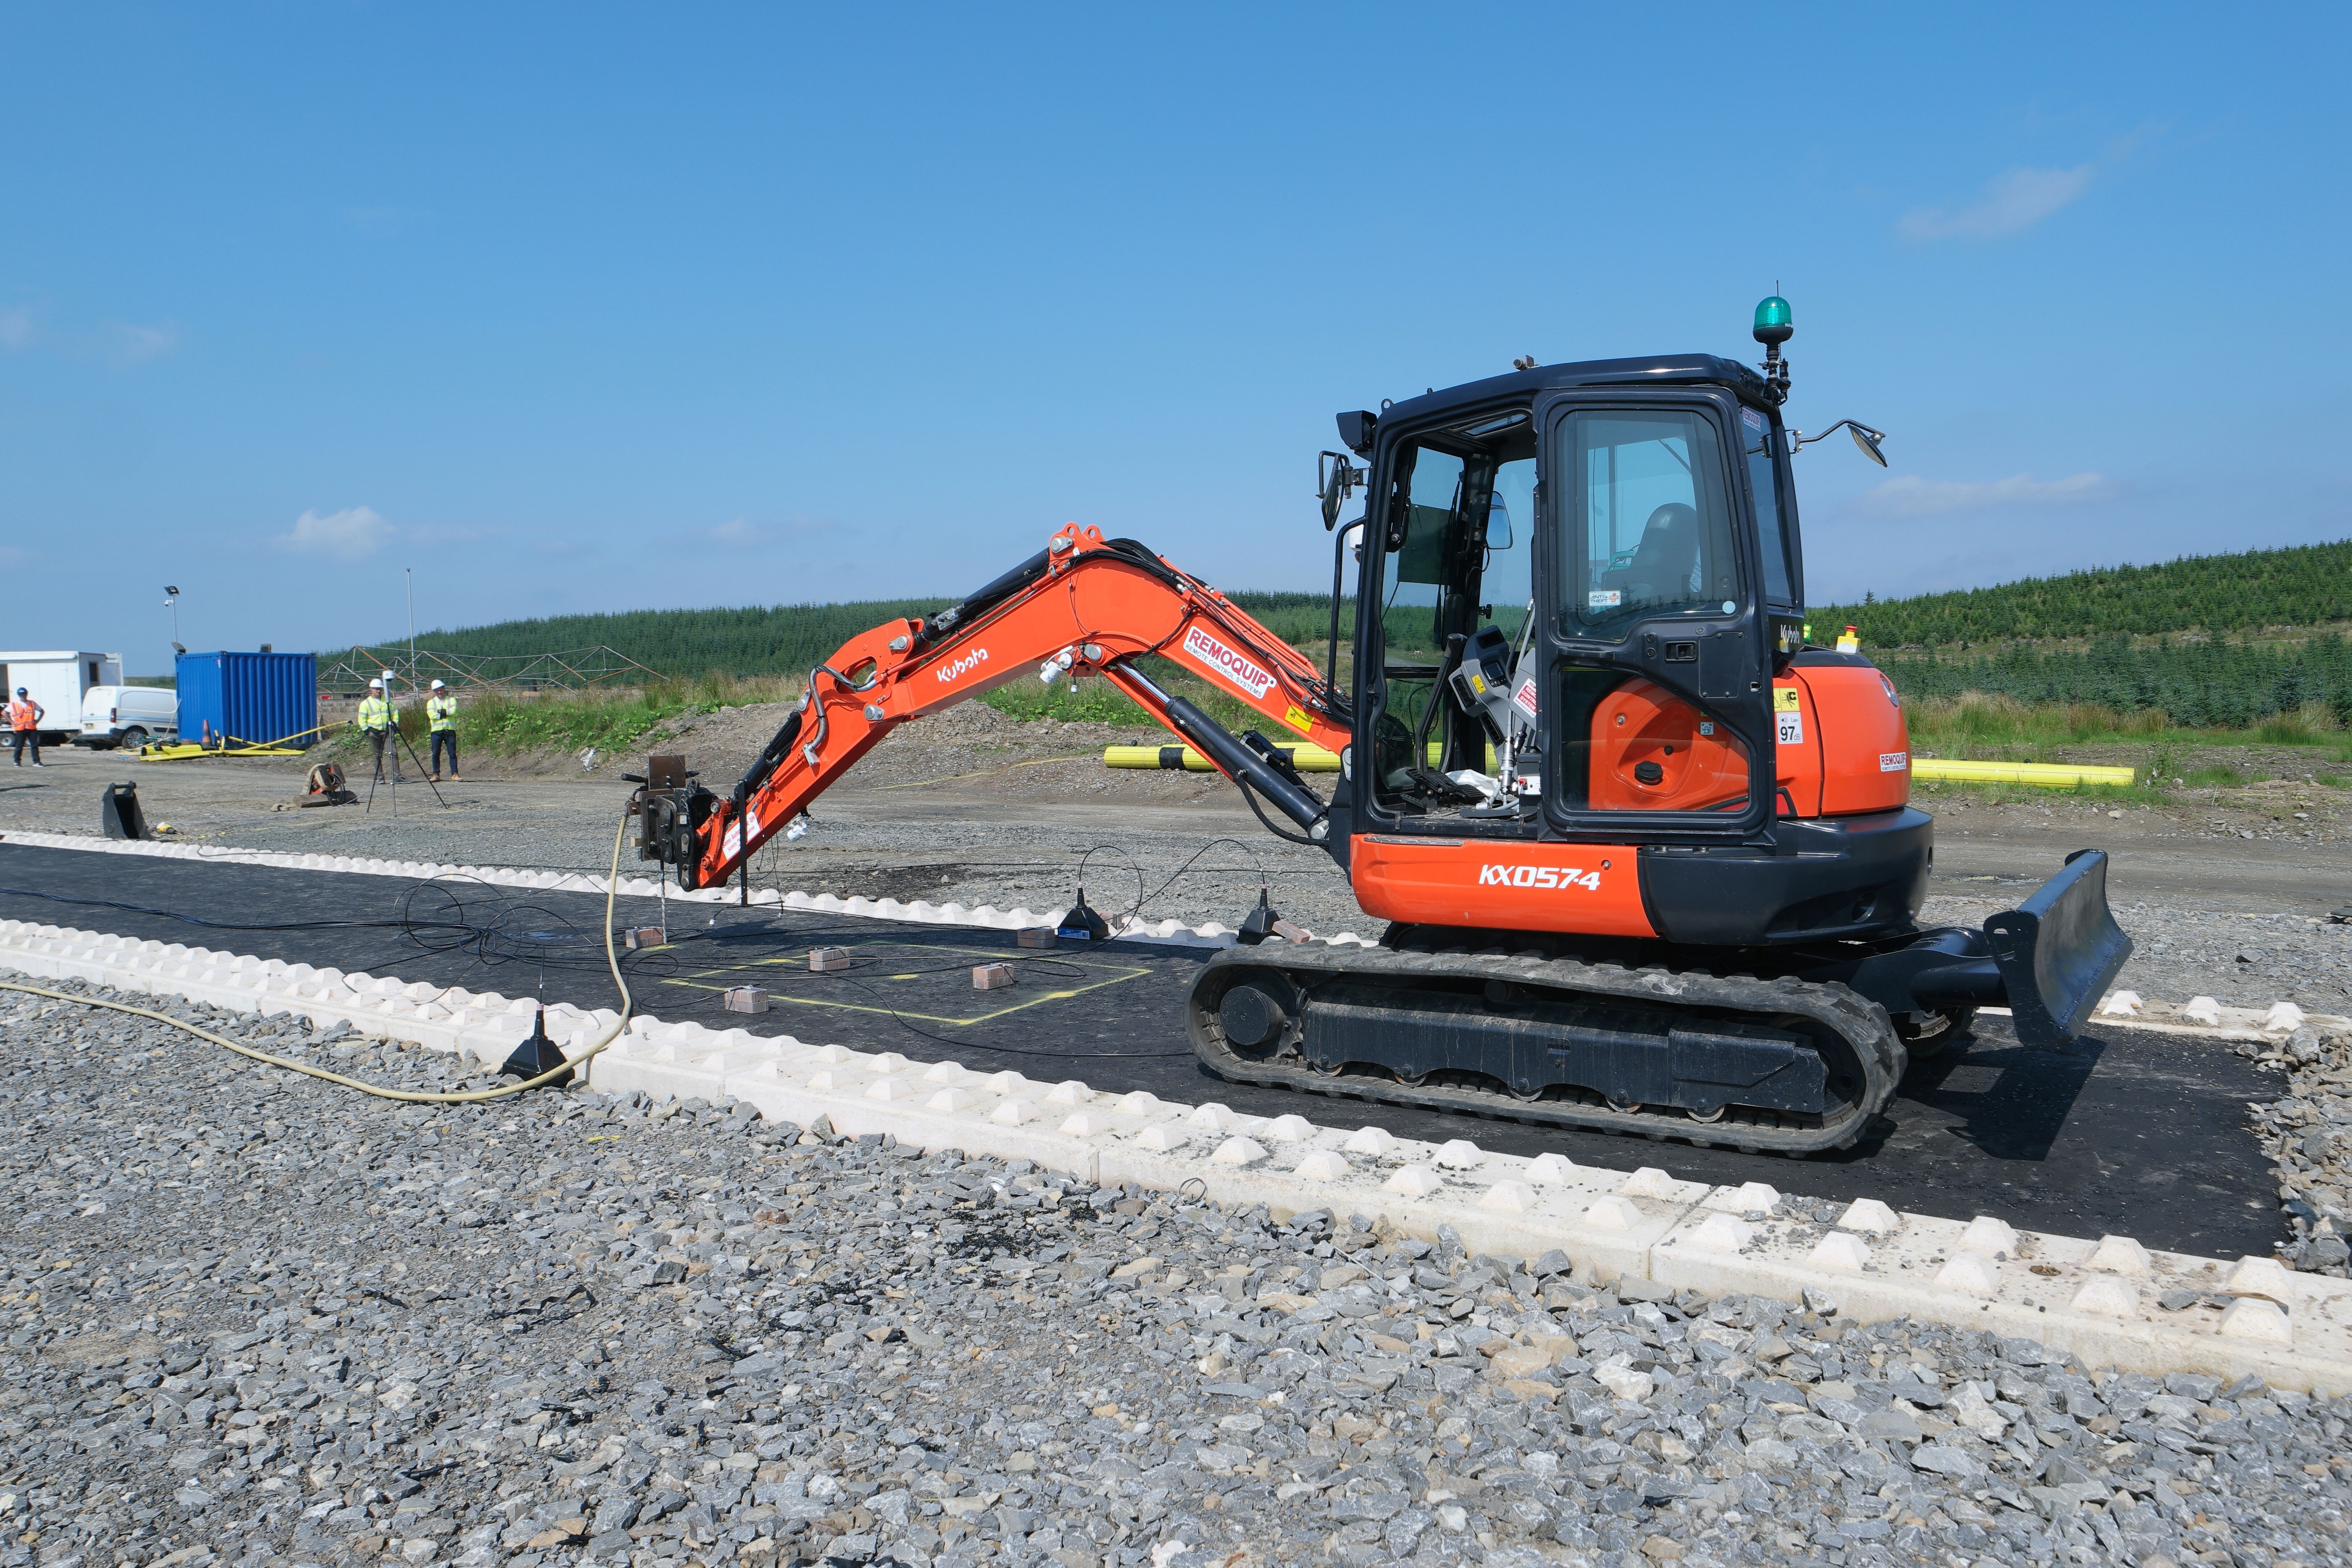
Figure 3
Remotely controlled excavator in use in H21 (Northern Gas Networks, 2021).
6.0 Conclusion
A total of five non-deliberate ignition events have been identified from a set of 1,336 hydrogen release experiments conducted over the course of more than 20 years. The data presented is categorised by type, release rate and, where relevant, maximum concentration.
Broadly speaking, the data can be said to represent the ignition probability trends in simple ignition models for hydrogen. Against the HyRAM and HYEX models, in all cases, the likelihood of non-deliberate ignition in experiments is shown to be significantly below the simple models compared. The UKOOA model, when modified to use an equivalent volumetric release rate, showed relative agreement with the experimental observations. No further interpretation of the validity of the dataset for use in real applications is made. It is left to others to determine if the information is useful and valid for checking real-world ignition probability models.
The ignition events identified are briefly discussed, and all have readily identifiable ignition mechanisms that can be attributed to them.
Ongoing research projects have already provided information that would be useful to add to this dataset, although they have not been fully reported. Equally, data in the same format from other laboratories may prove a useful addition.
Liquid hydrogen releases have not been covered in this review, although some data does exist for a future revisiting of this topic if it proves useful for ignition probability modelling.