
1. Introduction
The quenching distance is defined as the minimum gap through which a flame kernel can propagate between parallel plates, and it is one of the fundamental characteristics used in assessing the physical risks of flammable gases. It plays an important role in industrial applications, including the design of combustion systems such as flame engines, the development of safety devices such as flame arresters, and the establishment of safety standards for preventing explosive accidents. Therefore, investigating the characteristics of the quenching distance is essential from the perspective of disaster prevention and safety. The internationally standardized method for measuring the quenching distance is specified in (ASTM, 2013). In this method, a pair of vertically arranged opposing electrodes equipped with circular glass flanges is used to measure the quenching distance. As the electrode gap is reduced, the spark energy required for ignition increases sharply owing to the cooling effect and deactivation effect of species caused by impingement of flame kernel to flanges. Eventually, even if a large amount of energy is supplied, the flame is quenched between the plates and can no longer propagate. The quenching distance obtained using this measurement method ensures relatively high accuracy with minimal variability introduced by the operator. In addition, the minimum ignition energy (MIE) is evaluated by controlling the discharge energy at an electrode gap 0.05 mm larger than the quenching distance.
It is well known that the social implementation of carbon-free energy carriers such as hydrogen and ammonia is being promoted in various fields from the viewpoint of mitigating global warming. Hydrogen requires extremely careful handling because it has a very low MIE of approximately 0.017 mJ (Ono et al., 2005), a very high laminar burning velocity of approximately 2.6 m/s (Strehlow and Mizutani, 1973), and a very small quenching distance of approximately 0.6 mm (Lewis and von Elbe, 1984). These characteristics of hydrogen significantly increase the risks of ignition and explosion, making it difficult to directly replace existing fuels with pure hydrogen from the viewpoint of combustion safety and combustion control. In contrast to hydrogen, ammonia has relatively low flammability, with a laminar burning velocity of only approximately 0.07 m/s (Yang et al., 2025). Therefore, blending ammonia with highly reactive fuels such as hydrocarbons or hydrogen has attracted considerable attention as a practical approach for improving its combustion characteristics. In particular, hydrogen–ammonia blended fuels are regarded as especially promising because hydrogen-containing fuels can be readily produced by the catalytic decomposition of pure ammonia.
Accordingly, the fundamental combustion and ignition characteristics of hydrogen–ammonia blended fuels have been investigated. These include laminar burning velocity (Gotama et al., 2022; Li et al., 2024; Yasiry et al., 2023; Zitouni, Brequigny and Mounaïm-Rousselle, 2023), flammability limits, and the effects of inert gas addition (Cheng et al., 2024), exhaust gas characteristics (Hua, Valera-Medina and Bowen, 2017), pressure rise behavior (Cheng and Zhang, 2024; Li et al., 2021), and MIE (Essmann et al., 2024; Fernández-Tarrazo, Gómez-Miguel and Sánchez-Sanz, 2023; Lesmana et al., 2022; Wu et al., 2024). Regarding the MIE, for example, theoretical models have been proposed by Fernández-Tarrazo, Gómez-Miguel and Sánchez-Sanz, and experimental studies have been conducted by Wu et al. and Lesmana et al. However, the theoretical model of Fernández-Tarrazo et al. was not compared with experimental values, while the experimental data by Wu et al. and Lesmana et al. include variations arising from electrode geometry, discharge duration, ignition-circuit configuration, combustion-vessel volume, and other factors. Thus, an authorized value of MIE has not been established. In particular, for weakly flammable gases such as ammonia and low global warming potential (low-GWP) refrigerants, the reported MIE values sometimes differ by several orders of magnitude among studies (Takizawa et al., 2025).
Therefore, methods for estimating MIE from the quenching distance have attracted attention. Lewis and von Elbe (Lewis and von Elbe, 1984) experimentally investigated the relationship between quenching distance and MIE using an ASTM-based measurement method and proposed an empirical correlation between them. They also constructed a simplified theoretical model assuming that the energy contained in a spherical flame kernel with a diameter corresponding to the quenching distance is equivalent to the MIE. Although the original model tended to overestimate the experimentally measured MIE, Takizawa et al. (Takizawa et al., 2020) recently improved the theoretical model by considering the temperature distribution near the flame front. Their modified model demonstrated that the MIE of weakly flammable refrigerants can be reasonably predicted from the quenching distance measured by the ASTM E582. As a result, the quenching distance, together with the MIE and laminar burning velocity, has attracted attention as an important parameter for evaluating ignition characteristics and as a parameter for estimating MIE. However, as mentioned above, quenching-distance data for hydrogen–ammonia blended fuels over wide ranges of equivalence ratio and mixture composition remain very limited.
Against this background, the objective of this study is to address this research gap by precisely measuring the quenching distance of hydrogen–ammonia blended fuels using an ASTM E582-compliant method and quantitatively evaluating its dependence on the equivalence ratio and ammonia fraction.
2. Experimental Methods
2.1 Quenching Distance Measurement
In this study, the quenching distance was measured using parallel-flange electrodes in accordance with ASTM E582 (ASTM, 2013). Figure 1 shows a photograph of the parallel-flange electrode used in the experiment. The electrode consists of a stainless-steel rod with a diameter of 2.0 mm, with a circular quartz glass flange (thickness: 3 mm) attached at the tip. Although ASTM E582 specifies that the parallel flanges be oriented vertically, buoyancy may facilitate flame-kernel propagation through the electrode gap in mixtures with relatively low burning velocities. Therefore, the electrodes were arranged horizontally and parallel to each other at the center of the combustion chamber. Due to experimental limitations, two types of combustion chambers with different volumes were used. As a result, the diameter of the electrode flanges and the measurement procedure for the quenching distance varied accordingly in each test. A flange of 50 mm diameter was used in the test using Combustion Chamber A (1.34 L), as shown in Figure 2a), and a 20 mm diameter flange was used in the test using Combustion Chamber B (178 mL). Both chambers were equipped with a pressure relief unit, in which an opening covered with aluminum foil prevented chamber rupture by dispersing the internal pressure upon ignition. Combustion Chamber A was equipped with two DC axial fans (50 mm square, max voltage 12 V) positioned at opposite corners to ensure homogeneous mixing of the combustible gas mixture. Combustion Chamber B did not have fans; however, since the chamber volume was small and could be evacuated to near-vacuum conditions, sufficient mixing was assumed to occur via the momentum of the introduced gases.
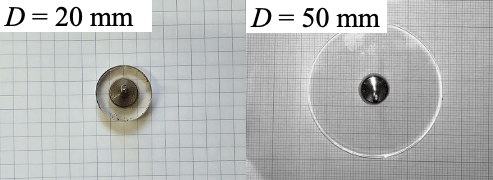
Figure 1
Photo of electrodes with flat plates.
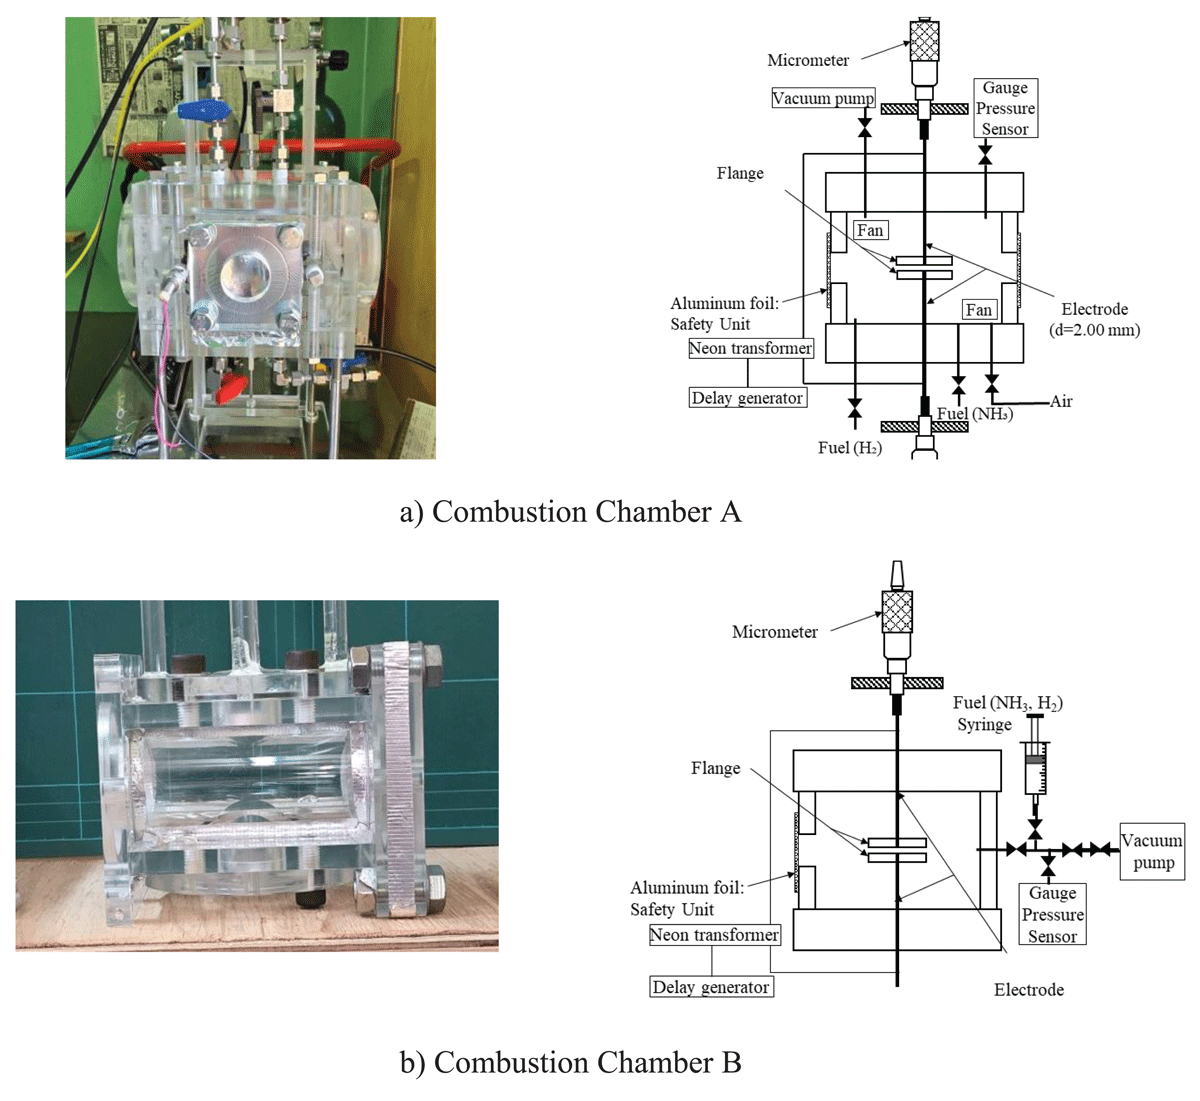
Figure 2
Schematics and photo of the experimental apparatuses.
The electrode gap was adjustable with a dial gauge with a precision of 0.01 mm. A high voltage (rated secondary voltage: 15 kV, 20 mA) was supplied to the electrodes using a neon transformer to generate electrical discharge. A solid-state relay was placed in the primary voltage supply line of the neon transformer, and a single rectangular pulse (5 Vp-p, pulse width: 1/30 s) from a function generator was used to control the discharge duration.
The ignition behavior was recorded using a high-speed schlieren imaging system with a high-speed camera (NovaS12, Photron) at a frame rate of 40,000 fps and a shutter speed of 1/50,000 s. A fixed-focus lens with a focal length of 105 mm and an aperture of f/2.8 was used for imaging.
The experimental conditions are summarized in Table 1. For measurements using the 50 mm diameter flange (Combustion Chamber A), the ammonia fraction , hydrogen fraction , and equivalence ratio φ were controlled as shown in Table 1. The maximum electrode gap at which the flame failed to propagate throughout the chamber was recorded as the quenching distance. For measurements using the 20 mm diameter flange (Combustion Chamber B), φ and the electrode gap d were controlled as shown in Table 2, and was incrementally increased by 0.25 to determine the ammonia fraction at which ignition failed.
Table 1
Experimental conditions of Combustion Chamber A.
| EQUIVALENCE RATIO, φ | ||
|---|---|---|
| 0.6 | 0.4 | 0.39, 0.41, 0.51, 0.61, 0.72, 0.82, 0.92, 1.03, 1.11, 1.21 |
| 0.7 | 0.3 | 0.45, 0.52, 0.62, 0.72, 0.82, 0.92, 1.03 |
| 0.8 | 0.2 | 0.57, 0.62, 0.72, 0.82, 0.92, 1.02 |
| 0.9 | 0.1 | 0.84, 0.92, 1.03 |
Table 2
Experimental conditions of Combustion Chamber B.
| EQUIVALENCE RATIO, φ | ELECTRODE GAP, d (mm) |
|---|---|
| 1.0 | 1.50, 2.00, 3.00, 4.00 |
| 0.9 | 1.50, 2.00, 3.00, 4.00 |
In Combustion Chamber A, the required amount of gas was introduced using the partial pressure method after evacuating the chamber with a vacuum pump. The gas mixture was stirred for 1 minute and then left undisturbed for 10 seconds before ignition was attempted via spark discharge. If ignition did not occur at an electrode gap of 7.00 mm, the equivalence ratio was increased in increments of 0.02, and the quenching distance was recorded at the equivalence ratio where ignition was successfully achieved. In Combustion Chamber B, a vacuum pump was used to evacuate the chamber, and hydrogen, ammonia, and air were introduced at predetermined volumetric flow rates using syringes. After a 10-second settling period, a spark was generated to determine whether ignition occurred. For both chambers, up to five ignition attempts were made under the same conditions (combustion composition and electrode gap). The largest electrode gap at which at least one ignition attempt failed was recorded as the quenching distance. Ignition was judged to have occurred if the aluminum foil covering the pressure relief port ruptured after discharge.
2.2 Laminar Burning Velocity Measurement
The laminar burning velocity for calculating the Peclet number was measured experimentally using Combustion Chamber A and schlieren imaging.
The influence of heat loss from hot kernel to obstacles relatively increases near the flammable limit because the burning velocity becomes lower than that near the stoichiometric composition. To minimize heat loss and quenching effects to measure the burning velocity, a pair of tungsten needle electrodes without flanges of 0.1 mm of tip diameter were used. The electrodes were placed vertically with a 1 mm gap. The ignition source was capacitive discharge ignition. The composition of the fuel mixture was , φ = 0.4–1.0 with an interval of 0.1. A series of tests was repeated three times in each condition.
3. Results and Discussion
3.1 Dependence of Quenching Distance on Ammonia Fraction
Figures 3 and 4 show the dependence of the quenching distance dq on the ammonia fraction for equivalence ratios φ = 0.9 and φ = 1.0, respectively. The data by Lewis and von Elbe (Lewis and von Elbe, 1984) and our previous work (Imamura et al., 2024) for , and by Takizawa et al. for were also plotted together for comparison. Furthermore, the following relationships were plotted as dotted lines.
where the variables and present the quenching distances for pure hydrogen and pure ammonia in air, respectively. Eq. (1) assumes that dq changes linearly from to . In contrast, Eq. (2) assumes that the quenching distance for hydrogen–ammonia fuel mixtures is weighted by their respective mole fractions and .
Figures 3 and 4 indicate that variations in the electrode plate diameter, the combustion chamber’s shape, and volume had little effect on the measured quenching distances. This finding is consistent with the results of Takizawa et al., in which the relationship between the quenching distance and the electrode plate diameter at φ = 1.0 was experimentally investigated. Their study demonstrated that the quenching distance remains nearly constant regardless of the plate size by using a flange whose diameter satisfies D > 5dq. In the present study, it seemed that the influence of the plate size was minimal because all data were obtained under the experimental conditions satisfied D ≥ 5dq. Furthermore, the quenching distance of hydrogen–ammonia blended fuel mixtures generally followed the trend predicted by Eq. (2). It suggests that the quenching distance exhibits a power-law dependence on the quenching distances of the pure components.
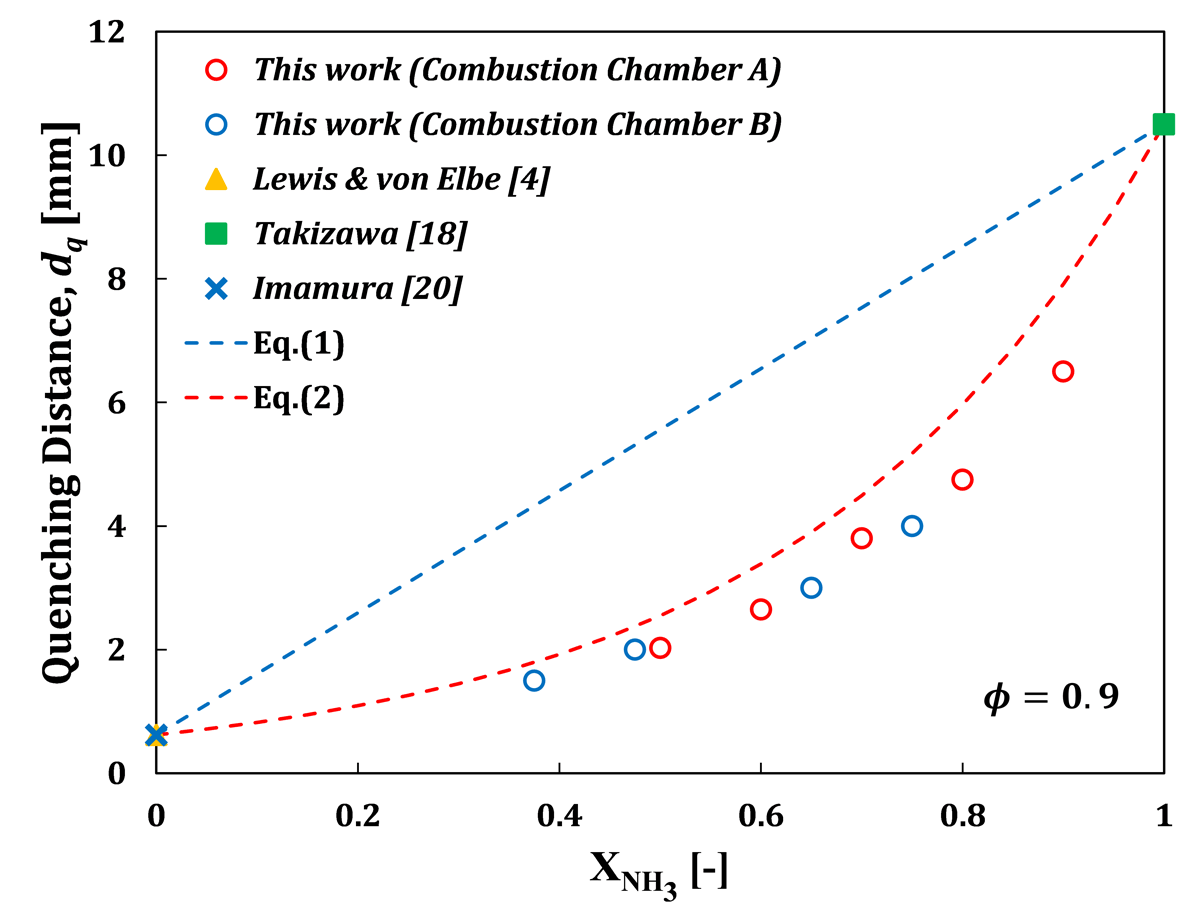
Figure 3
Dependence of dq on at φ = 0.9.
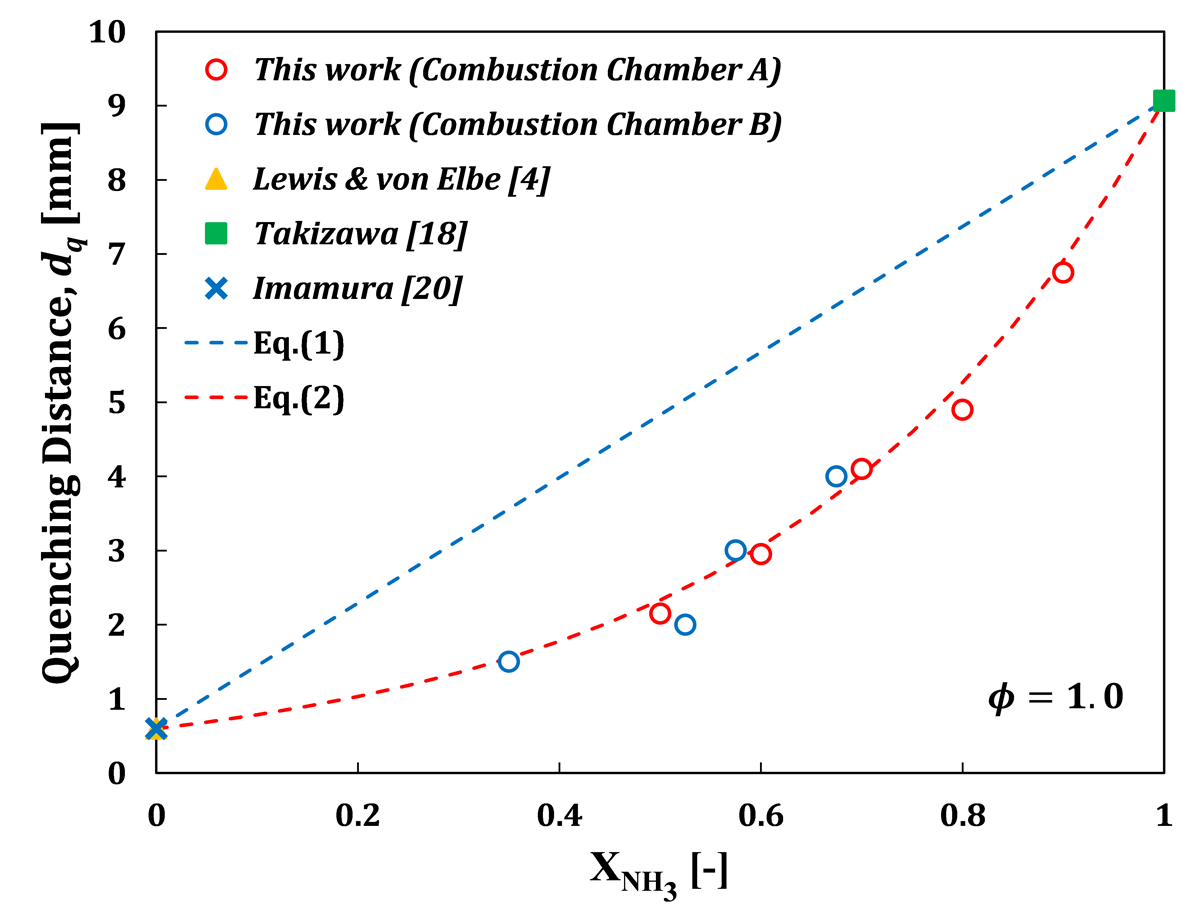
Figure 4
Dependence of dq on at φ = 1.0.
3.2 Dependence of Quenching Distance on Equivalence Ratio
Figure 5 illustrates the relationship between the quenching distance and the equivalence ratio for hydrogen–ammonia–air premixtures, with some conditions of ammonia fraction . For comparison, literature values for (Lewis and von Elbe, 1984; Imamura et al., 2024) and (Takizawa et al., 2025) were also plotted in Figure 5. As decreases, the quenching distance decreases and the equivalence ratio corresponding to the minimum quenching distance shifts from 1.0 toward the lean side.
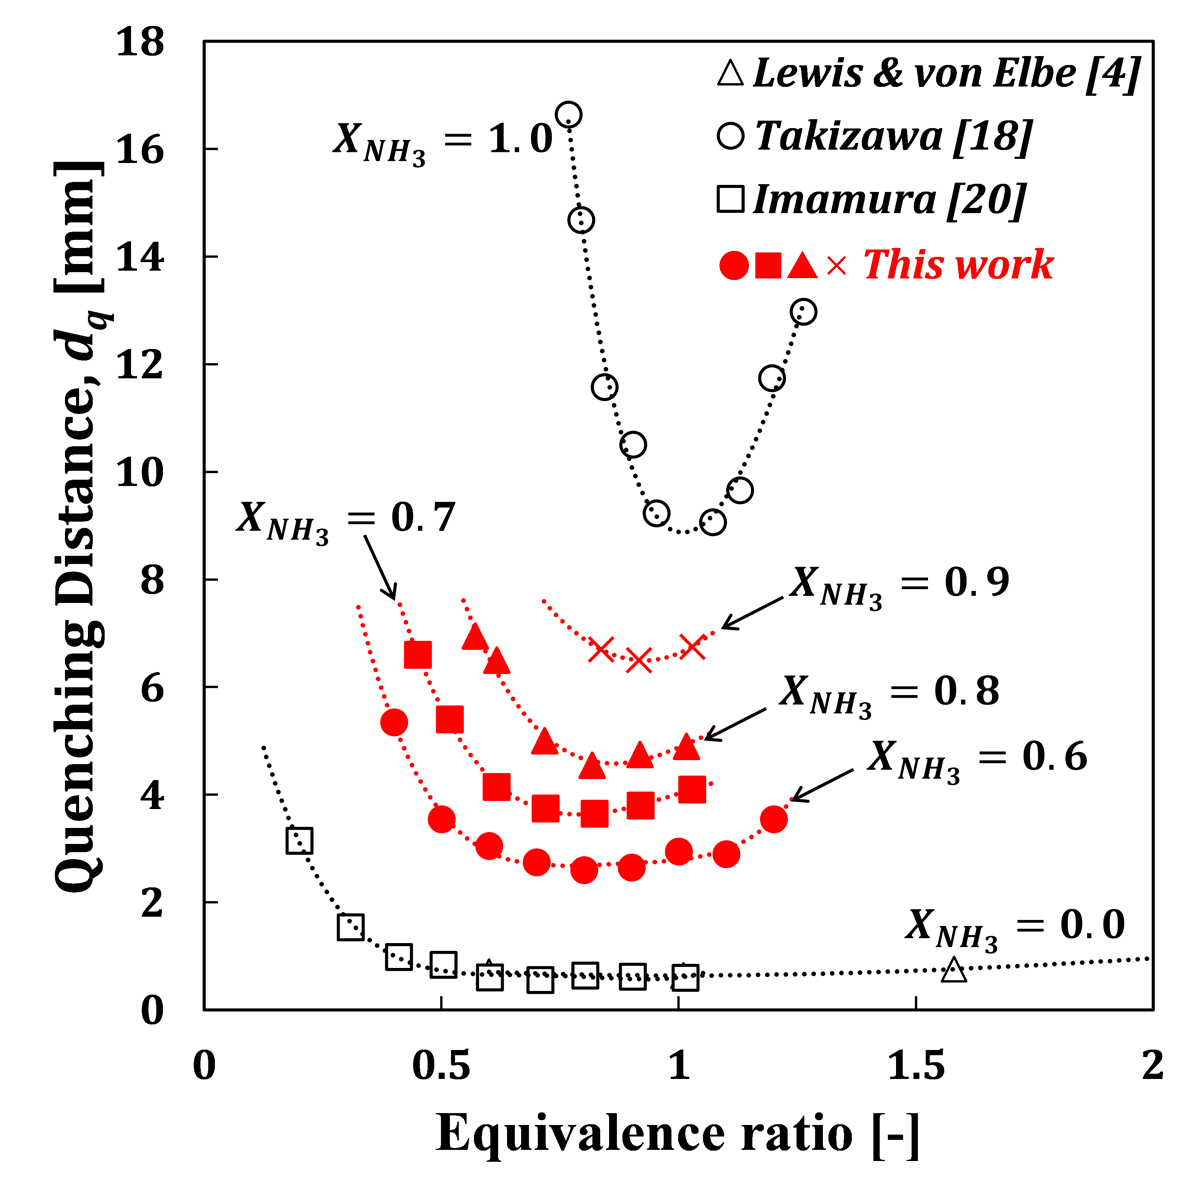
Figure 5
Relationship between dq and equivalence ratio.
Figure 6 presents a comparison of the dependence of the quenching distance on the equivalence ratio with that of methane–air and propane–air premixtures (Suematsu and Imamura, 2023; Suematsu et al., 2024). These data were obtained under nearly identical initial conditions in our previous studies, including a temperature of 290 K and a pressure of approximately 91 kPa. Although the shape of the curve indicated that the dependence of quenching distance on equivalence ratio significantly differed from that of propane-air mixtures, the value of minimum quenching distance was slightly smaller. The present results at , especially the absolute values of quenching distance and the equivalence ratio at the minimum quenching distance, showed closely similar trend for methane–air mixtures. According to Yasiry et al., the laminar burning velocity for is as fast as that of methane–air premixtures. This suggests that hydrogen–ammonia mixtures with share similar combustion and safety characteristics with methane–air mixtures, making them a potential alternative fuel from both safety and combustion performance perspectives.
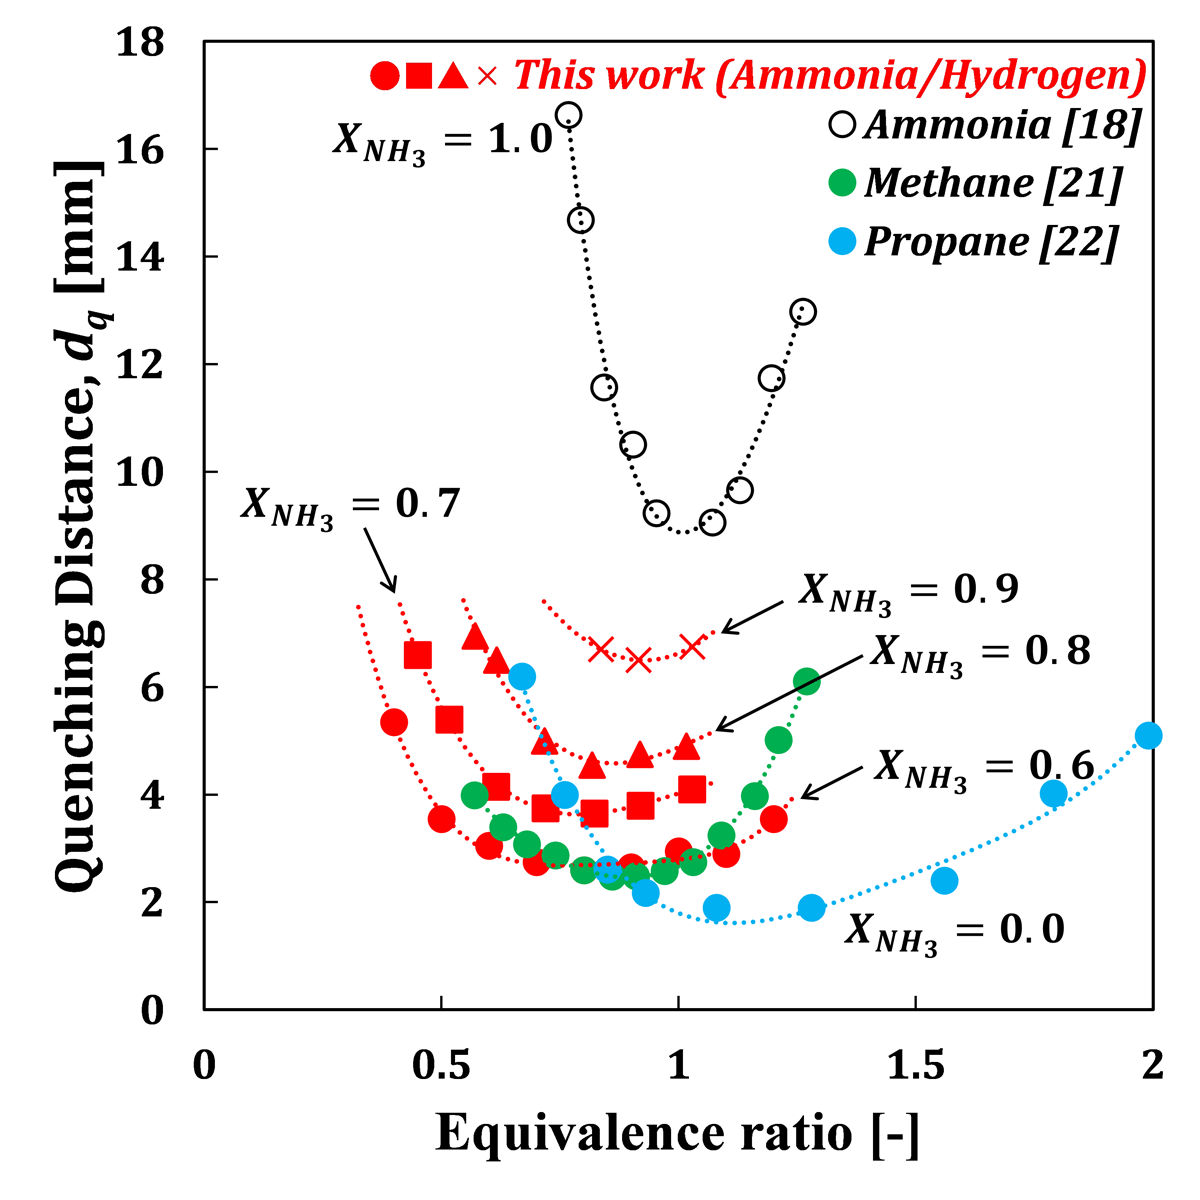
Figure 6
Comparison of this work with hydrocarbon fuel/air premixtures.
3.3 Dependence of Burning Velocity on Equivalence Ratio
Figure 7 presents the relationship between the flame propagation speed and the flame kernel radius. As the flame kernel grows, the propagation speed converges to a constant value. Figure 8 illustrates the relationship between the burning velocity and the flame stretch rate κ, which is defined following the method originally proposed by Markstein (Bechtold and Matalon, 2001; Kitagawa, 2005). In this method, the stretch rate κ represents the rate of change of flame surface area due to flame front curvature during spherical flame propagation. It is defined as the normalized time derivative of the flame surface area A, as shown in the following equation:
Here, r is the flame kernel radius, and Sn is the stretched flame propagation speed (radial growth rate of the flame front). The unstretched laminar burning velocity was obtained by extrapolating the measured burning velocity to a stretch rate of zero.
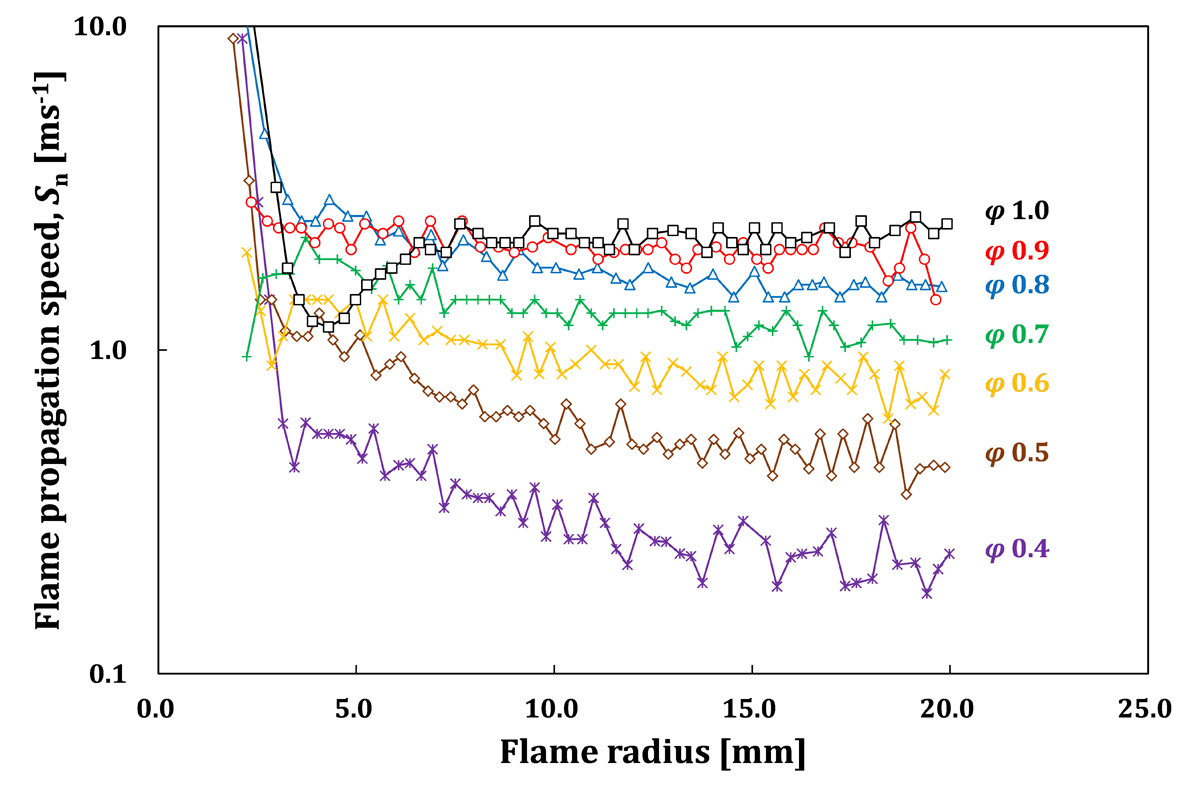
Figure 7
Relationship between the flame propagation speed and the flame kernel radius.
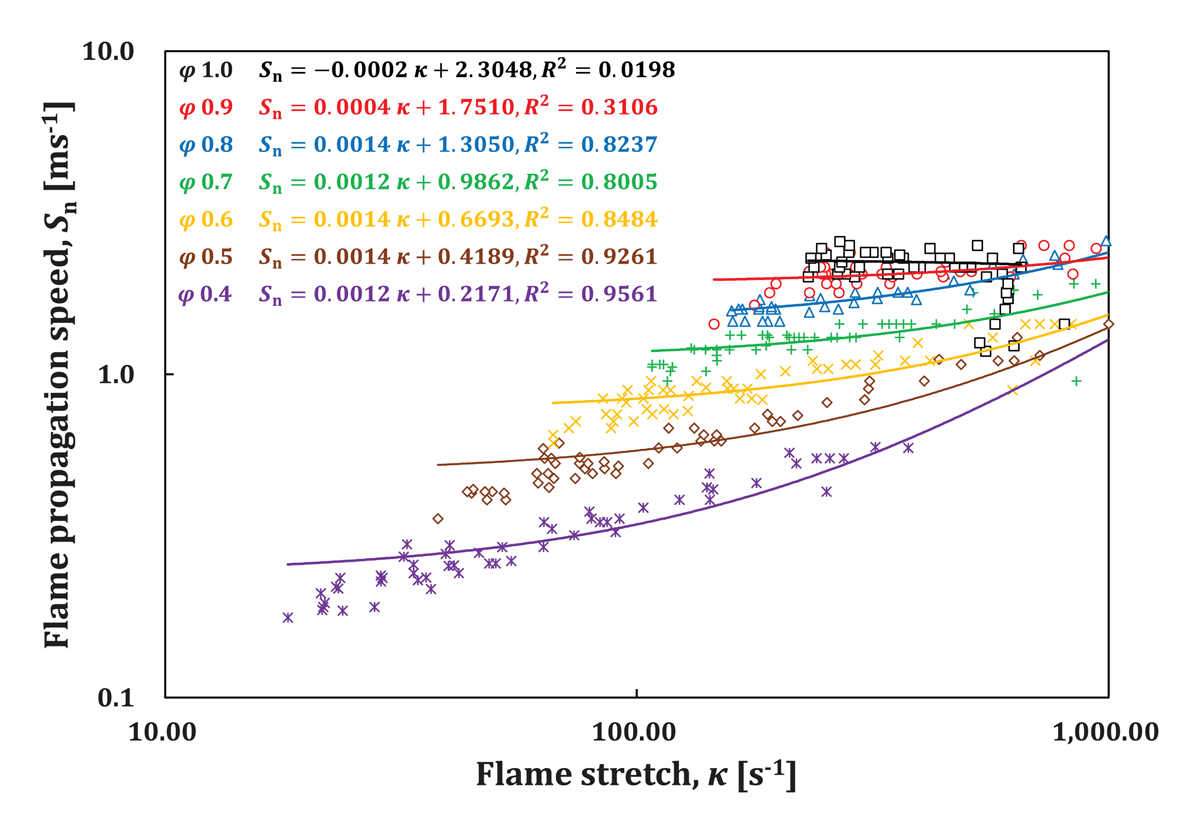
Figure 8
Relationship between the flame propagation speed and the flame stretch.
According to Figure 8, as the flame expands after ignition, the flame propagation speed gradually decreases due to the flame stretch effects. In contrast, the flame propagation speed consistently increases as the equivalence ratio increases. However, characteristic behavior is observed at φ = 1.0. The flame propagation speed during the initial stage of flame kernel growth decreases to a level comparable to that observed at φ ≈ 0.5 when the flame radius is approximately 5 mm. With further flame kernel growth, the flame propagation speed increases again, and at larger flame radius (r ≈ 10 mm), it exceeds that observed at φ = 0.9. This non-monotonic behavior at φ = 1.0 may be associated with the effect of an effective Lewis number greater than unity (Leeff > 1.0). The detailed definition and evaluation procedure of Leeff are described in Section 3.4. Under Leeff > 1.0, flame propagation tends to be weakened under high-curvature conditions during the early stage of ignition. As the flame kernel grows and the curvature effect is reduced, the flame propagation speed recovers accordingly. Figure 9 compares the measured burning velocity without stretched, obtained by considering the expansion rate (ρb/ρu), with the calculated burning velocity using Cantera. In this study, the Okafor-mech (Okafor et al., 2018) and CRECK-mech (Stagni et al., 2020) reaction mechanism models were used for the calculations. The measured burning velocity without stretched (open circles) is in good agreement with the calculations using the CRECK-mech model. In contrast, the burning velocities calculated using the Okafor-mech model were lower than those observed in the experiments.
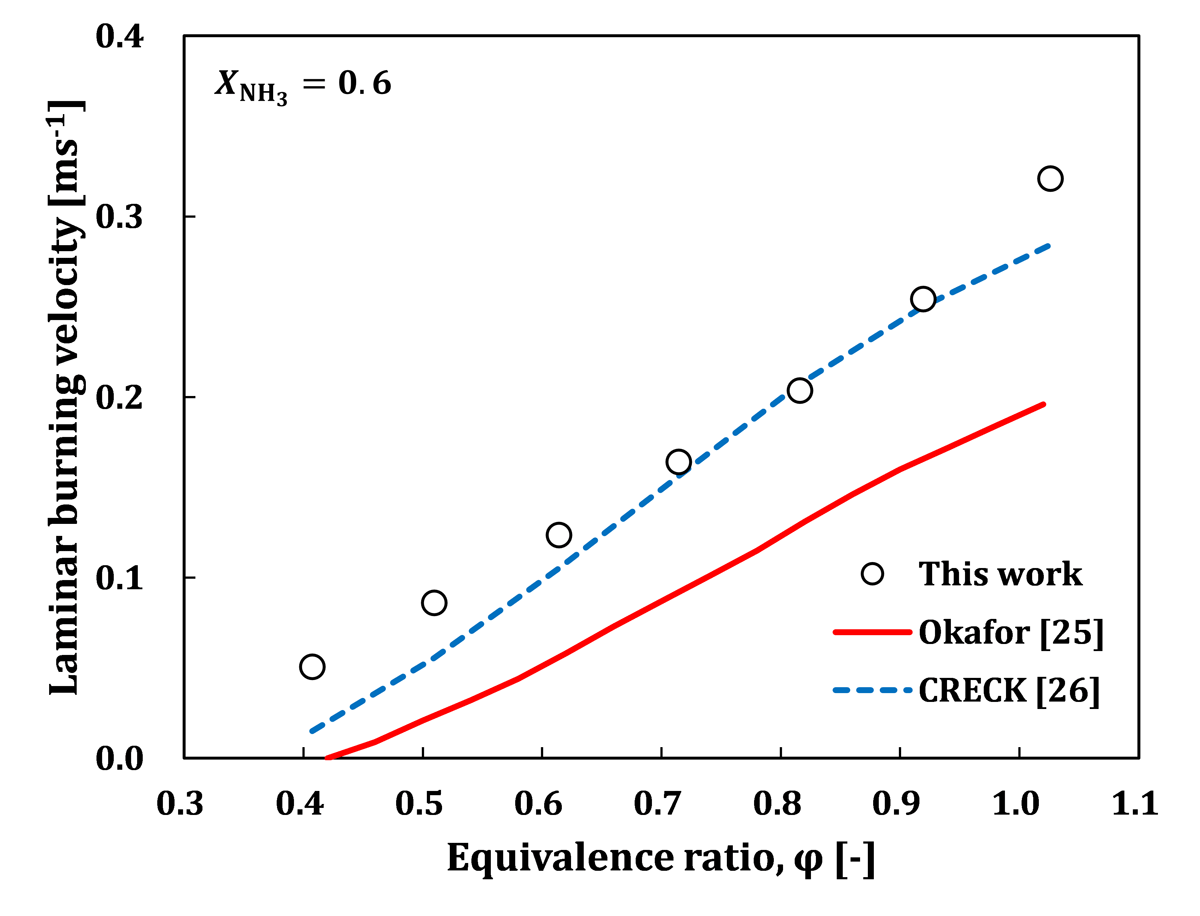
Figure 9
Relationship between laminar burning velocity and equivalence ratio.
3.4 Dependence of Quenching Peclet Number Pe on Equivalence Ratio
The quenching Peclet number (Pe) was calculated using the measured quenching distance by Eq. (4) (Lavoie, 1978).
Here, Cp denotes the specific heat at constant pressure (J/kg/K), ρ represents the density (kg/m3), and SL is the laminar burning velocity (m/s). Additionally, λ indicates the thermal conductivity (W/m/K). The subscript “u” indicates the unburned gas.
The quenching distance obtained experimentally and the thermophysical parameters ρu, SL, Cpu and λu estimated using Cantera were substituted to calculate Pe. The CRECK-mech was used for the calculations. Figure 10 shows the dependence of Pe on the equivalence ratio for different ammonia fractions. The data for reported in (Lewis and von Elbe, 1984) were also plotted for comparison. Pe of hydrogen–ammonia blended fuel mixtures exhibited a decreasing trend with decreasing equivalence ratio in φ ≤ 1.0, regardless of the ammonia fraction. Additionally, Pe followed the relationship given by the following equation:
The values for reported in reference also followed a similar trend and were consistent with Eq. (5). Hydrogen-containing flames are strongly influenced by preferential diffusion effects associated with the Lewis number. Previous studies reported that flames under Le < 1 conditions tend to exhibit enhanced combustion intensity and smaller quenching Peclet numbers compared with Le > 1 flames. However, defining a representative Lewis number for hydrogen–ammonia blended fuels is not straightforward because the dominant deficient reactant changes depending on equivalence ratio. Therefore, in the present study, an effective Lewis number (Leeff) proposed by Bechtold and Matalon (2001) was introduced to continuously represent diffusion characteristics over a wide equivalence-ratio range. The evaluation methods used to calculate the effective Lewis number (Leeff) and the corresponding Lewis numbers Lefuel and are described below.
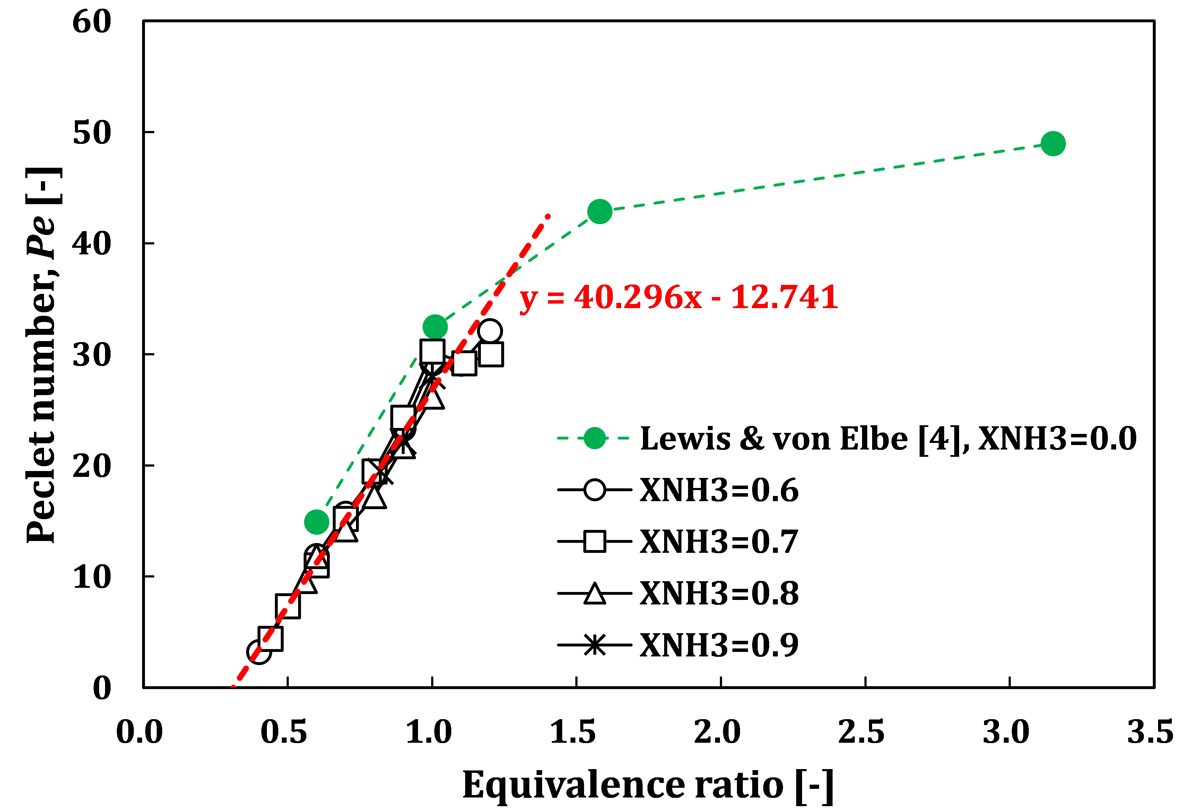
Figure 10
Relationship between Pe and equivalence ratio.
A) Lefuel
The Lewis number of the hydrogen–ammonia blended fuel, Lefuel, was evaluated using the following definition based on previous studies to account for the diffusion characteristics of the mixed fuel:
where α is the thermal diffusivity of the mixture, xi is the mole fraction of fuel component i, and Di, j is the binary diffusion coefficient between species i and species j. In the present study, nitrogen was adopted as the reference species for evaluating the binary diffusion coefficients. However, because the use of binary diffusion coefficients has been reported to overestimate the diffusion characteristics of hydrogen, the mixture-averaged diffusion coefficient was employed for hydrogen instead.
B)
The oxidizer-side Lewis number, , was defined as the ratio of the thermal diffusivity of the mixture to the mixture-averaged diffusion coefficient of oxygen:
where represents the effective diffusion coefficient of oxygen in the premixed gas mixture. The thermophysical properties and diffusion coefficients used in Eqs. (6) and (7) were evaluated using Cantera.
C) Leeff
In the present study, the effective Lewis number Leeff was evaluated according to the definition proposed by Matalon:
where Leexp and Ledef denote the Lewis numbers of the excess and deficient reactants, respectively. The coefficient A represents a parameter associated with equivalence ratio and mixture reactivity, and is given by:
Here, Φ is defined as 1/φ for φ < 1 and φ for φ ≥ 1, where φ is the equivalence ratio. In addition, β is the Zeldovich number, which was assumed to be β = 10 in the present study.
Figure 11 shows the dependence of the effective Lewis number (Leeff) on equivalence ratio for the experimental conditions investigated in the present study. The effective Lewis number can continuously characterize the mixture over a wide equivalence-ratio range without exhibiting strong dependence on fuel composition. For all ammonia fractions, Leeff monotonically increased with increasing equivalence ratio. Under lean conditions (φ < 1), Leeff < 1, whereas under rich conditions (φ > 1), Leeff > 1 was observed.
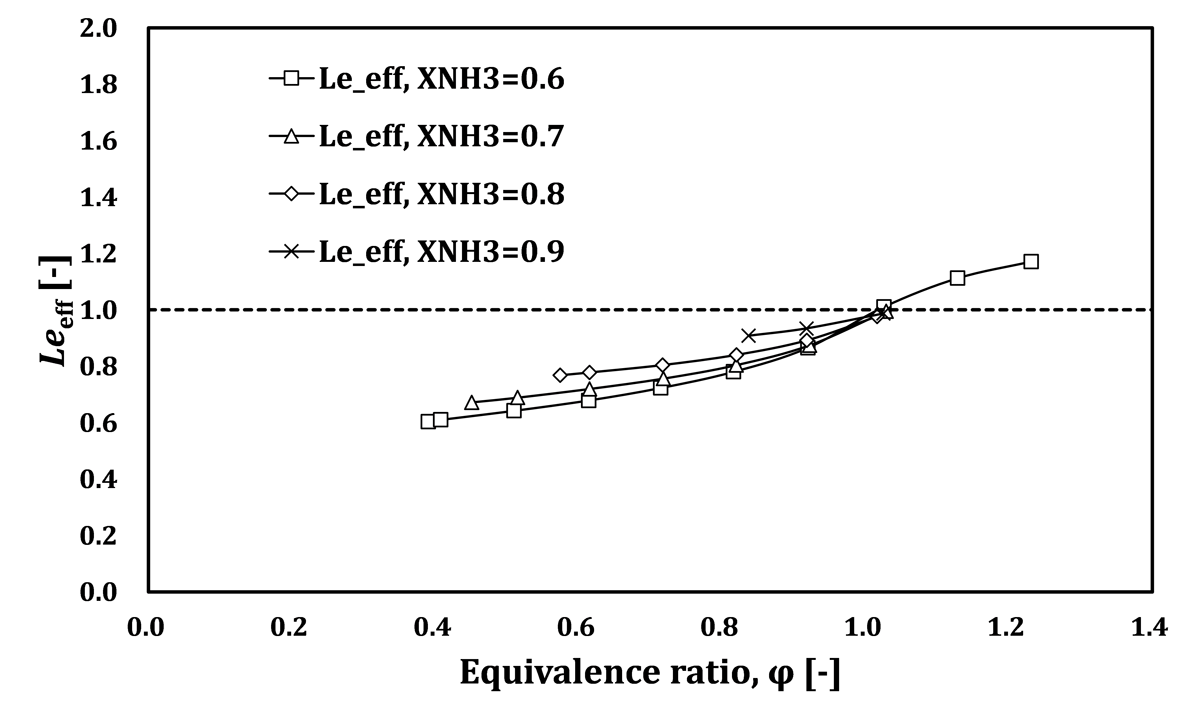
Figure 11
Equivalence-ratio dependence of effective Lewis number, Leeff.
For hydrogen–ammonia–air mixtures φ < 1.0, the flame behavior is not solely governed by the thermal balance between heat release and heat loss but is also significantly influenced by Lewis number effects. This causes enhancement for combustion and Pe that does not converge to a constant value. On the other hand, for φ > 1.0, the combustion is primarily determined by the thermal balance, and the influence of the Lewis number becomes negligible. As a result, it seems that Pe tends to converge to a certain value in the range of 40–50.
4. Conclusions
In this study, we experimentally investigated the quenching distance for hydrogen–ammonia premixed fuel under different equivalence ratios, leading to the following conclusions:
The dependence of quenching distance on the equivalence ratio for hydrogen–ammonia fuel exhibited a transition from the characteristics of pure hydrogen to those of pure ammonia as the ammonia fraction increased. Specifically, at φ = 0.9,1.0, the quenching distance followed Eq. (2). Additionally, dependence of the quenching distance on the equivalence ratio at closely resembled that of methane–air premixed fuel. This suggests that hydrogen–ammonia mixtures with share similar combustion and safety characteristics with methane–air mixtures.
In the fuel-lean composition, the quenching Peclet number was decreased with decreasing the equivalence ratio and their relationship followed Eq. (5) regardless of the ammonia fraction. On the other hand, for the fuel-rich composition, Pe almost maintained a constant in the range from Pe = 40 to 50. We proposed an empirical formula of relationship between the Pe and the equivalence ratio, and it made available to estimate the quenching distance.
Author Contributions
Jun-ichi Suematsu: planning, experiment, data analysis, writing, discussion
Naoto Kawashima: experiment, data analysis, discussion
Shou Komatsu: experiment, data analysis, discussion
Tomohiko Imamura: planning, funding, writing, discussion