
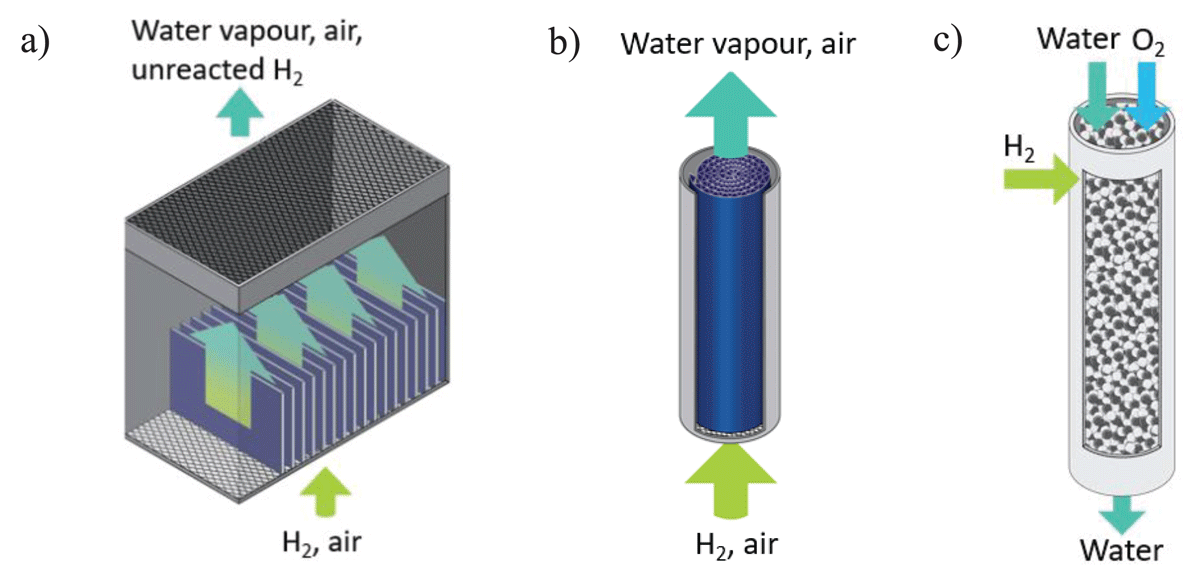
Figure 1
Schematics of three types of CNL-designed catalytic H2 recombiners: (a) passive autocatalytic recombiner, (b) gas phase recombiner, and (c) trickle-bed recombiner.
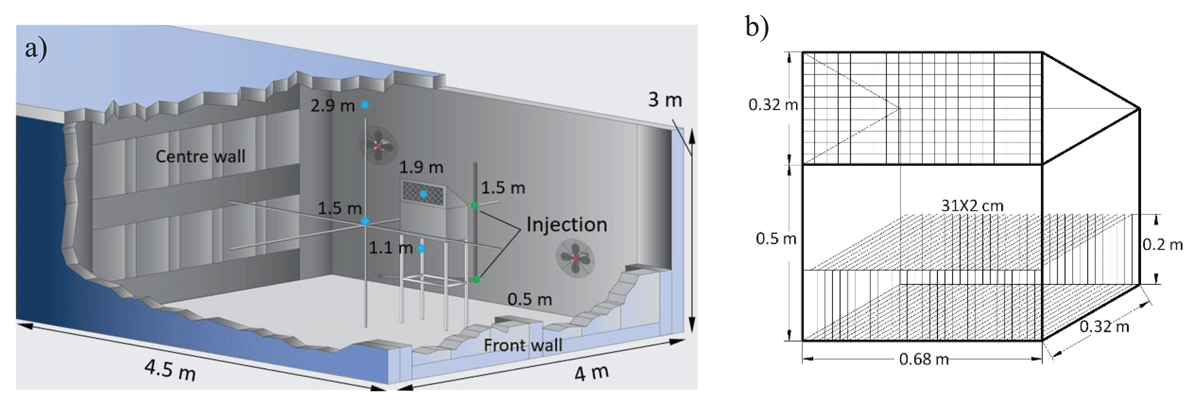
Figure 2
Schematic of the LSVCTF showing (a) front chamber dimensions, gas sampling (blue dots) and injection locations (green dots) and (b) standard PAR unit dimensions.
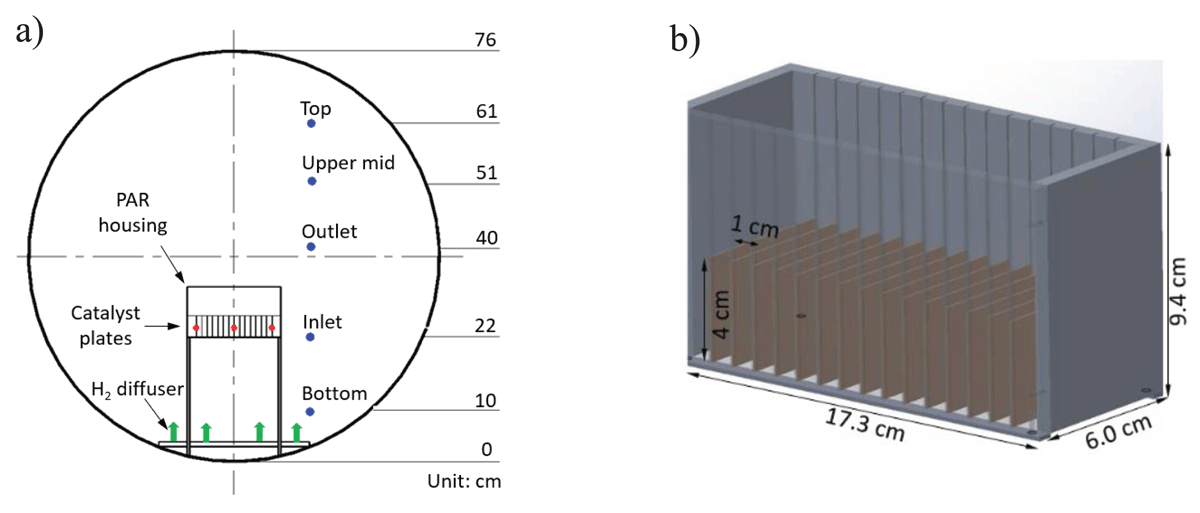
Figure 3
Schematic of the HSTF showing (a) vessel dimensions, gas sampling, temperature measurement, and injection locations and (b) 1/5th scale PAR dimensions.
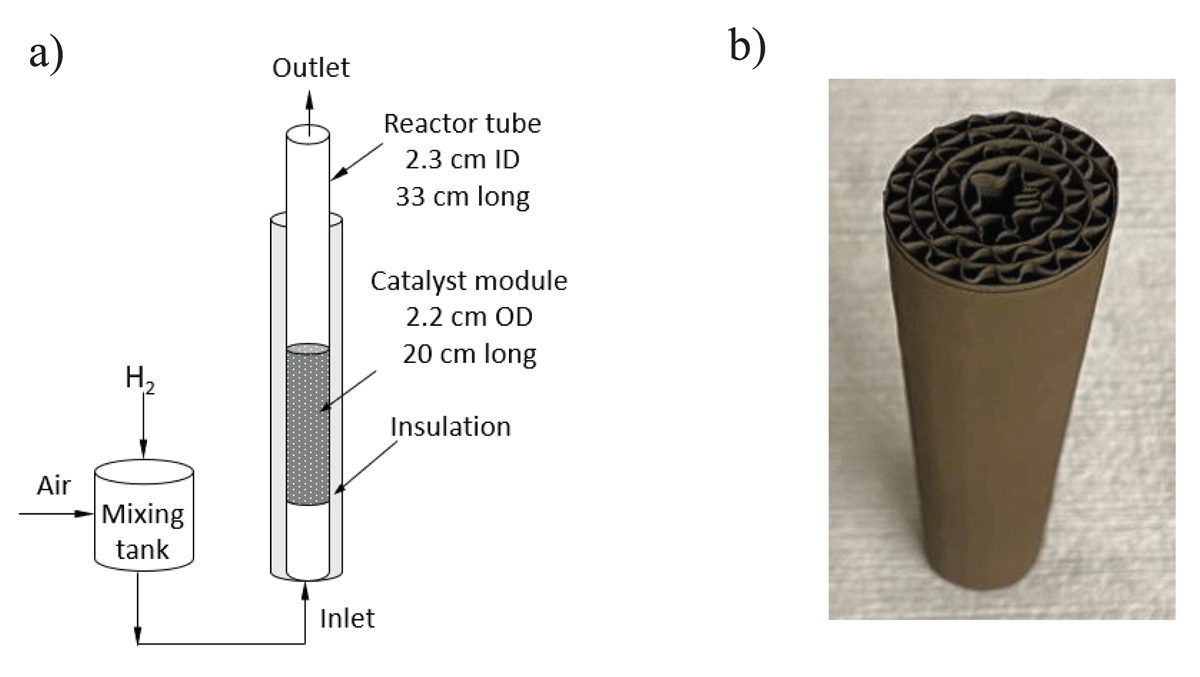
Figure 4
(a) Schematic of the monolith catalytic recombiner test setup and (b) photo of catalyst module.
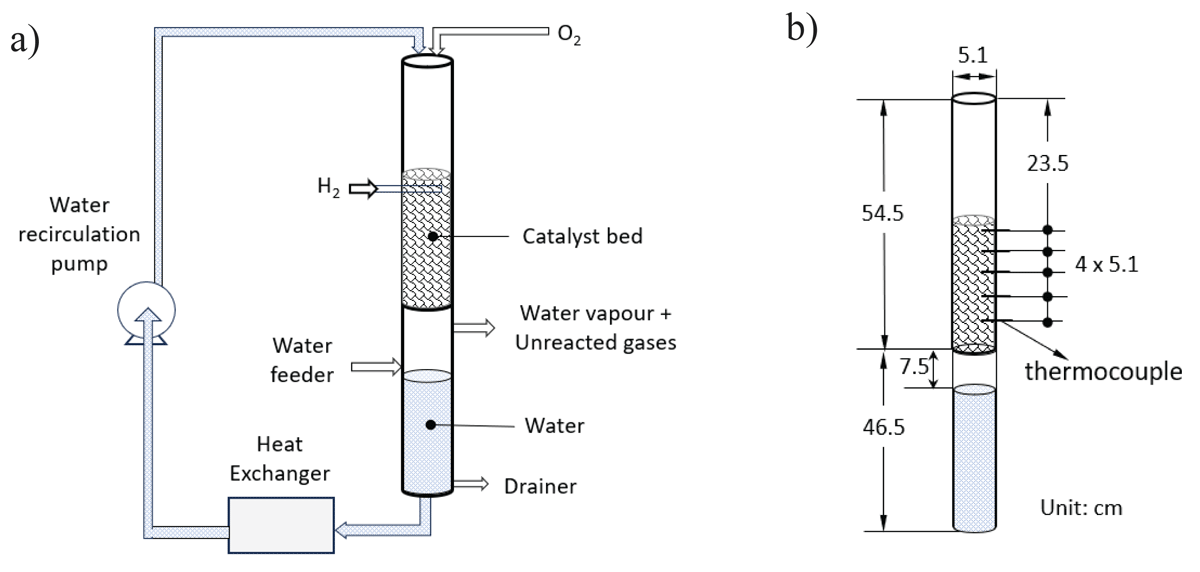
Figure 5
(a) Schematic of the trickle-bed recombiner test setup and (b) reactor dimensions and thermocouple locations (dots).
Table 1
Test conditions and data of standard full-scale PAR
| TEST ID | INJ. RATE (kg/h) | INJ. ELEV. (m) | FANS | STEADY-STATE PARAMETERS | |||||
|---|---|---|---|---|---|---|---|---|---|
| INLET H2 (vol.%) | OUTLET H2 (vol.%) | INLET GAS T (°C) | CATALYST T (°C) | EFF. (%) | CAPACITY (kg/h)(1) | ||||
| PAR1-1 | 0.111 | 0.5 | OFF | 0.92 | 0.29 | 29.3 | 140.0 | 68 | 0.147 |
| PAR1-2 | 0.109 | 1.5 | OFF | 0.85 | 0.23 | 28.7 | 138.0 | 73 | 0.134 |
| PAR1-3 | 0.109 | 0.5 | ON | 1.03 | 0.30 | 34.6 | 141.2 | 71 | 0.162 |
| PAR1-4 | 0.187/0.056 | 0.5 | ON/OFF | 0.81 | 0.36 | 27.5 | 91.2 | 56 | 0.129 |
| PAR1-5 | 0.179/0.029 | 0.5 | ON/OFF | 0.67(2)1.01 | 0.670.26 | 26.528.3 | 29.0–156.5 | 074 | 00.162 |
[i] (1)Capacity was calculated using Equation 3 based on the measured inlet H2%, gas temperature, and vessel pressure.
(2)The top row shows the peak values, while the bottom row shows the lowest values.
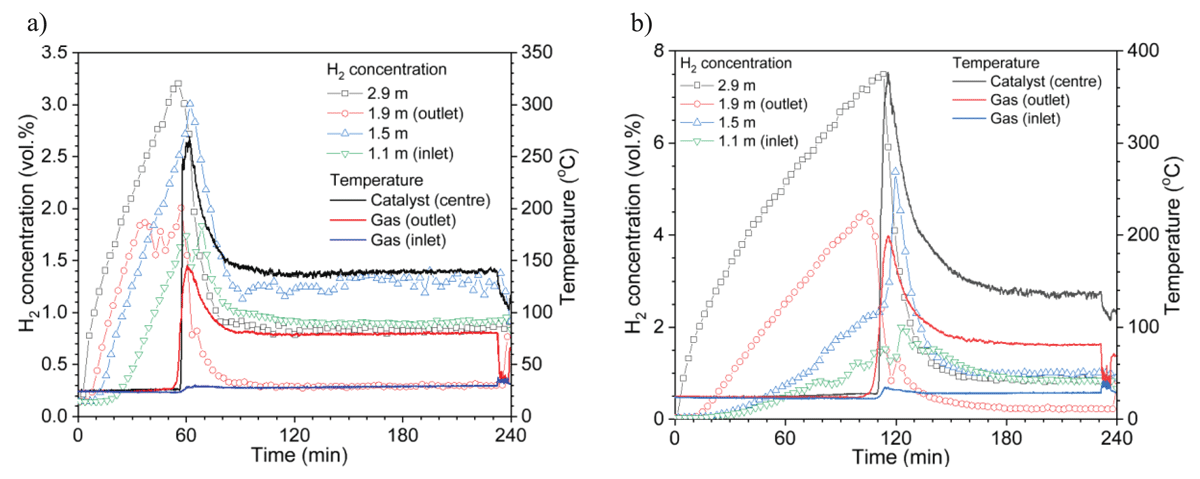
Figure 6
Time history of H2 concentrations and temperatures at an injection rate of 0.1 kg/h with fan off: (a) PAR1-1 (injection at 0.5 m height) and (b) PAR1-2 (injection at 1.5 m height).
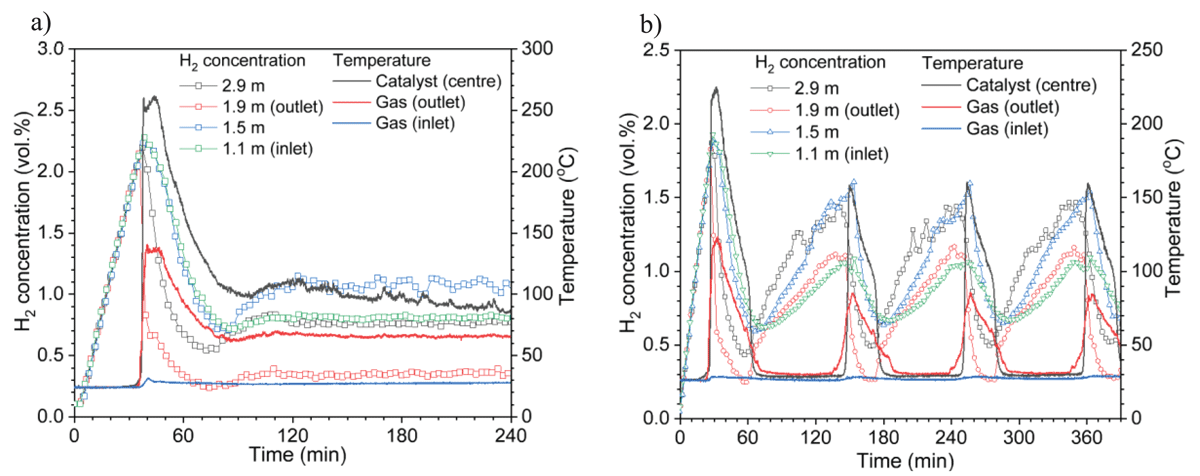
Figure 7
Time history of H2 concentrations and temperatures of LSVCTF tests: (a) PAR1-4 (0.056 kg/h injection) and (b) PAR1-5 (0.03 kg/h injection).
Table 2
Technical conditions and data of a 15-plate small-scale PAR.
| TEST ID | INJECTION RATE (kg/h)(1) | PARAMETERS AT THE START OF THE QUASI-STEADY STATE | |||||
|---|---|---|---|---|---|---|---|
| INLET H2 (vol.%) | O2(2) (vol.%) | INLET GAS T (°C) | CATALYST T (°C) | VESSEL P (kPa)(2) | CAPACITY, M (kg/h)(3) | ||
| PAR2-1 | 0.0049 | 0.98 | 18.3 | 26.9 | 145.6 | 100.4 | 0.0053 |
| PAR2-2 | 0.0147 | 2.42 | 19.1 | 34.1 | 306.6 | 111.7 | 0.0152 |
| PAR2-3 | 0.0245 | 3.61 | 17.6 | 36.7 | 411.0 | 112.5 | 0.0244 |
| PAR2-4 | 0.0344 | 4.78 | 17.2 | 49.4 | 517.9 | 112.2 | 0.0331 |
| PAR2-5 | 0.0393 | 5.49 | 15.7 | 50.9 | 582.2 | 113.3 | 0.0397 |
| PAR2-6 | 0.0442 | 6.25 | 14.7 | 57.6 | 616.1 | 112.4 | 0.0458 |
[i] (1)The injection rates, expressed in standard litres per minute (SLPM) at a temperature of 25°C and absolute pressure of 1 atm, are 1, 3, 5, 7, 8, and 9, respectively.
(2)O2 concentration and vessel pressure decreased continuously during the steady-state period.
(3)The capacity was calculated using Equation 3 and scaled down by a factor of 30.
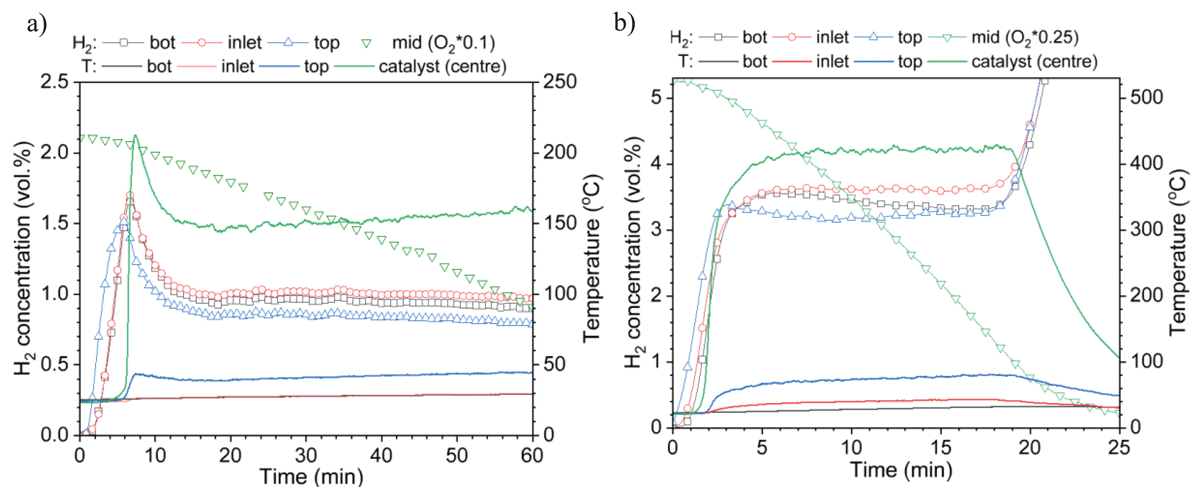
Figure 8
Time history of H2 concentrations and temperatures of HSTF tests: (a) PAR2-1 (1 SLPM) and (b) PAR2-3 (5 SLPM).
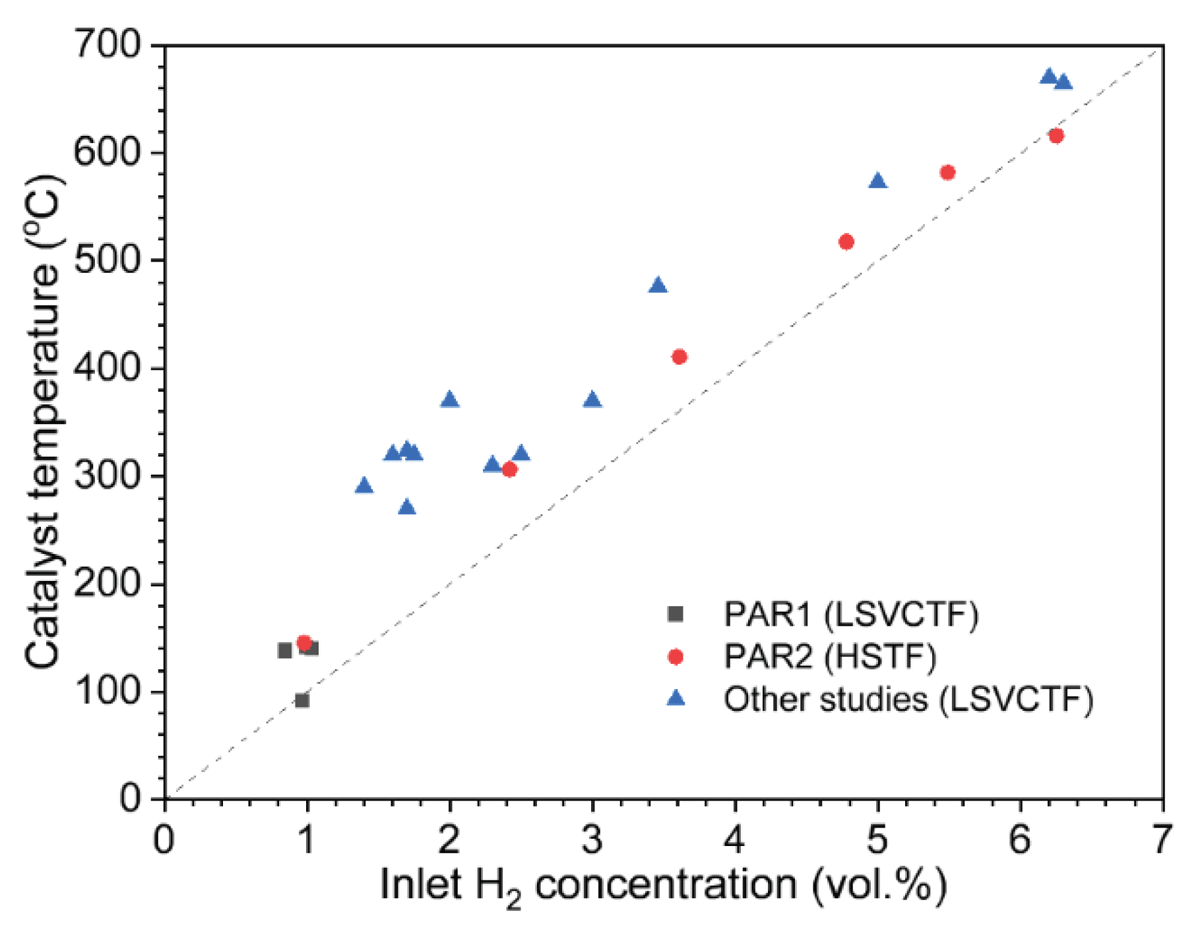
Figure 9
Relationship of steady-state inlet H2 concentration and maximum catalyst temperature.
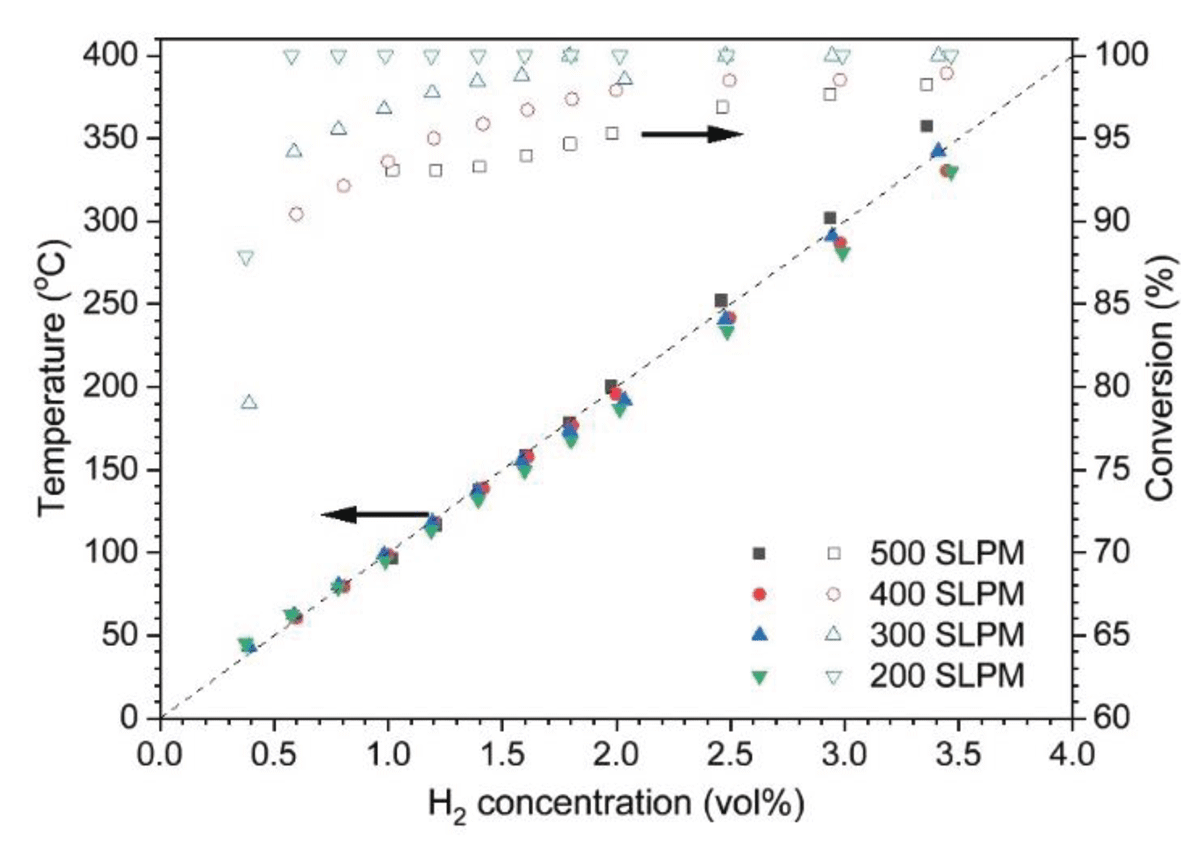
Figure 10
Monolith-type recombiner catalyst performance as a function of inflow H2 concentration.
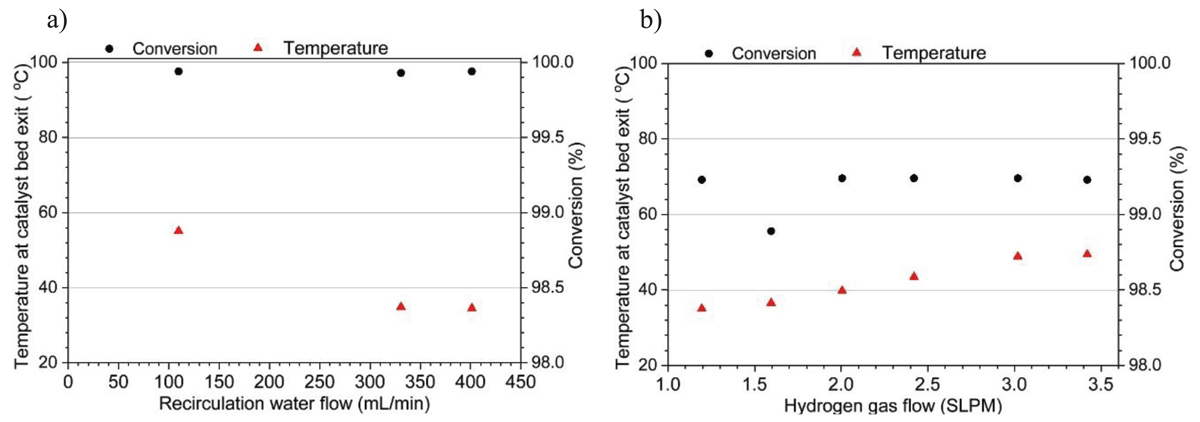
Figure 11
Trickle-bed recombiner catalyst performance as a function of (a) recirculation water flow (series 1 tests) and (b) H2 gas flow (series 2 tests).