
1. Introduction
There is a growing interest in the use of hydrogen (H2) as a clean and versatile energy carrier instead of fossil fuels to reduce greenhouse gas emissions. H2 can be converted to thermal energy by combustion or produce electricity through fuel cells. When H2 gas is oxidized with air on a heterogeneous catalyst surface, the process is referred to as catalytic H2 combustion (CHC) (Kim et al., 2021). The role of the catalyst is to increase the rate of oxidation by lowering the activation energy (Saint-Just and Etemad, 2016). The CHC-based technology has attracted interest in numerous engineering applications, including heat production (Saint-Just and Etemad, 2016, Wang et al., 2016), burners and cookers, gas purification (Kim et al., 2022), leak detection (Kalinin et al., 2024), and the elimination of undesired H2 in severe accidents of nuclear power plants (Zhang et al., 2024, NEA, 2014). If H2 is utilized as an energy carrier on a large scale, safety issues related to its use must be considered. CHC, characterized by its enhanced efficiency and safety, has emerged as a potential strategy to mitigate the H2 risk (Zhang et al., 2024).
Compared to traditional flame-based combustion, catalytic combustion, known as “flameless,” presents several advantages, including reduction in pollutant emissions (i.e., nitrogen oxides [NOx]), combustion with lean gas mixtures, and enhancement of flame stability and efficiency (Kim et al., 2021). At stoichiometric concentrations in air, all common fuels, including H2, have adiabatic flame temperatures close to 2,000°C, resulting in the formation of NOx from the oxidation of nitrogen in the air (Saint-Just and Etemad, 2016). High flame velocity can also induce flashback, which can occur in premixed burners when the flame velocity is greater than the flow rate of the burning mixture, causing damage to the burners (Kim et al., 2021). It has been shown that ultra-low NOx emissions and elimination of flashback can be achieved by lowering the reaction temperature of CHC, improving flame stability to a greater extent than conventional combustion (Kozhukhova, Du Preez and Bessarabov, 2021, Nguyen et al., 2018). The risk of blow-off, for instance, flame extinguished due to the high fuel flow speed required for H2 combustion, can also be eliminated (Kozhukhova, Du Preez and Bessarabov, 2021). In addition, for residential applications, such as domestic cooking gas burners, the invisible H2 flame is a safety concern, but CHC can provide a solution with catalytic material that would glow proportionally to the burner temperature (Saint-Just and Etemad, 2016). Low-temperature CHC is also favorable for residential heat supply, where high temperatures are unnecessary (Wang et al., 2016).
CHC has been the subject of numerous scientific investigations with significant advances achieved in recent years through fundamental and applied research. Comprehensive reviews of catalyst materials and CHC applications are provided elsewhere (Kozhukhova, Du Preez and Bessarabov 2021, Kim et al., 2021; Zhang et al., 2024). As reported, noble metals, such as platinum (Pt) and palladium (Pd), have a high adsorption capacity for H2 and oxygen (O2) at low temperatures (Nguyen et al., 2018). It is also known that conventional catalysts can be deactivated by water if exposed to liquid or saturated vapor. In 1969, Stevens (Stevens, 1972) discovered a method for protecting catalysts from water deactivation, which has led to the development and lifetime testing of wetproofed catalysts at Canadian Nuclear Laboratories (CNL, formerly Atomic Energy Canada Limited [AECL]). Unlike conventional catalysts, wetproofed catalysts maintain their activity in the presence of liquid water or humid gases. These catalysts have been applied in three CNL-designed recombiners: the passive autocatalytic recombiner (PAR), the gas phase recombiner (GPR), which is a monolith-type recombiner, and the trickle-bed recombiner (TBR). Schematics of these recombiners are shown in Figure 1.
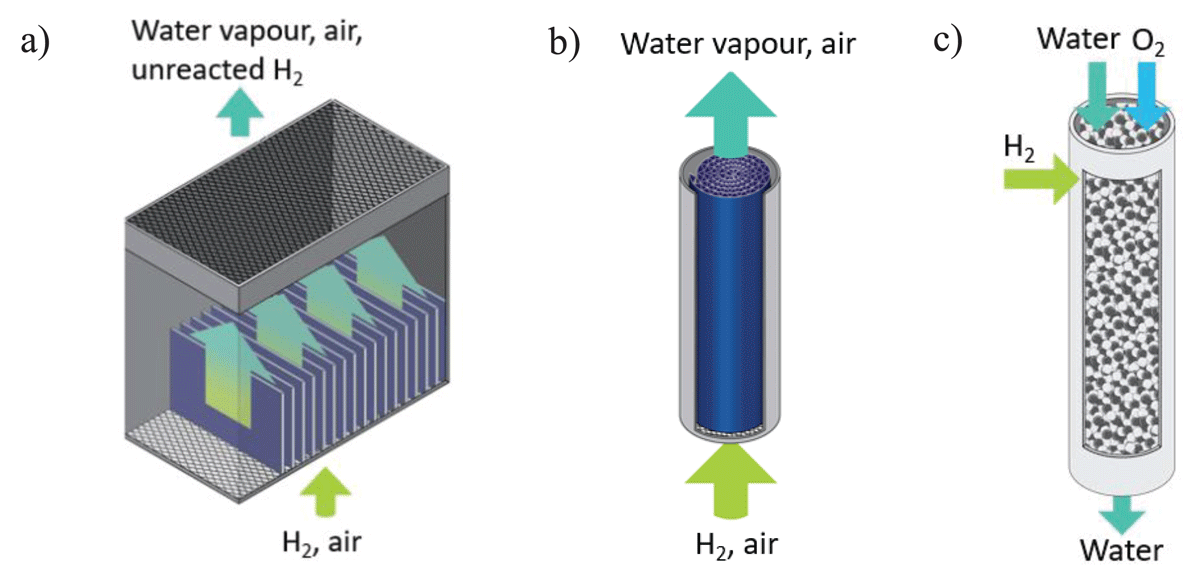
Figure 1
Schematics of three types of CNL-designed catalytic H2 recombiners: (a) passive autocatalytic recombiner, (b) gas phase recombiner, and (c) trickle-bed recombiner.
PARs are designed to use the heat of catalytic oxidation of H2 with O2 (from the air) to form hot steam that drives flow through the PAR housing by natural convection. CNL’s PAR utilizes the plate-type catalyst elements arranged in a rectangular open-ended housing (Figure 1a). Because of their passive self-start and self-sustained flows, they do not require outside power or operator actions. Hence, the installation of PARs has become a primary choice of mitigation measures for H2 management in most countries (NEA, 2014). The operating characteristics of PARs and their impact on H2 behavior in nuclear containments have been comprehensively reviewed elsewhere (Man et al., 2025). During the 1980s and 1990s, extensive PAR testing was conducted in various experimental facilities to evaluate the performance of different designs and to qualify PARs for installation in nuclear power plants (Bachellerie et al., 2003). PARs are also applicable for H2 removal in other places, such as battery rooms and underground mines, where H2 can accumulate due to operational or accidental releases (Kozhukhova, Du Preez and Bessarabov, 2021). The H2 recombination rate of PARs is ultimately subject to mass transfer limitations, so PARs are not suitable for fast-accumulating scenarios (Liang et al., 2016). In addition, the catalysts can become a source of ignition at H2 concentrations greater than 6 vol.%, although the combustion can be mild with such lean mixtures (Gardner et al., 2021a).
CNL’s GPR module consists of smooth and corrugated plates that are stacked, rolled, and compressed to form a monolithic structure (Figure 1b). Monoliths are typically characterized by the shape of their channels, their cell density (commonly expressed as the number of cells per cross-sectional area), and their wall thickness. Nguyen et al. (2018) performed experiments using a honeycomb monolith reactor and reported that the conversion of H2 improves with increasing inlet H2 concentration but declines as the flow rate increases. Battistella et al. (2024) investigated the performance of a Pt- and Pd-based catalytic honeycomb monolith (30 mm long, 62 cells/cm2) under inlet velocities ranging from 6.2 to 9 m/s with ultra-lean H2–air mixtures (1.5–3% H2). They also observed that conversion decreases as inlet velocity increases, while it increases with higher H2 inlet fraction. GPR technology can also be used for heat generation. For example, Giacomini has commercialized H2-powered domestic boilers based on the CHC technology (Giacomini, Via and Giulio, 2006).
CNL’s TBR is packed with a mixture of wetproofed catalysts and inert hydrophilic particles in the form of small spheres (Figure 1c). In this arrangement, water trickles down through the catalyst bed co-currently with the gases and removes the heat of the recombination reaction, providing direct contact cooling to the bed. The wetproofed catalysts enable the recombination of pure H2 streams at much lower temperatures, less than or equal to 80°C, (Chuang et al., 1986). As a result, catalyst bed temperatures are easily controlled, enhancing overall system safety by minimizing temperature cycling. The presence of liquid water also prevents the flashback and spurious explosions caused by the transport of dry catalyst dust to other parts of the system. The TBR has been used for the conversion of deuterium gas to heavy water (Quaiattini et al., 1987) and for detritiation processes for pressurized heavy-water nuclear reactors (Suppiah et al., 2010).
This paper presents select experiments conducted with these three types of recombiners in different experimental systems and under a range of conditions. Their recombination characteristics (self-start threshold, recombination efficiency, and capacity), potential applications, and limitations are discussed.
2. Experimental Methods
2.1 Catalyst and performance characteristics
The wetproofed catalysts used in the experiments discussed in this paper have proprietary CNL formulations, consisting of noble metal(s) dispersed on a porous support with large surface area using a proprietary procedure. As the catalysts are wetproofed, they repel water, but H2 and O2 can still diffuse to the catalyst active sites for the recombination to occur. The metal-support matrix is bound to a stainless-steel mesh, creating robust catalyst plates used for PARs and monolith modules for GPRs. A similar catalyst material is coated on ceramic spheres for TBRs. The catalysts in PARs and GPRs can operate for short periods at temperatures up to 750°C without loss of catalytic activity and are not affected by high radiation exposures (crucial for nuclear applications).
PARs normally self-start with less than 2.0 vol.% H2 in air in a steam-saturated atmosphere at 15°C or lower, and self-stop with less than 0.5 vol.% H2 (Liang et al., 2016). The self-start concentration is lower at elevated ambient temperatures because of the increased kinetic rate of reaction at the catalyst (Gardner et al., 2021a). Under forced flow conditions for GPRs and TBRs, recombination can start at extremely low concentrations, such as ppm levels.
Conversion (X), also known as recombination efficiency (in %), is calculated as the H2 concentration difference between the inlet (Cin) and outlet (Cout), normalized by the inlet concentration (in vol.%):
The recombination rate (or capacity) can be determined based on the H2 concentration difference between the inlet and outlet, and the inlet mass flow rate:
where M is capacity (kg/h), P is pressure (Pa), Tin is inlet temperature (K), RH2 is specific gas constant for H2 (4124 J/kg K), Vin is inlet flow velocity (m/s), and Ain is inlet cross-sectional area (m2).
For the CNL-designed thirty-one (31) plate standard PAR, a correlation for the capacity is defined as a function of pressure, temperature, and inlet H2 concentration:
The capacity for the standard PAR is approximately 0.81 kg/h at 4 vol.% H2, 100 kPa, and 25°C. Equation 3 is applicable for conditions with sufficient O2.
2.2 Test facility for full-size PARs
CNL’s standard PARs were tested in the large-scale vented combustion test facility (LSVCTF). The LSVCTF was a rectangular chamber with an internal volume of 120 m3, but only the front chamber (~57 m3) was used in the tests presented in this paper by blanking off the rear chamber with a central wall (Figure 2a). The PAR housing is an open-ended rectangular box with a triangular-shaped hood fabricated from stainless steel. The cover and gratings provide physical protection to the internal plates. The PAR unit was located near the center of the front chamber on a floor-mount support. The 31 catalyst plates were installed vertically at the bottom of the PAR housing with a spacing of 2 cm (Figure 2b).
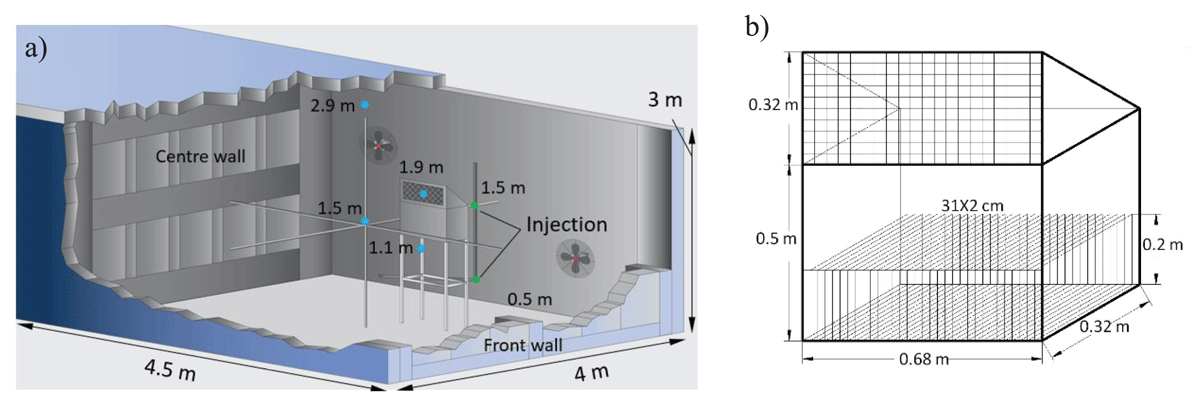
Figure 2
Schematic of the LSVCTF showing (a) front chamber dimensions, gas sampling (blue dots) and injection locations (green dots) and (b) standard PAR unit dimensions.
H2 was injected from the side wall at different elevations (green dots in Figure 2a). The four hydraulic fans in the front chamber were either turned on at a speed of 400 rpm or off during a test. The gas composition was analyzed by a ThermoFisher 32-channel process mass spectrometer (uncertainty of ±0.2 vol.% H2). The gas was sampled sequentially with an interval of ~2 min at several locations (blue dots in Figure 2a). The catalyst temperatures were recorded using Type-K thermocouples (uncertainty of ±2°C; may be higher for catalyst temperatures because of the unknown effect of contact on the catalyst plates).
2.3 Test facility for small-scale PARs
Small-scale PARs were tested in the hydrogen safety test facility (HSTF). The HSTF is a spherical structural steel pressure vessel with a diameter of 0.76 m and an internal free volume of 0.25 m3. The facility is equipped with vacuum and venting (discharge vessel contents) capabilities, heating, gas supply, and a mixing fan. The PAR housing and the catalyst plate were reduced by a factor of 5 from the standard PAR. The scaling parameters were discussed in Gardner et al. (2021b). The dimensions of the scaled-down PAR and the locations of the gas samples (blue dots), thermocouples (red dots), and injection (green arrows) are shown in Figure 3. Fifteen (15) catalyst plates were installed vertically (1 cm spacing).
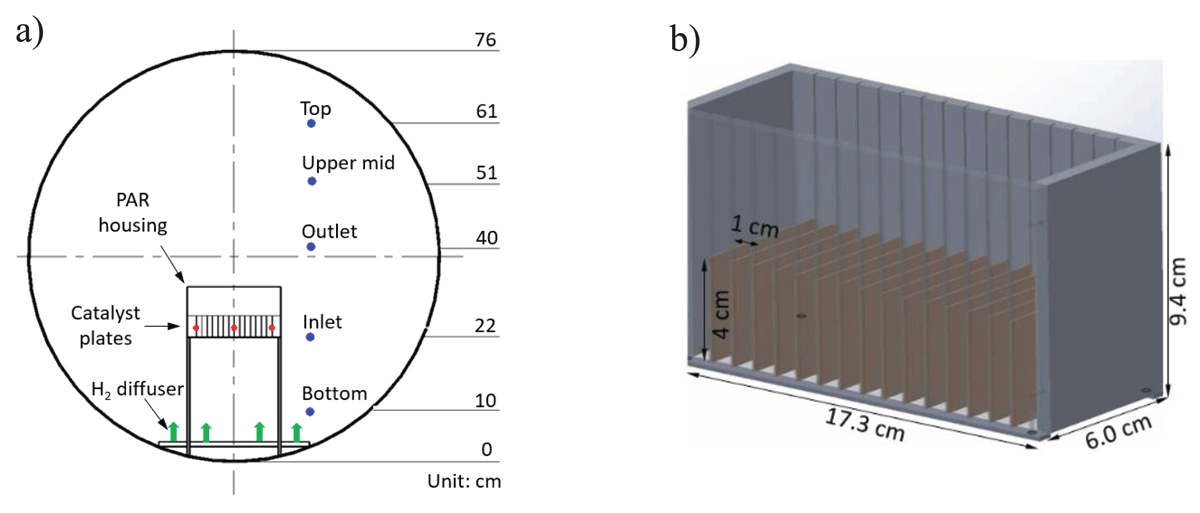
Figure 3
Schematic of the HSTF showing (a) vessel dimensions, gas sampling, temperature measurement, and injection locations and (b) 1/5th scale PAR dimensions.
H2 was injected at the bottom of the vessel through an “H” shape diffuser with twenty 3-mm diameter holes drilled along the pipe. The H2 concentration was measured by five XEN-5320 sensors, developed by Xensor Integration (uncertainty of ±0.1 vol.% H2), installed in the vessel (Figure 3a). The gas composition (H2 and O2) at the vessel’s upper mid-height was analyzed using a NOVA Analytical Systems Model 975P AM analyzer with an uncertainty of 1–1.5% within the 0–15 vol.% H2 range. The temperatures at each gas sampling location and center of three catalyst plates were recorded using Type-K thermocouples (same uncertainty as the LSVCTF tests). The static vessel pressure was measured using a Druck UNIK 5000 series transducer with an uncertainty of ±0.04% within 0–345 kPa range.
2.4 Test facility for monolith-type GPR
A schematic representation of the monolith-type GPR test system is shown in Figure 4a. The main component of the test rig is a stainless-steel tube (2.3 cm inner diameter, 33.0 cm long), where the catalyst module (2.2 cm outer diameter, 20.0 cm long) is friction-fit in the tube. As shown in Figure 4b, the module has triangular channels with approximately 18 cells/cm2. The tube is insulated with quartz wool along its length. The feed gases are pre-mixed in a mixing vessel prior to entering the reactor. The outlet gases are exhausted through a venting system. The performance of the catalyst module is measured by analyzing both the inlet and outlet gas concentrations using an Agilent 6890N Gas Chromatograph, which provides a low detection limit of 300 ppm and an accuracy of ±0.1 vol.%. A 10-point K-type thermocouple was inserted inside the module to measure both the catalyst and gas temperatures. The reactor surface temperatures adjacent to the catalyst were also measured at three locations.
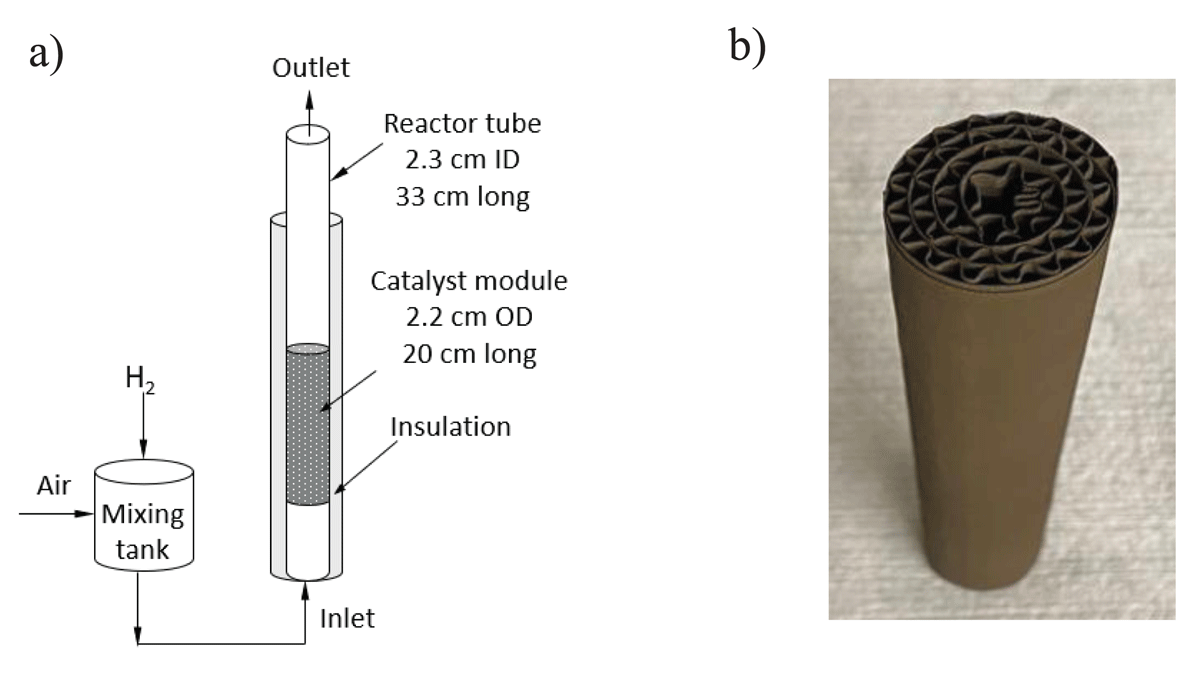
Figure 4
(a) Schematic of the monolith catalytic recombiner test setup and (b) photo of catalyst module.
2.5 TBR test facility
The performance of TBR catalysts was evaluated using the test system shown in Figure 5a. The main components of this system include (a) the TBR reactor, which consists of two vessels, packed catalytic bed, and water collector; (b) gas supply system; (c) recirculation water system; and (d) gas monitor and analyzer systems. The packed bed vessel is a stainless-steel tube of 5.1 cm outer diameter, and 54.5 cm long, which has 12 penetrations with six along the bed for thermocouples (Figure 5b). The H2 gas enters the catalytic bed through a horizontal distributor. Deionized water and O2 enter the vessel from the top. Unreacted gas exits from the side of the collector vessel. Excess water can flow into a liquid drainer. The cooling water is recirculated through a heat exchanger and a water pump. The H2 concentration in the unreacted gas is monitored by a thermal conductivity transmitter (Model XMTC-62-11). In the present tests, approximately 750 g of TBR catalyst was used, producing a catalytic bed height of ~30.8 cm. The catalytic bed included a 50% mix of coated catalyst with uncoated inert spheres for a better heat distribution while optimizing the catalyst activity. The initial temperature of the bed was maintained at 25°C by the feed water. The system pressure was kept below 30 kPa(g).
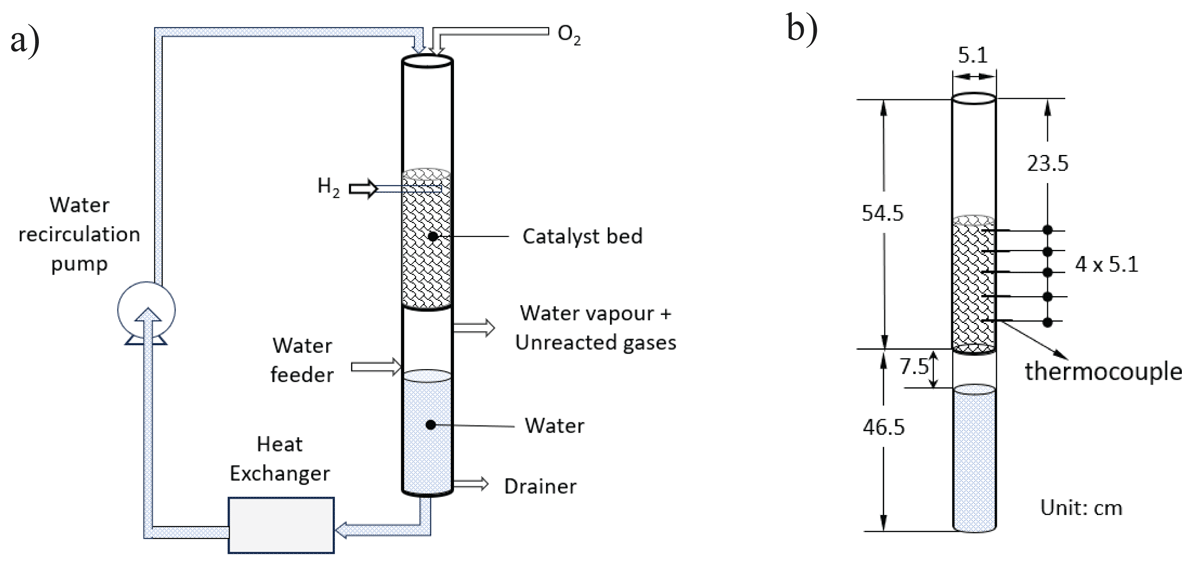
Figure 5
(a) Schematic of the trickle-bed recombiner test setup and (b) reactor dimensions and thermocouple locations (dots).
3. Experimental Results
3.1 PAR tests
3.1.1 Full-scale PAR tests in LSVCTF
The test conditions and data of the standard PAR tests conducted in the LSVCTF are shown in Table 1. The purpose of these tests was to demonstrate the long-term PAR operation with continuous H2 release in a semi-confined space. The test chamber was not leak-tight, so gas exchange between the outdoor air occurred during the tests, and the chamber was maintained at atmospheric pressure. The leakage was monitored using helium as a tracer and found to be less than 3% of the H2 injection rate. H2 was injected at a constant rate until a steady state was reached.
Table 1
Test conditions and data of standard full-scale PAR
| TEST ID | INJ. RATE (kg/h) | INJ. ELEV. (m) | FANS | STEADY-STATE PARAMETERS | |||||
|---|---|---|---|---|---|---|---|---|---|
| INLET H2 (vol.%) | OUTLET H2 (vol.%) | INLET GAS T (°C) | CATALYST T (°C) | EFF. (%) | CAPACITY (kg/h)(1) | ||||
| PAR1-1 | 0.111 | 0.5 | OFF | 0.92 | 0.29 | 29.3 | 140.0 | 68 | 0.147 |
| PAR1-2 | 0.109 | 1.5 | OFF | 0.85 | 0.23 | 28.7 | 138.0 | 73 | 0.134 |
| PAR1-3 | 0.109 | 0.5 | ON | 1.03 | 0.30 | 34.6 | 141.2 | 71 | 0.162 |
| PAR1-4 | 0.187/0.056 | 0.5 | ON/OFF | 0.81 | 0.36 | 27.5 | 91.2 | 56 | 0.129 |
| PAR1-5 | 0.179/0.029 | 0.5 | ON/OFF | 0.67(2)1.01 | 0.670.26 | 26.528.3 | 29.0–156.5 | 074 | 00.162 |
[i] (1)Capacity was calculated using Equation 3 based on the measured inlet H2%, gas temperature, and vessel pressure.
(2)The top row shows the peak values, while the bottom row shows the lowest values.
The measurements of four LSVCTF tests are shown in Figure 6 and Figure 7. Time zero of these plots corresponds to the start of H2 injection. In test PAR1-1 (Figure 6a), H2 was injected at 0.5 m elevation with fan off, resulting in a weakly stratified H2 distribution (~1.7 vol.% H2 at 1.1 m height, 3.2 vol.% H2 at 2.9 m height) prior to the PAR self-start. At t = 40 min, the outlet H2 concentration began to decrease, indicating the start of PAR operation. At this time, the H2 concentration was approximately 0.8 vol.% at the inlet and 1.9 vol.% at the outlet. The temperature of the instrumented catalyst plate (thermocouples were only attached on three plates) started to increase at t = 55 min and continued to increase until it peaked at 268°C. In this period, the PAR capacity also continuously increased and exceeded the injection rate at the peak, resulting in the subsequent decrease in the H2 concentrations at all levels. By t = 85 min, the gas inside the test chamber was homogenized except at the PAR outlet due to the recombination, and the gas concentrations and temperatures reached a steady state (Table 1). During the steady-state period, the H2 concentration varied around 1 vol.% at most sampling locations, with 1.5 vol.% at the 1.5 m height, and 0.29 vol.% at the outlet. The maximum catalyst temperature was approximately 140°C, whereas the bulk gas temperature was less than 30°C. The recombination efficiency was approximately 70%, similar to other studies (Liang et al., 2016). The average PAR capacity calculated by Equation 3 was higher than the injection rate, suggesting that the actual PAR capacity was lower than the calculated value, based on the mass balance (see further discussions in Section 3.1.3).
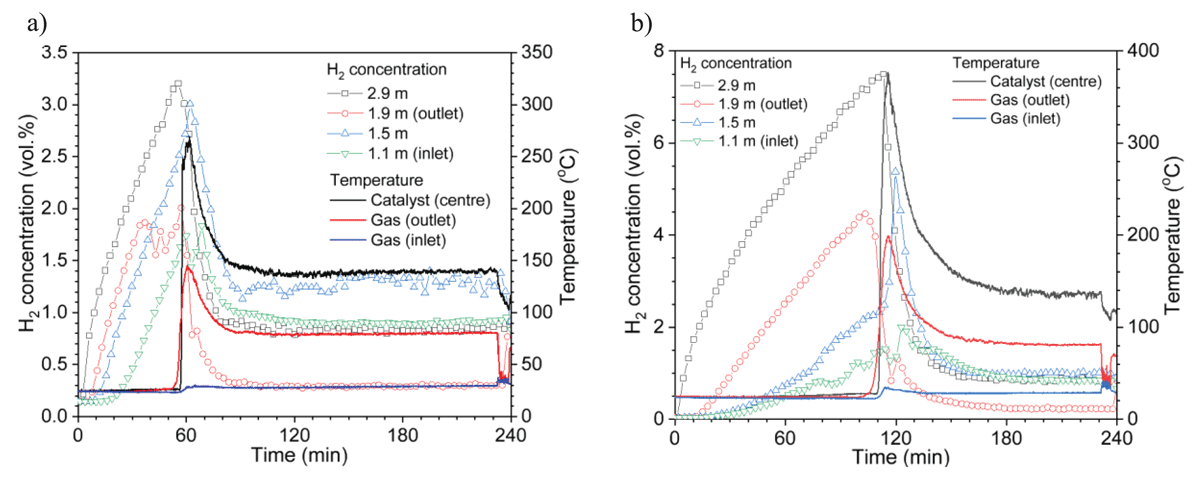
Figure 6
Time history of H2 concentrations and temperatures at an injection rate of 0.1 kg/h with fan off: (a) PAR1-1 (injection at 0.5 m height) and (b) PAR1-2 (injection at 1.5 m height).
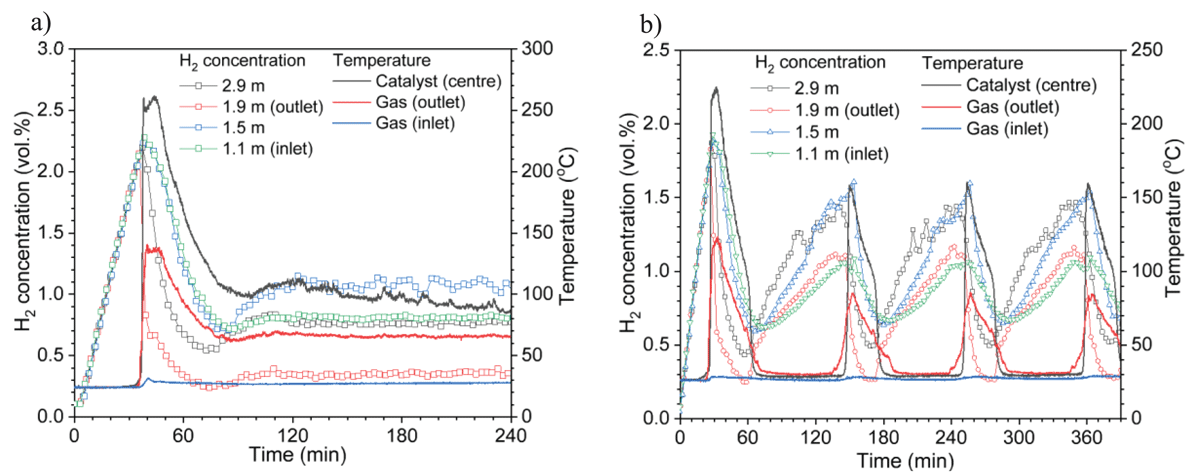
Figure 7
Time history of H2 concentrations and temperatures of LSVCTF tests: (a) PAR1-4 (0.056 kg/h injection) and (b) PAR1-5 (0.03 kg/h injection).
Test PAR1-2 (Figure 6b) was operated similarly to test PAR1-1 except that the injection nozzle was moved up to 1.5 m height. As expected, H2 stratification was greater, peaking at ~7.5 vol.% at 2.9 m height (ceiling) and 1.5% at 1.1 m height (inlet). After t = 115 min, the H2 concentrations at 1.9 m (outlet) and 2.9 m started to decrease rapidly, while they increased to 5.3 vol.% momentarily at 1.5 m, indicating the change in the flow pattern induced by the PAR operation. In the meantime, the catalyst temperature on the instrumented plate started to increase sharply and peaked at 377°C. By t = 160 min, the gas inside the test chamber was homogenized, reaching a steady-state value similar to test PAR1-1 (Table 1). Test PAR1-3 is not presented in this paper; however, its steady-state values are almost the same as the above two tests (Table 1), suggesting that the level of turbulence induced by the fans had no impact on the PAR function.
In test PAR1-4 (Figure 7a), H2 was injected at 0.19 kg/h with fans on until the PAR self-started; then, the injection rate was reduced to 0.053 kg/h, and the fans were turned off. The PAR self-started at t = 33 min when both the inlet and outlet H2 concentrations reached ~2.0 vol.%. The catalyst temperature peaked at 261°C at t = 44 min. The higher self-start threshold was caused by the fast injection and operation of the fans. Once the fans were turned off, the H2 concentrations at all elevations started to decrease immediately, reaching a steady state. During the steady-state period, the H2 concentration was less than 0.8 vol.% at most locations. In test PAR1-5 (Figure 7b), H2 was also injected at 0.19 kg/h with fans on until the PAR self-started; then, the injection rate was reduced to 0.03 kg/h, and the fans were turned off. The catalyst temperature started to increase at t = 15 min when both the inlet and outlet H2 concentrations exceeded 1.0 vol.% (Figure 7b). The catalyst temperature then peaked at 240°C at t = 32 min. At t = 60 min, the catalyst temperature started to drop faster, reaching ambient temperature at approximately 70 min, and the inlet H2 concentration decreased to 0.6 vol.%, indicating that the PAR stopped operating. At t = 142 min, the PAR re-started when the inlet H2 concentration increased back to 1.0 vol.%. The PAR operation cycled on and off for the remainder of the test.
The above tests demonstrated that the recombiner can operate in two distinct modes: steady state or cycling. If the injection rate is lower than the recombiner capacity at its lowest operation level (e.g., 0.6 vol.% H2), the recombiner will operate intermittently between the thresholds at which it abruptly self-starts and self-stops (see Figure 7b). If the injection rate matches the recombiner capacity at a given H2 concentration, a steady-state can be reached with the bulk gas concentration maintained at the same H2 concentration (see Figure 6 and Figure 7a).
3.1.2 Small-scale PAR tests in HSTF
The conditions and data of six small-scale PAR tests conducted in the HSTF are shown in Table 2. The purpose of these tests was to demonstrate the long-term PAR operation under continuous H2 release in a leak-tight volume. All tests were performed at an initial temperature of 25°C and an initial pressure of 115 kPa.
Table 2
Technical conditions and data of a 15-plate small-scale PAR.
| TEST ID | INJECTION RATE (kg/h)(1) | PARAMETERS AT THE START OF THE QUASI-STEADY STATE | |||||
|---|---|---|---|---|---|---|---|
| INLET H2 (vol.%) | O2(2) (vol.%) | INLET GAS T (°C) | CATALYST T (°C) | VESSEL P (kPa)(2) | CAPACITY, M (kg/h)(3) | ||
| PAR2-1 | 0.0049 | 0.98 | 18.3 | 26.9 | 145.6 | 100.4 | 0.0053 |
| PAR2-2 | 0.0147 | 2.42 | 19.1 | 34.1 | 306.6 | 111.7 | 0.0152 |
| PAR2-3 | 0.0245 | 3.61 | 17.6 | 36.7 | 411.0 | 112.5 | 0.0244 |
| PAR2-4 | 0.0344 | 4.78 | 17.2 | 49.4 | 517.9 | 112.2 | 0.0331 |
| PAR2-5 | 0.0393 | 5.49 | 15.7 | 50.9 | 582.2 | 113.3 | 0.0397 |
| PAR2-6 | 0.0442 | 6.25 | 14.7 | 57.6 | 616.1 | 112.4 | 0.0458 |
[i] (1)The injection rates, expressed in standard litres per minute (SLPM) at a temperature of 25°C and absolute pressure of 1 atm, are 1, 3, 5, 7, 8, and 9, respectively.
(2)O2 concentration and vessel pressure decreased continuously during the steady-state period.
(3)The capacity was calculated using Equation 3 and scaled down by a factor of 30.
The time histories of gas concentrations and temperatures for tests PAR2-1 and PAR2-3 are shown as an example in Figure 8. As expected, the H2 was weakly stratified in the vessel, and the stratification was larger at higher flow rates. Similar to the LSVCTF tests, the H2 concentration measured at the top was always the highest during the initial release. The catalyst temperature started to increase once the H2 concentration at the elevation of the PAR inlet exceeded ~0.6 vol.%. After the H2 concentrations and temperatures reached a peak, they gradually decreased to reach a steady state. During the steady-state period, the H2 concentration was relatively uniform at low injection rates but weakly stratified at high injection rates. Due to the continuous consumption of O2, its concentration gradually decreased during the tests. In the meantime, the vessel pressure also decreased due to several factors, such as steam condensation, reduction in the number of moles of gas during oxidation, and gas sampling. When the O2 concentration became less than 1 vol.% (Figure 8b), the H2 concentrations started to increase, and the catalyst temperature started to decrease, suggesting that PAR operation stopped due to the limiting O2 concentration. It should be noted that the H2 concentrations at the “outlet” are not shown in the plots nor listed in Table 2. The gas sampling was not located above the catalyst plates but on the side of the PAR housing. Due to limitations in the sensor placement, the recombination efficiency could not be evaluated.
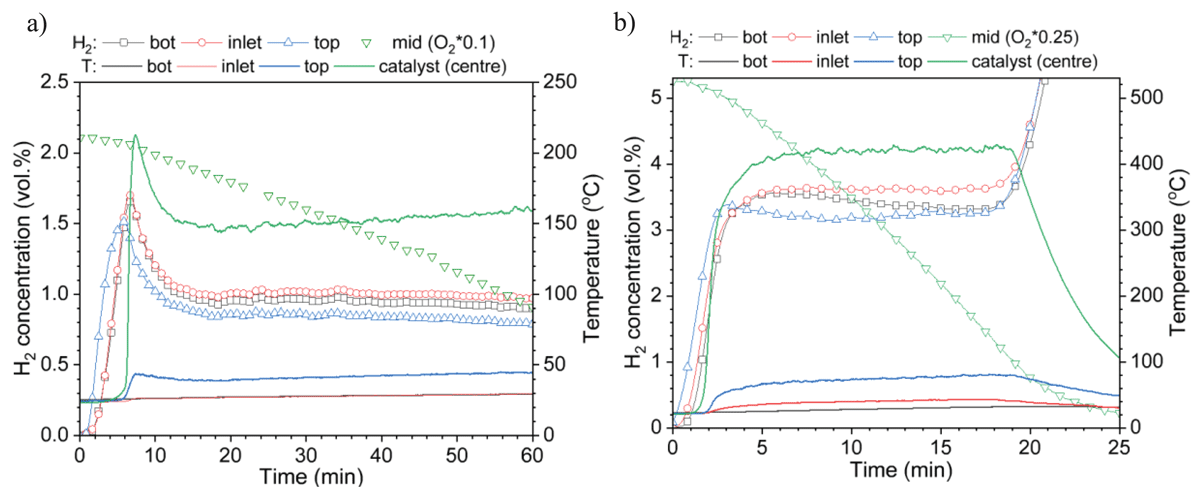
Figure 8
Time history of H2 concentrations and temperatures of HSTF tests: (a) PAR2-1 (1 SLPM) and (b) PAR2-3 (5 SLPM).
3.1.3 Comparison and discussion
The recombiner capacity is expected to match the H2 injection rate, subtracting the H2 loss due to leaks or sampling. However, the PAR capacities of the LSVCTF tests calculated using Equation 3 were consistently higher than the injection rates (Table 1), suggesting that the actual PAR capacity could be reduced under such an operating mode. On the other hand, the recombiner capacities of the HSTF tests calculated using Equation 3, and scaled down by a factor of 30, match the H2 injection rates well (Table 2). Considering that the total catalytic surface of the small-scale PAR is approximately 52 times smaller than that of the full-size PAR, the small one seems to perform “better.” This trend could be attributed to the H2 release below the PAR in the HSTF, assisting in the PAR-generated convective flow.
Figure 9 shows the relationship between the steady-state maximum catalyst temperature and inlet H2 concentration for the tests listed in Table 1 and Table 2, and other LSVCTF data. All the test data in Figure 9 follows the same trend, showing that the increase in the catalyst temperature is approximately 100°C for every 1 vol.% H2 increase (dotted line). This relationship is consistent with the recombiner performance evaluated with pre-defined H2 concentrations (Gardner et al., 2021a; Liang et al., 2016). At a given H2 concentration, the catalyst temperature of the large-scale PAR remains higher than the small-scale PAR, which has overall lower heat release and less mass to retain the heat. Nevertheless, the PAR characteristics (e.g., self-start threshold and recombination rate) are similar between the small-scale and large-scale tests, suggesting that PAR can be properly sized based on the H2 leak rates and volume of the area where H2 may accumulate.
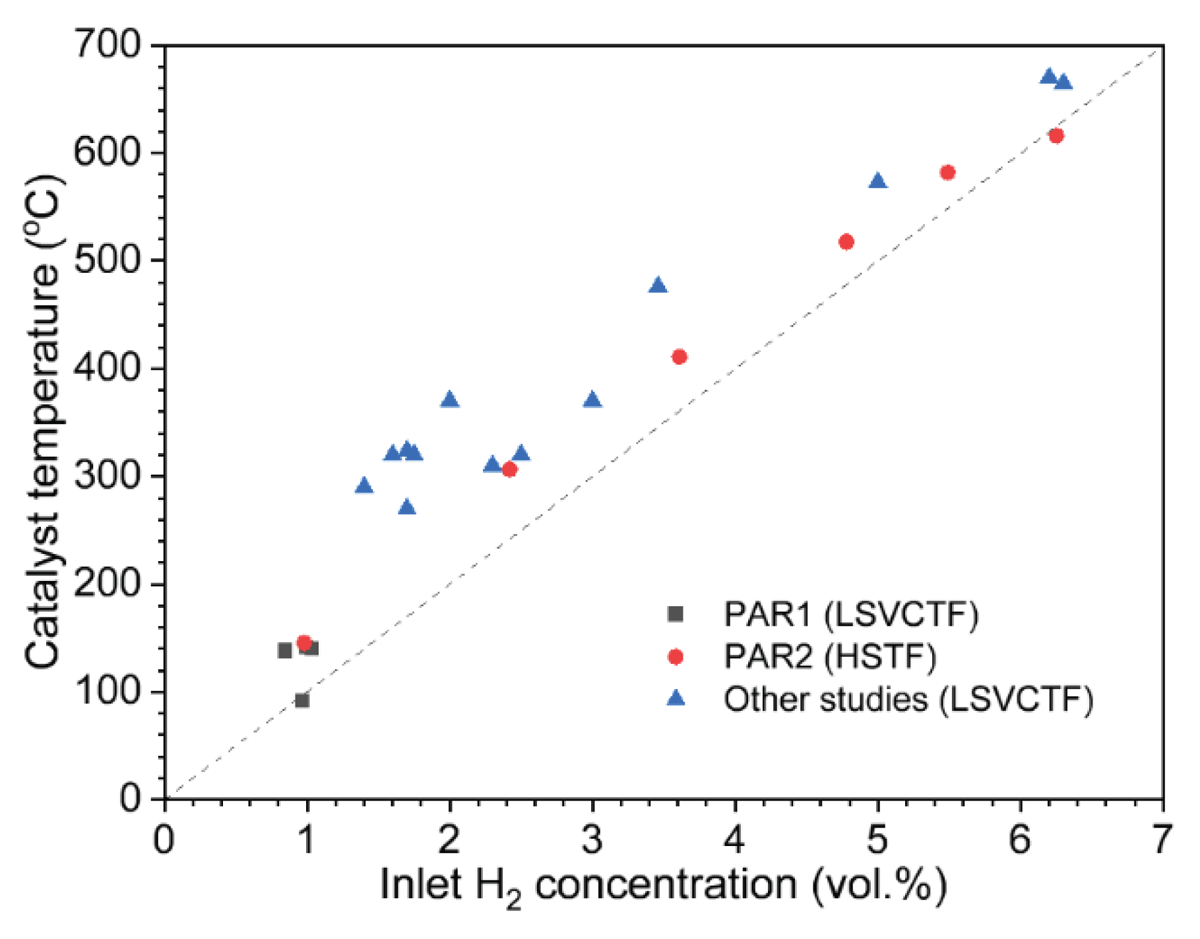
Figure 9
Relationship of steady-state inlet H2 concentration and maximum catalyst temperature.
For the LSVCTF tests, at an injection rate of 0.111 kg/h (~22.2 SLPM), the average H2 concentration is expected to increase at 2.3 vol.% per hour in the 57 m3 chamber, and therefore, the gas mixture would become flammable in 1.7 h. For the HSTF tests, at injection rates between 0.0049 and 0.0442 kg/h (1 to 9 SLPM), the average H2 concentration is expected to increase at 0.4 to 3.6 vol.% per minute in the 0.25 m3 vessel, therefore the gas mixture would become flammable in 1 to 10 minutes. The tests have shown that the H2 concentration can be maintained at safe levels once the PAR starts operation. However, when the injection rates were higher than the recombiner capacity at the H2 concentration greater than the PAR-induced ignition threshold (e.g., 6–7 vol% H2), the surrounding gas could be ignited by the hot catalyst plates. For instance, ignition was observed at an injection rate of 10 SLPM or higher in the HSTF. Details on PAR-induced ignition can be found elsewhere (Gardner et al., 2021a).
3.2 Monolith GPR tests
The GPR experiments were conducted in the test system shown in Figure 4 to evaluate the performance of the monolith-type catalyst. The feed gas was maintained at approximately 25°C and supplied at flow rates of 200, 300, 400, and 500 SLPM, corresponding to flow velocities of 6.6, 9.9, 13.2, and 16.5 m/s, respectively, with inlet H2 concentrations ranging from 0 to 3.5 vol.%.
As shown in Figure 10, the catalyst became active when the inlet concentration was above 0.4 vol.% H2 for all flow rates. In addition, the conversion was greater than 90% for every flow rate and approached nearly 100% at a flow rate of 200 SLPM (corresponding to a flow velocity of 6.6 m/s). Across all the tests, the measured outlet H2 concentration remained extremely low (less than 0.1 vol.%). The conversion decreased with increasing flow rate and increased with higher inlet H2 concentration. This observation is consistent with Battistella et al. (2024). The maximum steady-state catalyst temperature showed a strong dependence on the inlet H2 concentration, rising by approximately 100°C for every 1 vol.% increase in H2, which is similar to the results from the PAR tests (Figure 9). The inlet H2 concentration was the most influential parameter affecting the catalyst temperature.
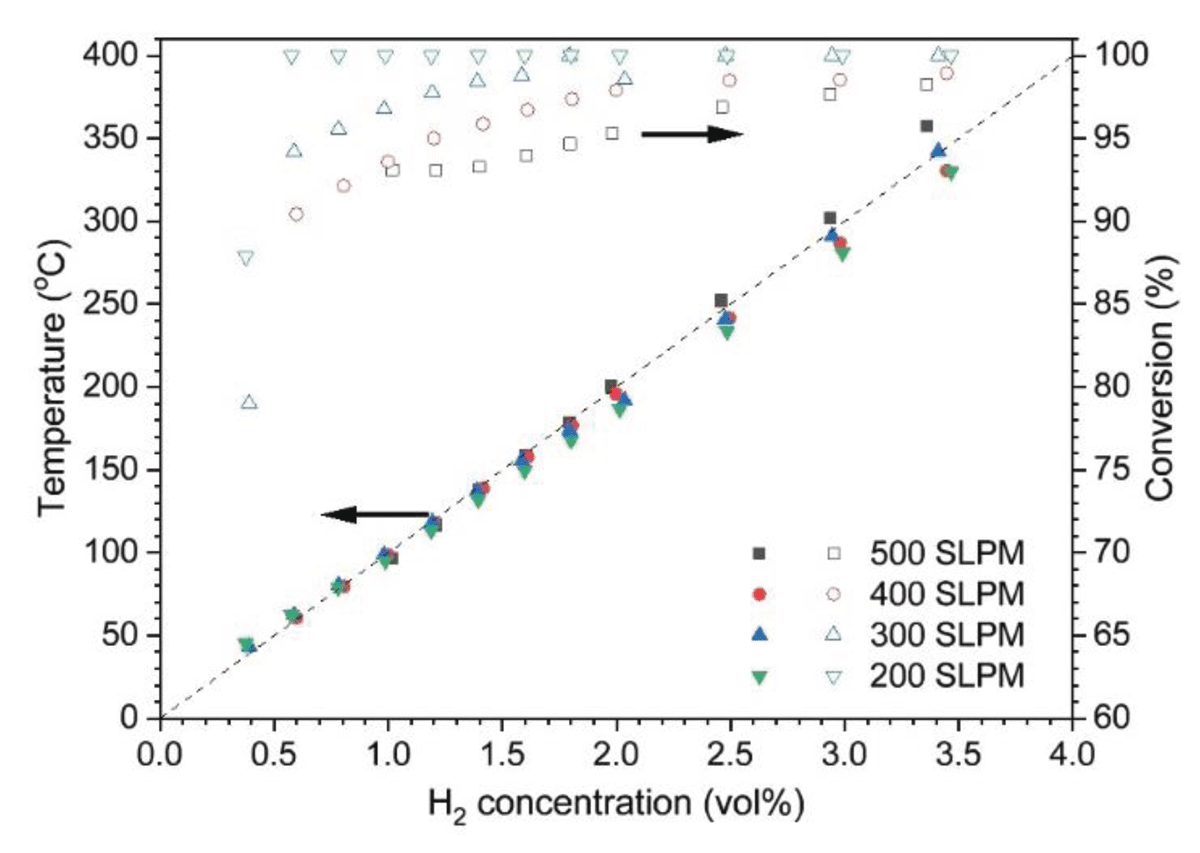
Figure 10
Monolith-type recombiner catalyst performance as a function of inflow H2 concentration.
3.3 TBR tests
Two series of TBR experiments were carried out in the setup shown in Figure 5. In the first series, the recirculation water flow rate was set at three different levels: 110, 330, and 400 mL/min, while the H2 and O2 flow rates were maintained at 1.2 SLPM and 0.65 SLPM, respectively. In the second series, the H2 flow rate was set at six different levels: 1.2, 1.6, 2.0, 2.4, 3.0, and 3.4 SLPM, and the O2 flow rate was chosen to be about 10% above the stoichiometric value, while the recirculation water flow was maintained at 400 mL/min. The temperature profile of the catalytic bed as a function of time was determined using a series of thermocouples located at 5 cm intervals along the catalytic bed. Experimental data at each one of the different conditions were obtained after at least two days of operation to allow for steady-state operation.
Figure 11a shows that the conversion marginally changed around 99.94% over the range of water flow used for the experiments when the H2 and O2 flow rates were maintained at 1.2 SLPM and 0.65 SLPM, respectively. As expected, a decrease in the temperature at the exit of the bed was observed when the water flow rate was increased from 110 to 400 mL/min. Figure 11b shows that the conversion was greater than 99% when the H2 flow rate was increased from 1.2 to 3.4 SLPM at a water flow rate of 400 mL/min. The temperature at the exit of the catalyst bed increased from 35°C to 49°C at the gas flow range studied. Overall, the high conversion of TBR makes it suitable for gas purification. In addition, the capability of the TBR to use high H2 concentrations allows to minimize the purge flow and quantity of catalyst.
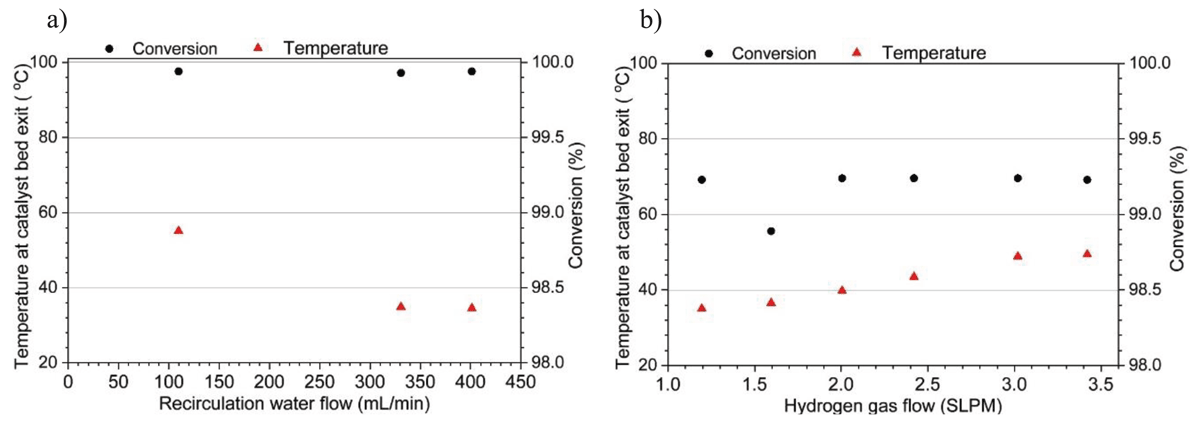
Figure 11
Trickle-bed recombiner catalyst performance as a function of (a) recirculation water flow (series 1 tests) and (b) H2 gas flow (series 2 tests).
4. Conclusions
The PAR tests showed that the unit can operate in two distinct modes during long-term H2 releases. When the H2 release rate matches the PAR capacity with sufficient air present, the system can reach a steady state, maintaining a low H2 concentration in the bulk gas. If the H2 release rate is much lower than the PAR capacity at 0.6 vol.% H2, the PAR can cycle on and off, keeping the H2 concentration well below the safe limit. However, if the H2 injection rate exceeds the PAR capacity at 6–7 vol.% H2, ignition may be triggered. Overall, the recombination efficiency of PARs is approximately 60–70% per path when sufficient air is available. Given their successful application in the nuclear industry, PARs can serve as an alternative or complementary method to ventilation for preventing H2 accumulation in confined spaces, particularly during loss-of-power scenarios.
The GPR tests showed that monolith catalysts can achieve over 90% conversion for H2 concentrations ranging from 0.5 to 4 vol.%. The catalyst temperature of 3.5 vol.% H2 exceeded 300°C, which can be sufficient for heating purposes with non-flammable gas mixtures. The catalyst kinetics determined from these tests have enhanced analytical models for catalyst sizing. The GPR has a low-pressure drop, leading to a better hydrodynamic performance of the reactor. They can be easily integrated with process streams, such as vent stacks, purge, or exhaust systems for H2 removal during operational or accidental releases. However, the operating temperature of GPRs must be kept less than the autoignition temperature (approximately 585°C). As a result, the H2 feed concentration is generally kept below the lower flammability limit of H2. The GPR technology can also be used to purify H2 produced through electrolysis, where O2 may cross over and contaminate the H2 stream. In such cases, the product gas can be passed through a GPR to remove O2.
The TBR tests demonstrated that H2 can be effectively removed (~100% conversion), making TBR suitable for purification of electrolytic H2 or O2 streams, and removal of airborne tritium at tritium extraction plants or fusion energy devices. Advantages of this type of recombiners include simple operation, low cost, suitability for industrial applications, and the high catalyst density achievable in a single packed-bed region. Its disadvantages include a relatively small available surface area, reduced temperature uniformity, and a high-pressure drop. Current research is focused on reducing the size of the recombination unit. While the performance tests performed on GPR and TBR discussed here were conducted at a small scale in the laboratory, both technologies have been deployed on an industrial scale in multiple applications over the past three decades.
Acknowledgements
The authors gratefully acknowledge the financial support from Atomic Energy of Canada Limited, under the auspices of the Federal Nuclear Science and Technology Program.