
Table 1
Experimental conditions of the MHTB tank.
| TEST # | INITIAL LIQUID FILL (%) | P1 (kPa) | TOTAL HEAT POWER (W) |
|---|---|---|---|
| 1 | 25 | 122.1 | 18.8 |
| 2 | 90 | 113.3 | 71.3 |
| 3 | 50 | 122.1 | 18.7 |
| 4 | 50 | 111.6 | 51.8 |
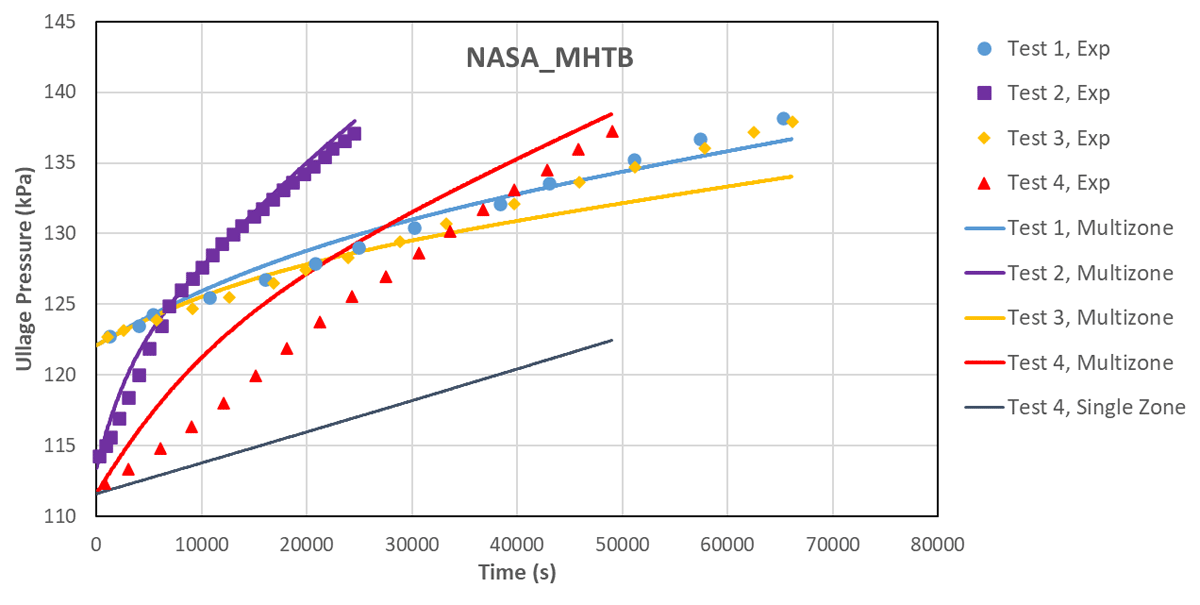
Figure 1
MHTB tank experiments and corresponding DISCHA simulations.
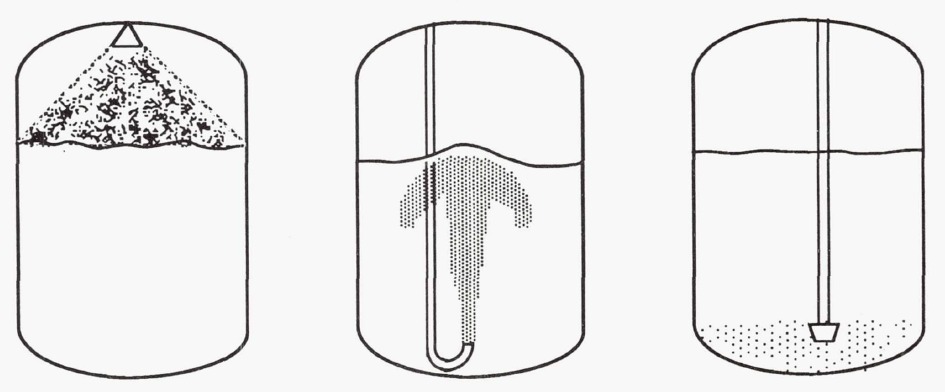
Figure 2
Fill configurations: top spray (left), upward pipe discharge (middle) and bottom diffuser (right) (Moran, et al., 1991).
Table 2
Top spray test conditions (1: supply tank, 2: receiver tank).
| TEST # | P1 (Pa) | T1 (K) | P2 (Pa) | T2 (K) | MFR (g/s) | INITIAL LIQUID FILL (%) |
|---|---|---|---|---|---|---|
| 9093A | 206843 | 17.9 | 26890 | 16.6 | 15.1 | 4.0 |
| 9094A | 206843 | 19.2 | 26890 | 16.6 | 27.2 | 0.0 |
| 9094B | 206843 | 19.3 | 24132 | 16.3 | 22.7 | 0.0 |
| 9094C | 206843 | 19.2 | 26890 | 16.6 | 17.4 | 0.0 |
Table 3
Bottom diffuser test conditions (1: supply tank, 2: receiver tank).
| TEST # | P1 (Pa) | T1 (K) | P2 (Pa) | T2 (K) | MFR (g/s) | INITIAL LIQUID FILL (%) IN RECEIVER TANK |
|---|---|---|---|---|---|---|
| 9088B | 206843 | 19.5 | 25511 | 16.5 | 11.3 | 4.0 |
| 9088C | 206843 | 19.5 | 20684 | 16.0 | 28.7 | 5.5 |
| 9081G | 206843 | 18.5 | 22753 | 16.2 | 31.8 | 8.0 |
| 9088G | 206843 | 18.1 | 23442 | 16.3 | 32.5 | 7.2 |
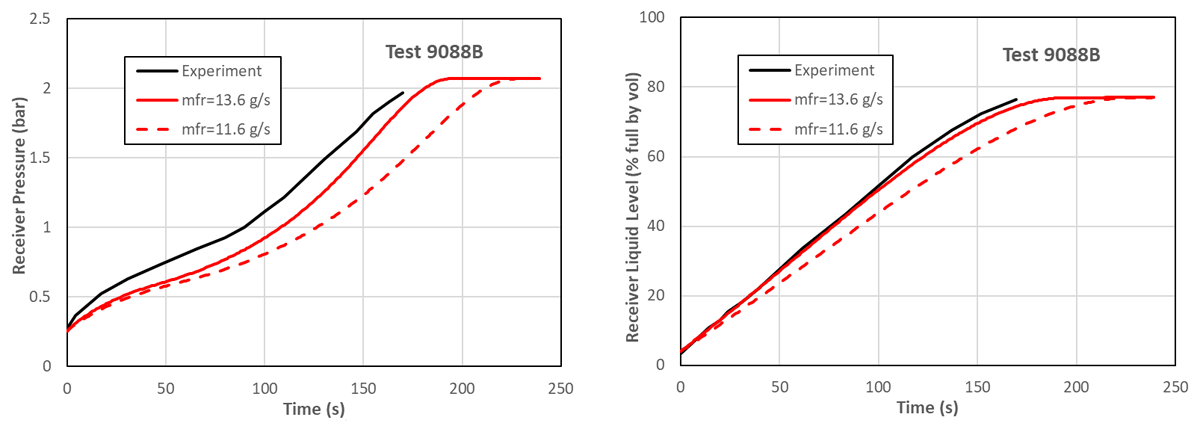
Figure 3
Test 9088B bottom diffuser filling. Experiment versus DISCHA simulations.
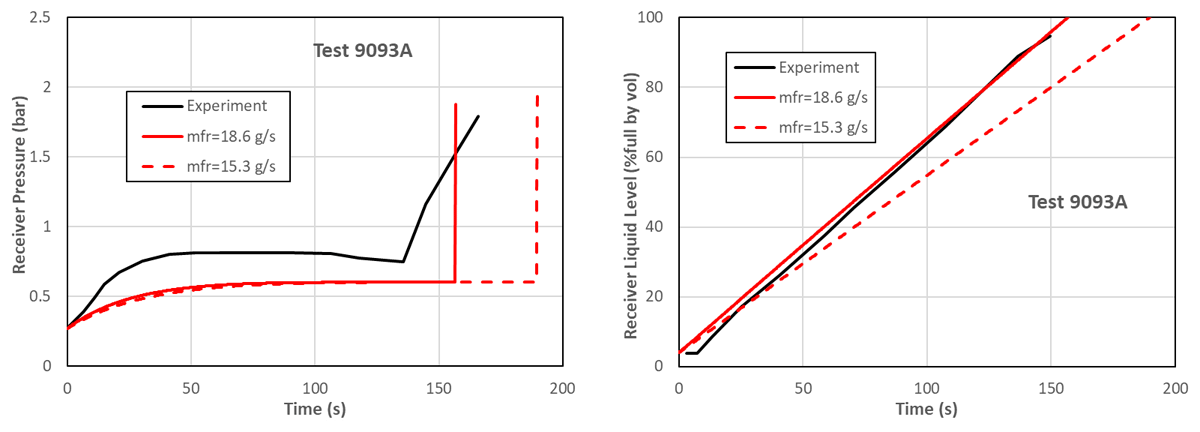
Figure 4
Test 9093A top spray filling. Experiment versus DISCHA simulations.
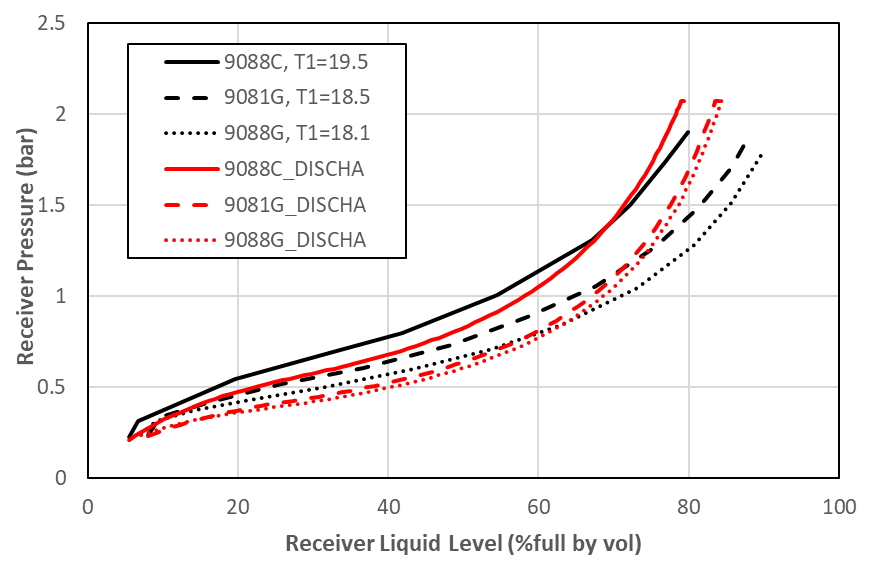
Figure 5
Effect of inlet temperature (bottom diffuser filling). Experiments (black) versus DISCHA simulations (red).
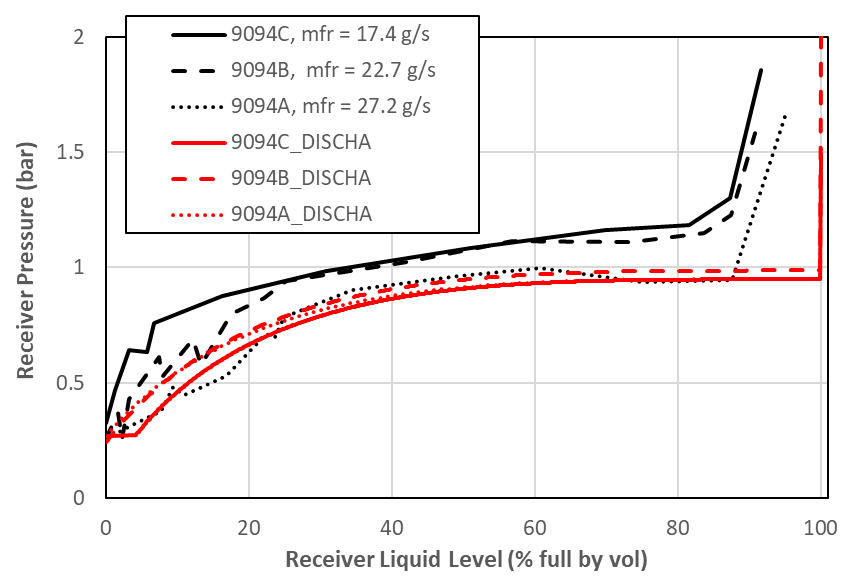
Figure 6
Effect of inlet liquid mass flow rate (top spray filling). Experiments (black) versus DISCHA simulations (red).
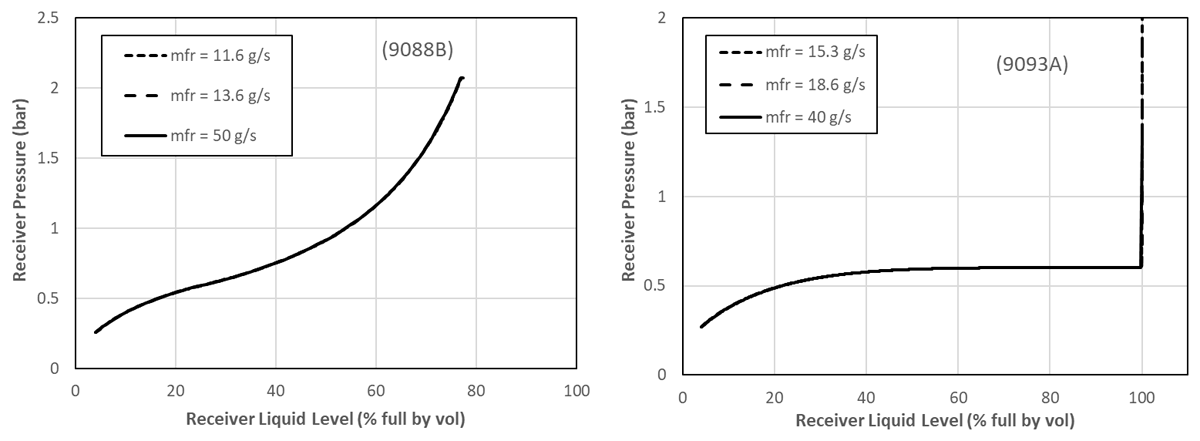
Figure 7
Effect of inlet liquid mass flow rate according to simulations for bottom diffuser filling (left) and top spray filling (right). The other conditions are those of tests 9088B and 9093A.
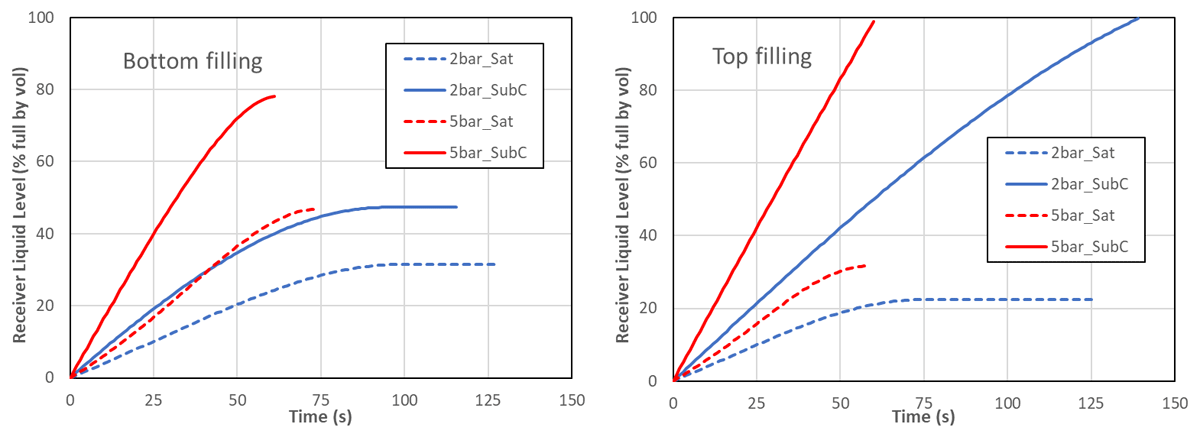
Figure 8
Predicted receiver tank liquid level (% full by vol) vs. time under various supply tank initial conditions, for bottom filling (left) and top filling (right).
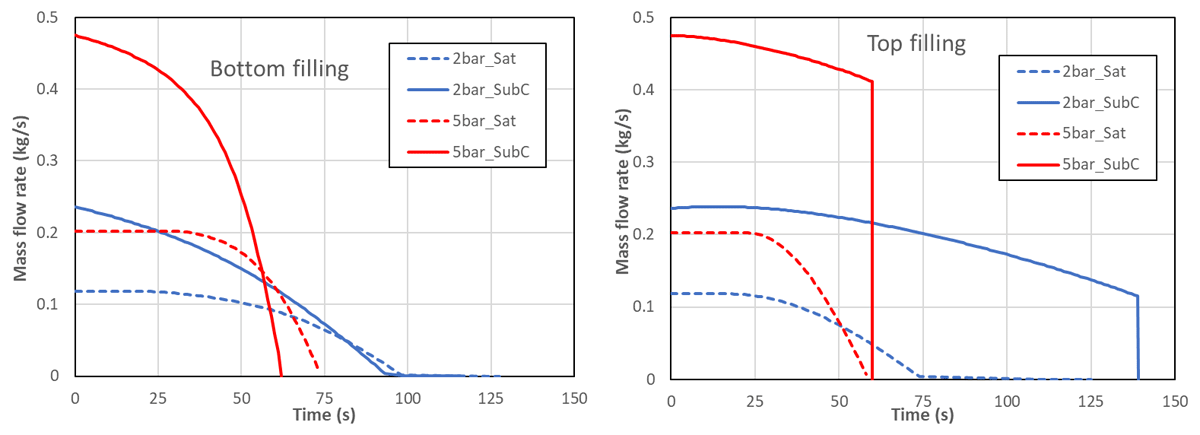
Figure 9
Predicted mass flow rate history under various supply tank initial conditions, for bottom filling (left) and top filling (right).
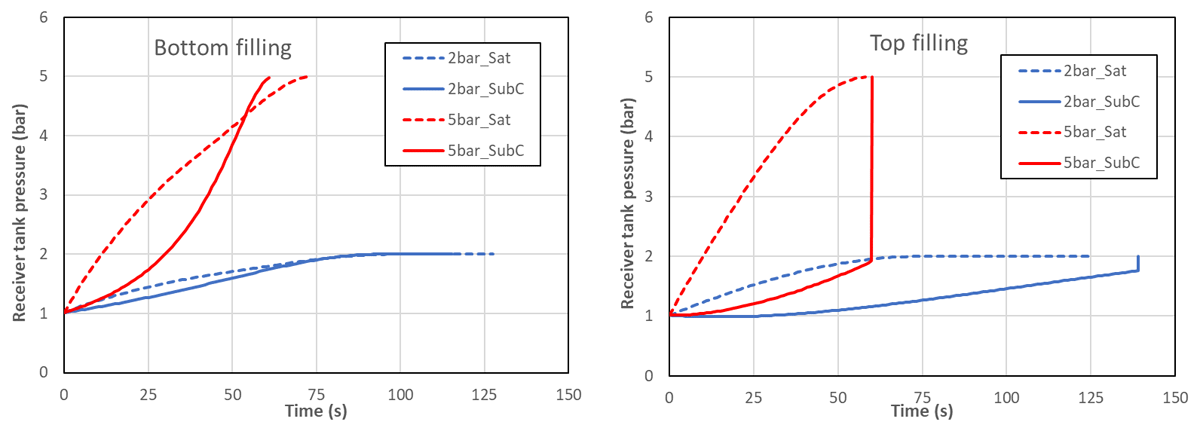
Figure 10
Predicted receiver tank pressure response under various supply tank initial conditions, for bottom filling (left) and top filling (right).