
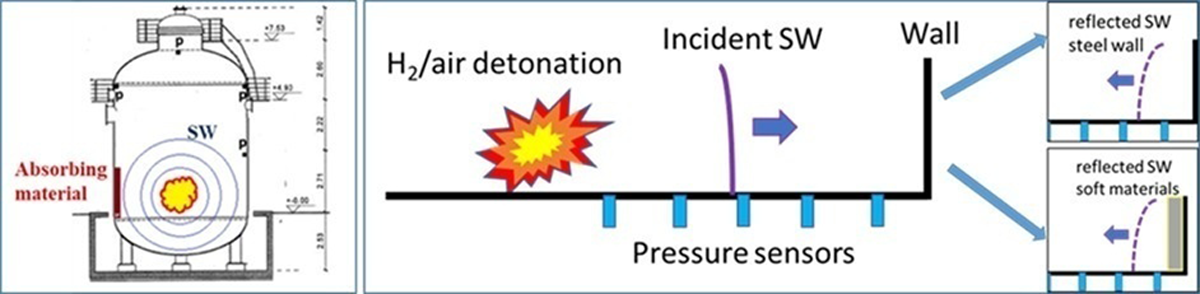
Figure 1
Left, test facility V220 (A2) of HYKA for SW attenuation on absorbing material. Right, sketch of the principle setup for suppression tests of absorbing material on SWs.
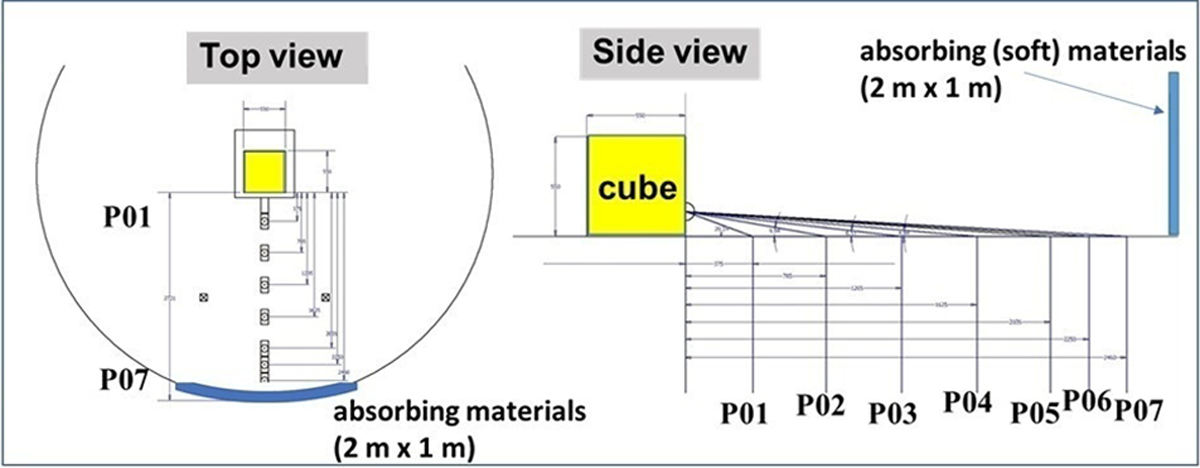
Figure 2
Pressure sensors and combustion cube inside the safety vessel as top and side view.
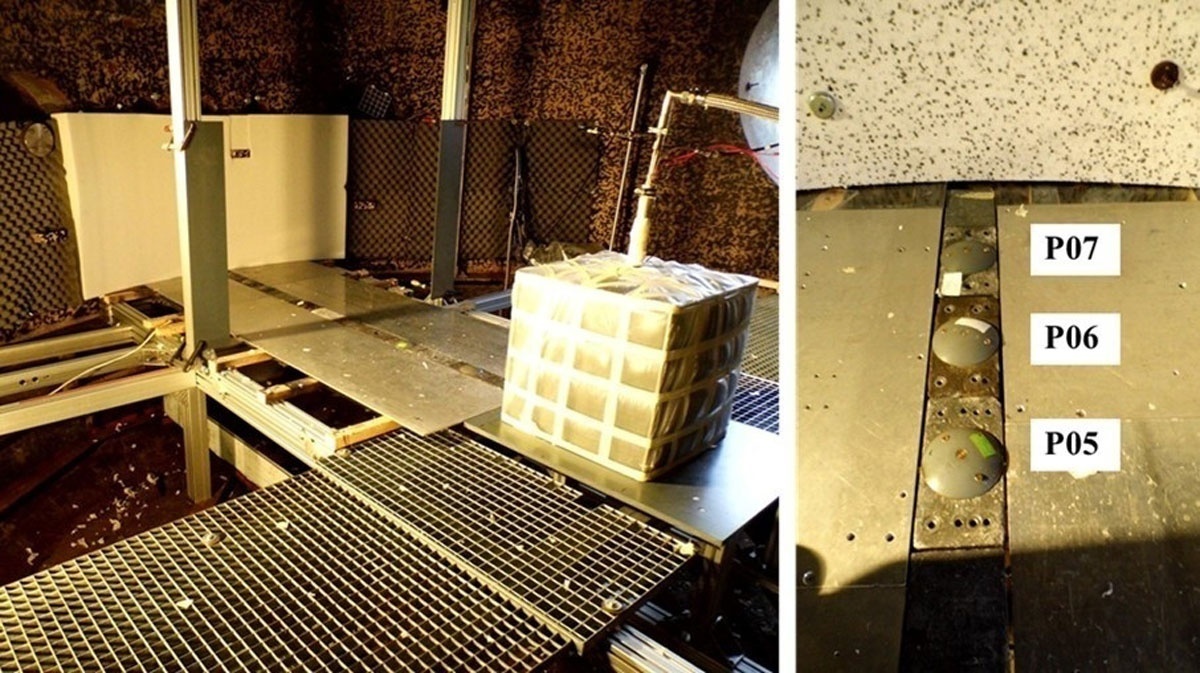
Figure 3
Left, experimental setup inside the safety vessel. Right, pressure sensors (P05, P06, P07) in front of the absorbing material (polystyrene).
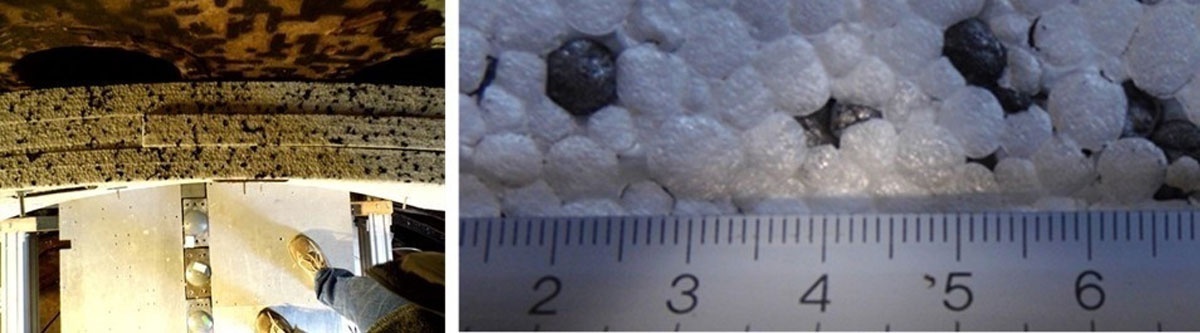
Figure 4
Left, polystyrene plates with thickness of 120 mm (3 × 40 mm) on the wall of the safety vessel. Right, surface structure of the polystyrene plate.
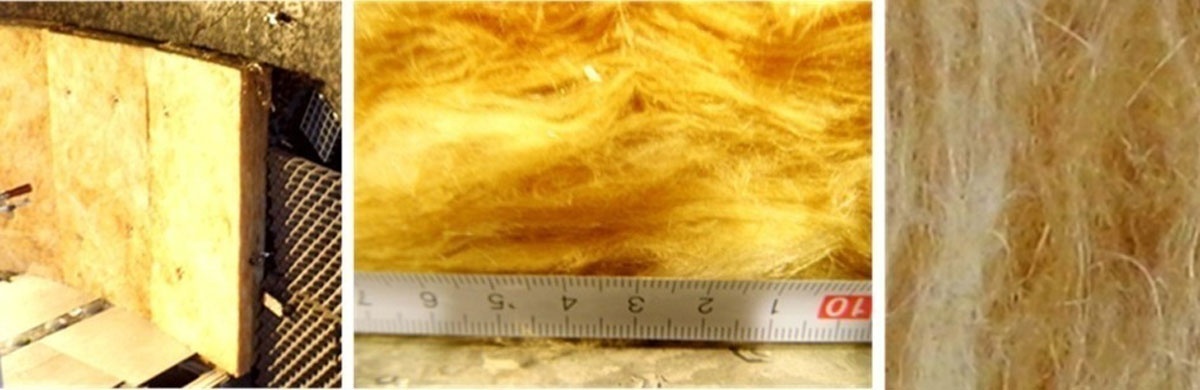
Figure 5
Installation of a 120 mm glass wool plate on the reflected wall and macroscopic open glass fiber surface.
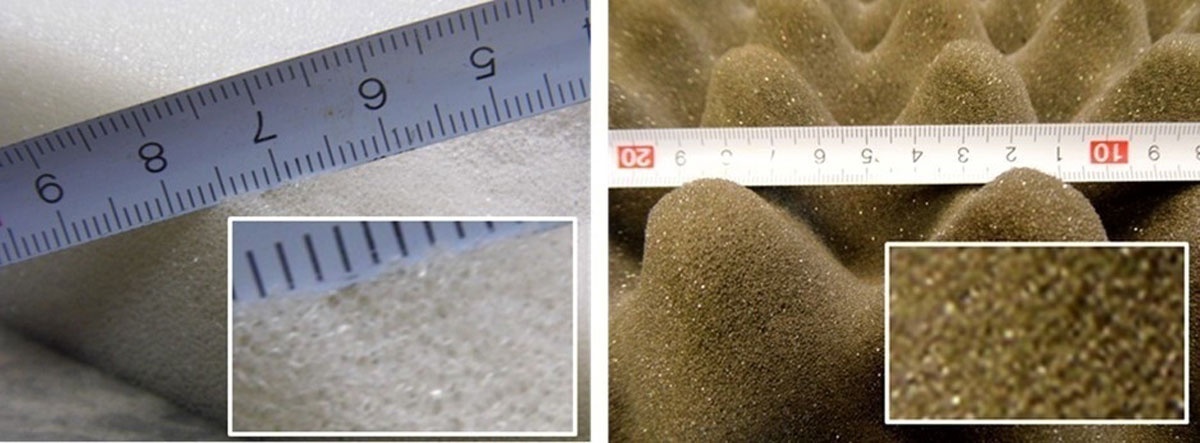
Figure 6
Left, open surface structure of the polyurethane soft foam plates. Right, special structured acoustic polyurethane foam plates.
Table 1
Test matrix with materials and thicknesses.
| ABSORBING MATERIAL | POLYSTYRENE | FOAMPOLYURETHANE | ACOUSTICGLASS WOOL | OTHERS |
|---|---|---|---|---|
| Thickness, 20 mm | X | X | Steel XXX | |
| Thickness, 120 mm | X | X | X | Acoustic foam Thickness, 50 mm X |
| Thickness, 200 mm | X | XX | X |
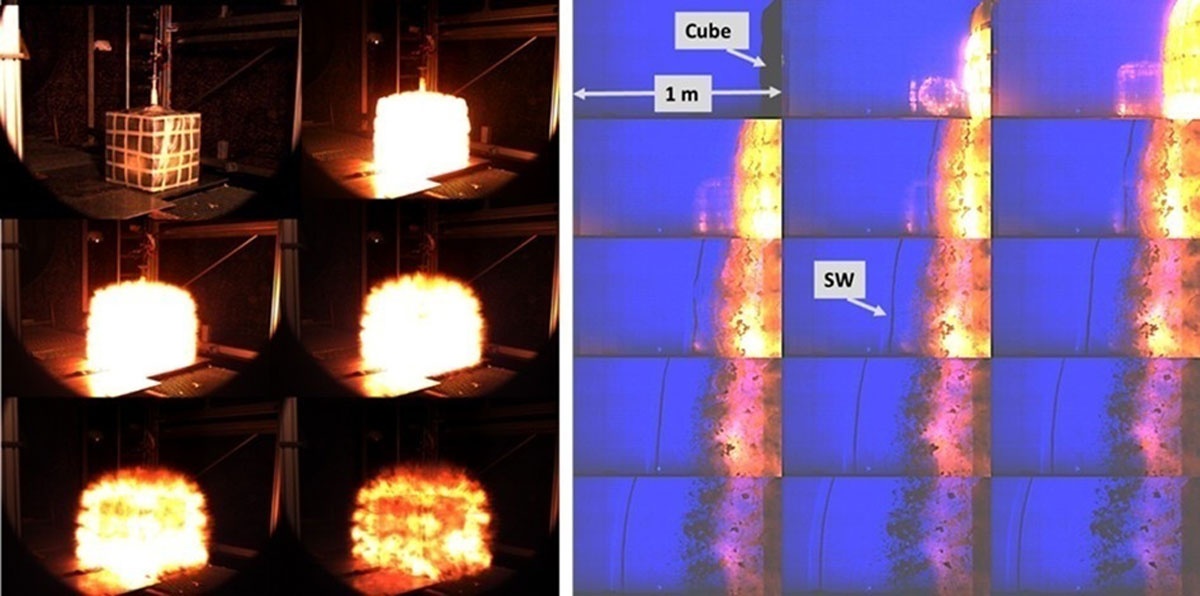
Figure 7
Left, picture series taken from a high-speed movie (5000 f/s). Right, visualization of the emitted shock wave via large-scale shadow setup with a frame rate of 40000 f/s.
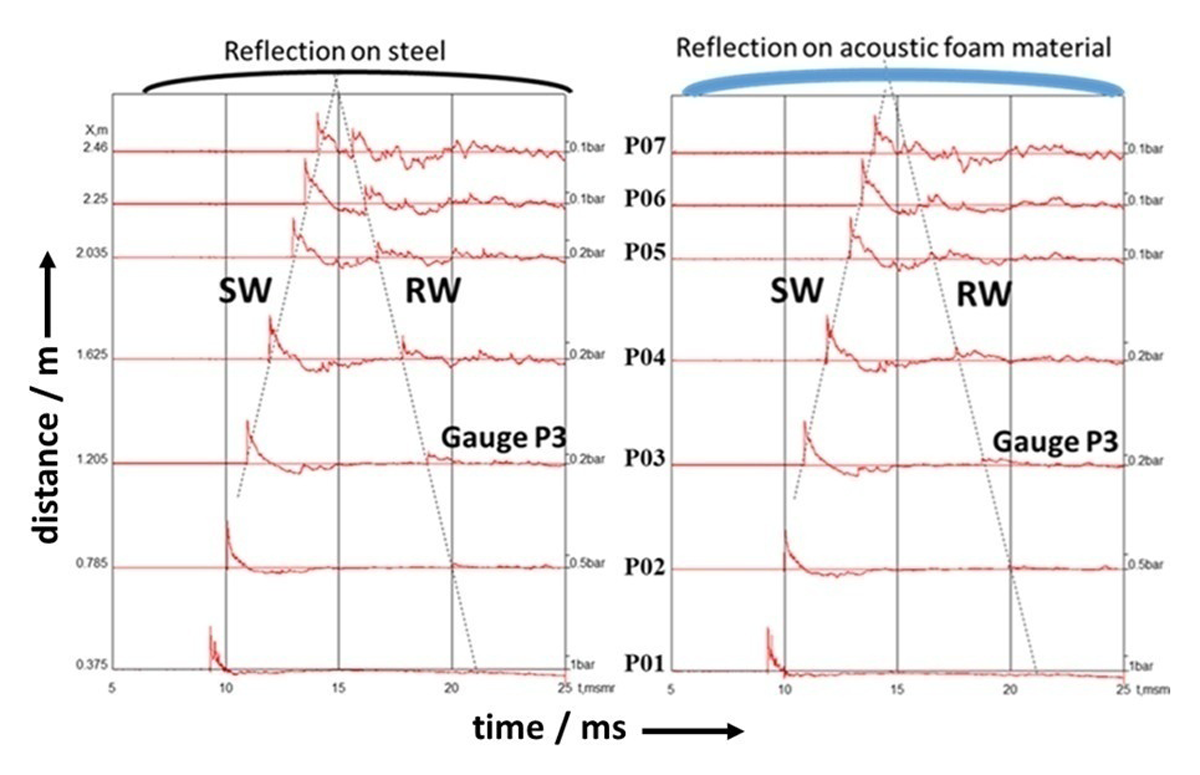
Figure 8
Shock wave propagation and its reflection on the wall using the pressure history of the gauges. Left, reflection on the steel wall. Right, reflection on acoustic foam material (50 mm).
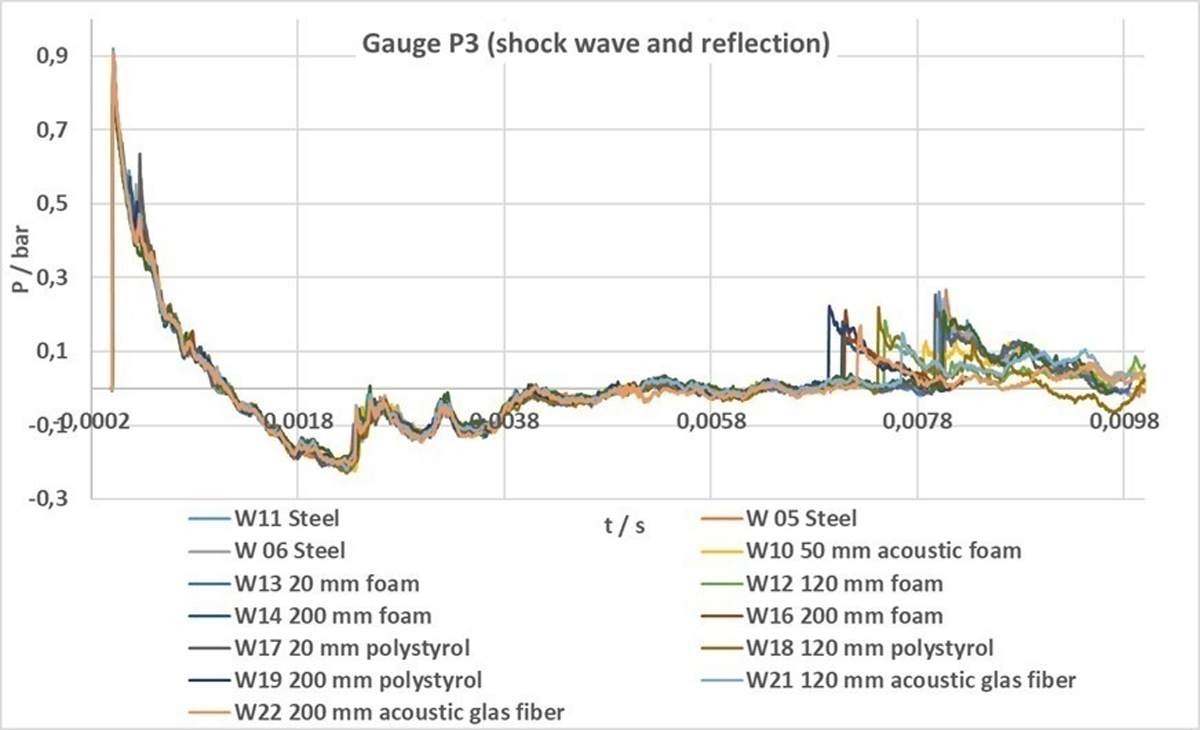
Figure 9
Comparison of the pressure histories from gauge P3 for all tests.
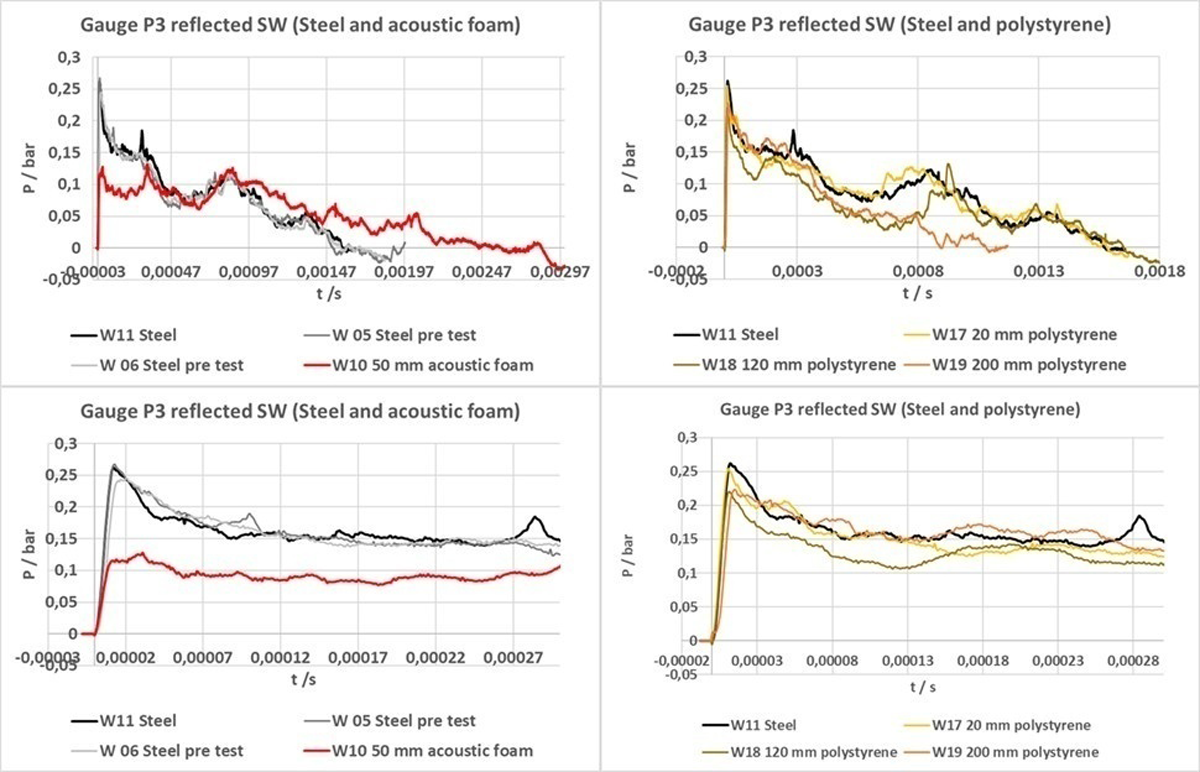
Figure 10
Comparison of the reflected shock wave (gauge P3) from tests with reflection on absorbing material with the reference test with a reflection on the steel wall.
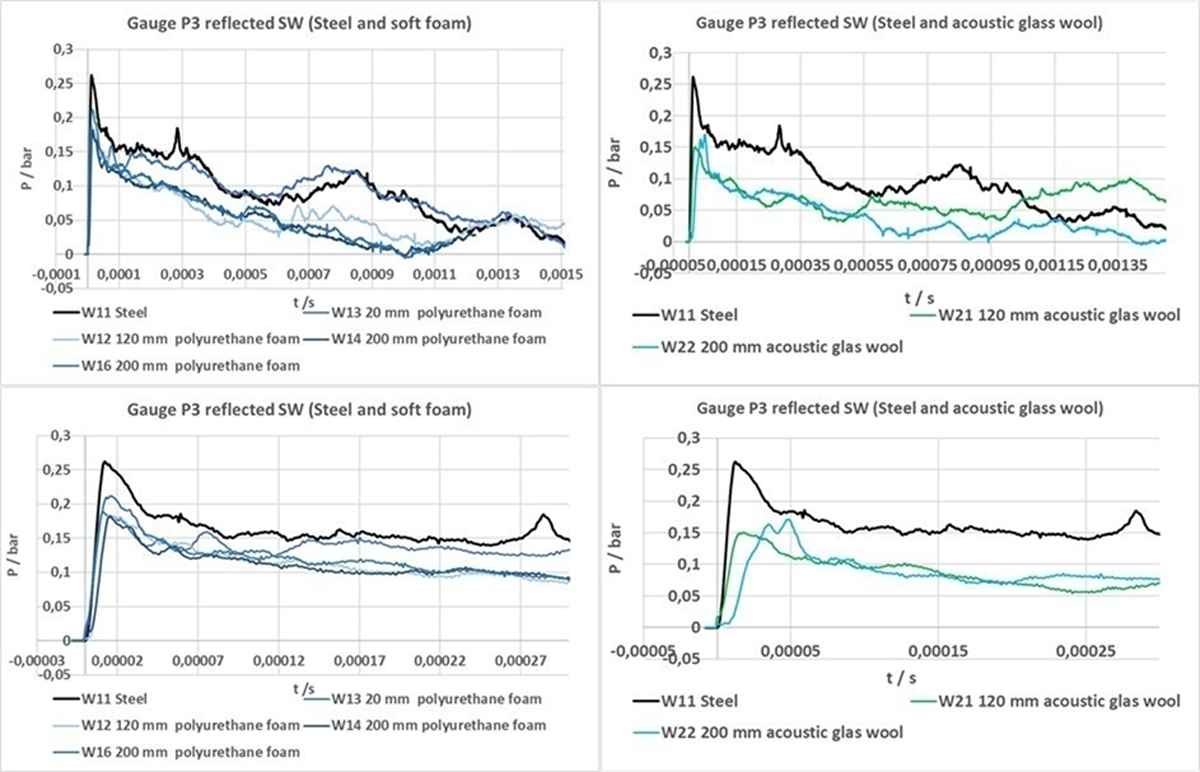
Figure 11
Comparison of the reflected shock wave (gauge P3) from tests with reflection on absorbing material with the reference test with a reflection on the steel wall.
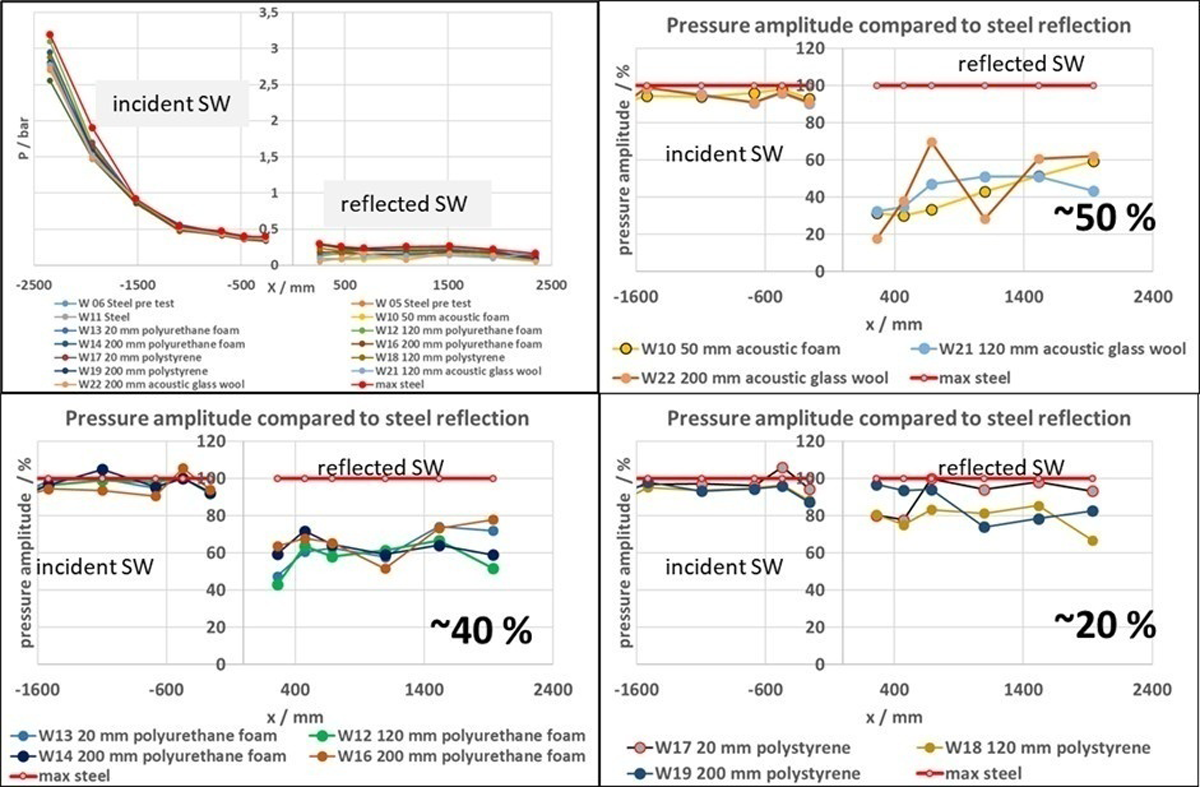
Figure 12
Top left, amplitudes from all pressure gauges and all tests in the distance of the reflected wall (x = 0). Comparison of the pressure amplitudes with normalized steel wall reflection.
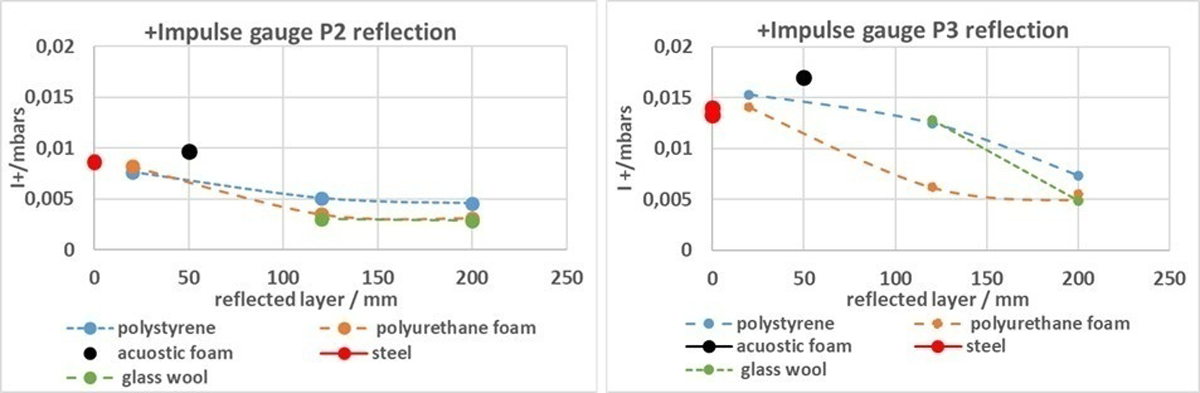
Figure 13
Positive impulse values plotted against the thickness of the investigated absorbing material for pressure gauges P2 and P3.