
1. Introduction
The construction of a hydrogen infrastructure brings with it new safety-related challenges. In order to evaluate emerging risks, extensive experimental and theoretical studies in the field of hydrogen safety were carried out at the Karlsruhe Institute of Technology (KIT) Institute for Thermal Energy Technology and Safety (ITES).
The rupture of a pressurized H2 tank or a rapid hydrogen deflagration or detonation led to the formation of a shock wave (SW). Pressure loads caused by SWs represent the greatest potential hazard in H2 applications. In open spaces, the area of the shock front continuously increases due to spatial expansion, which leads to relatively good attenuation of the amplitude with increasing distance. In pipe geometries such as tunnels, the shock front propagates at all times with the same tunnel cross-sectional area. Friction and reflection on the tunnel walls are mainly responsible for the amplitude decreasing with increasing distance. However, the question remains as to how additional shock-absorbing material can dampen SWs in civil infrastructure.
Shock and pressure wave reduction and protection are of great importance in military research (Raspet et al., 1988). Traditionally, results are not readily available. Nevertheless, many published studies on this topic, both experimental and theoretical, exist. Most use shock tubes (Kitagawa, Takayama and Yasuhara, 2006) or high-explosive charge (Isaac et al., 2022).
The aim of the experiment is to investigate the attenuation effect of absorbing materials on the SW of hydrogen detonation. Only sparse data are available regarding the dynamics and attenuation of SW reflections on absorbing materials.
2. Experimental Setup
The experiments were performed in the safety vessel V220 (A2) at the HYKA hydrogen test center at the Karlsruhe Institute of Technology. The experimental setup has some similarities to that described in Grune, Sempert and Jordan (2025). The emitted SW from a cube-shaped 4 g H2 combustion unit (Grune et al., 2003) is applied to investigate the SW attenuation by different absorbing materials. Samples of selected absorbing materials with an area of 2 m2 are fixed at the same height as the combustion cube on the wall of the safety vessel. A traverse of fast pressure sensors is placed in front of the test samples to precisely measure the incident SW history and the waves reflected from the absorbing materials. The reference case is defined as the SW reflected from the steel body of the vessel, as shown in Figure 1. In selected cases, a high-speed shadow setup is used to record the SW reflection behavior of the tested material.
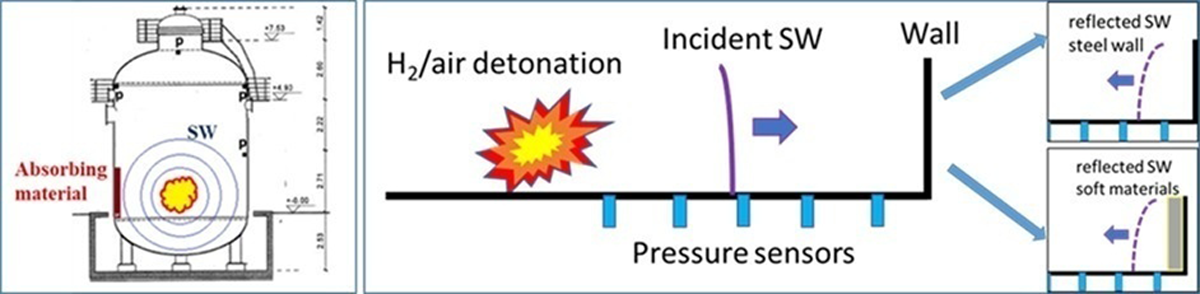
Figure 1
Left, test facility V220 (A2) of HYKA for SW attenuation on absorbing material. Right, sketch of the principle setup for suppression tests of absorbing material on SWs.
Different absorbing materials with different thicknesses are applied to test their attenuation effect of SWs of hydrogen detonation. Samples of absorbing material with an area of ~2 m2 were therefore form-fitted and mounted on the steel wall of the safety vessel. Figure 2 shows the traverse of the seven pressure sensors and the combustion cube inside the safety vessel.
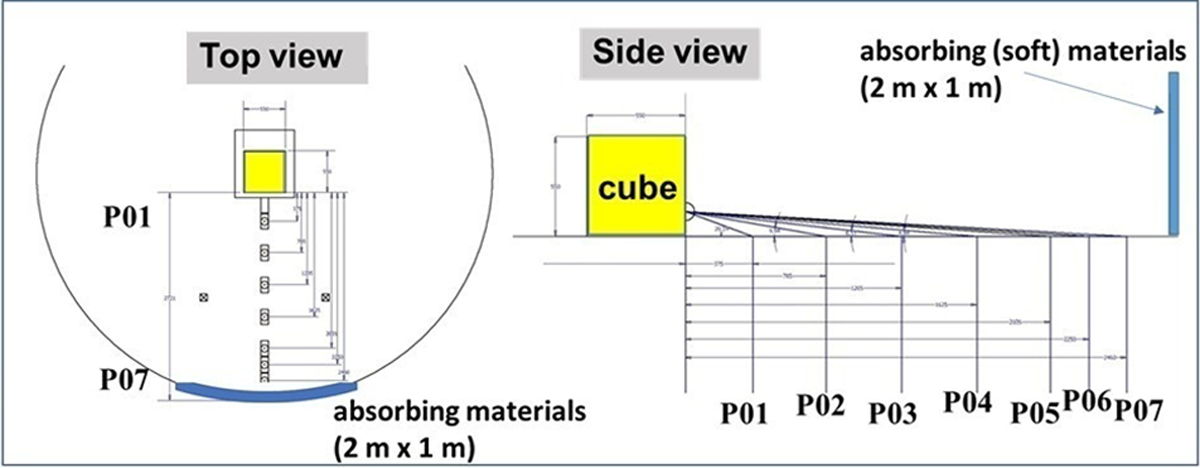
Figure 2
Pressure sensors and combustion cube inside the safety vessel as top and side view.
Figure 3 gives an impression of the experimental setup inside the safety vessel. The combustion unit is covered with a thin (7 µm) plastic film and stabilized with paper tape. The base of the combustion unit is separated from the pressure sensor floor to avoid any disturbing vibration on the sensor signals. The pressure sensor is mounted with special adapters and placed on lead bricks. In this example, a 1 m × 2 m polystyrene plate with a thickness of 120 mm is mounted as test sample form-fitted on the vessel wall.
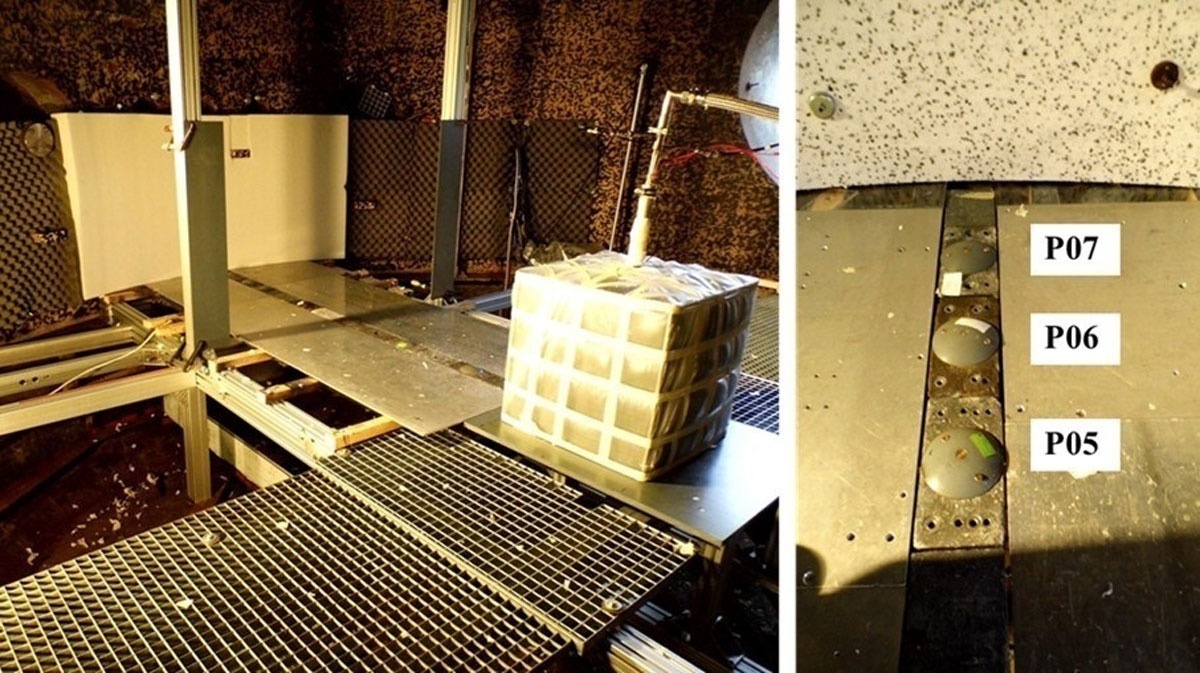
Figure 3
Left, experimental setup inside the safety vessel. Right, pressure sensors (P05, P06, P07) in front of the absorbing material (polystyrene).
2.1 Absorbing materials
Different absorbing materials with different thicknesses are applied to test their attenuation effect on the SW of hydrogen detonation. Expanded polystyrene plates are selected as soft material with a closed surface structure. Plates with thicknesses of 20 and 40 mm are used to fix the plates form-fitting on the steel wall. Figure 4 shows an arrangement of a thickness of 120 mm and the closed surface structure of the material. The used polystyrene has a static resistance to pressure of 100 kPa for 10% deformation.
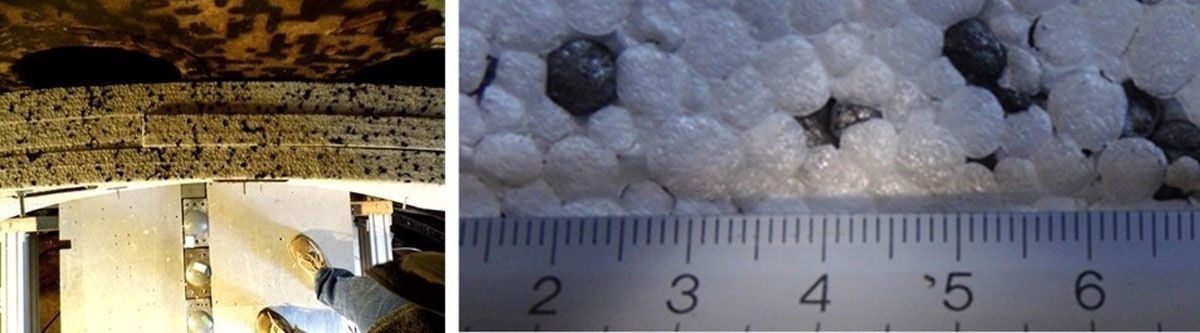
Figure 4
Left, polystyrene plates with thickness of 120 mm (3 × 40 mm) on the wall of the safety vessel. Right, surface structure of the polystyrene plate.
As a testing material with an open surface structure, glass wool plates with 80 and 120 mm are selected. The material is advertised as acoustic glass wool with a density of 12.8 kg/m3. Figure 5 shows the installation on the reflected wall (120 mm) and the open glass fiber surface of the material.
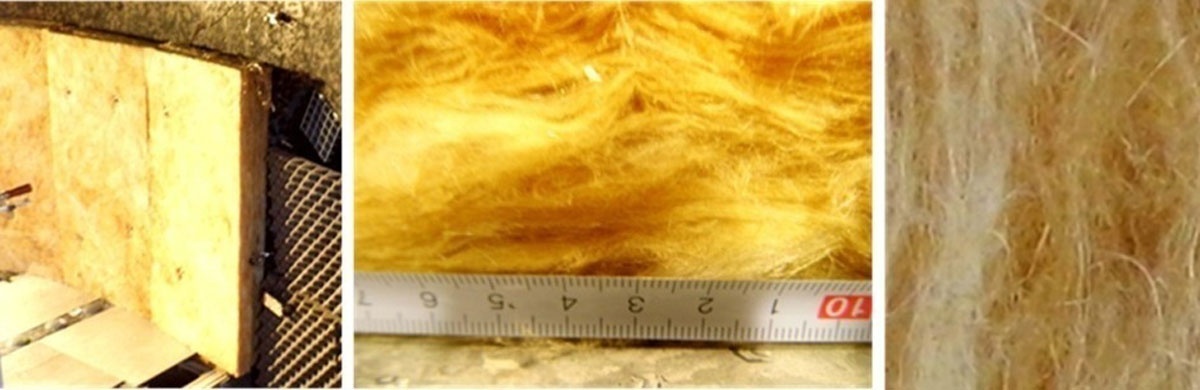
Figure 5
Installation of a 120 mm glass wool plate on the reflected wall and macroscopic open glass fiber surface.
As a further target for the SW attenuation, polyurethane soft foam plates with thicknesses of 20 and 100 mm are used. This soft material has a density of 25 kg/m3 and its compression hardness is 4 kPa for 40% deformation. Figure 6 left shows the open surface structure of the polyurethane soft foam plates. The bubble size of the fixed foam is ~0.33 mm.
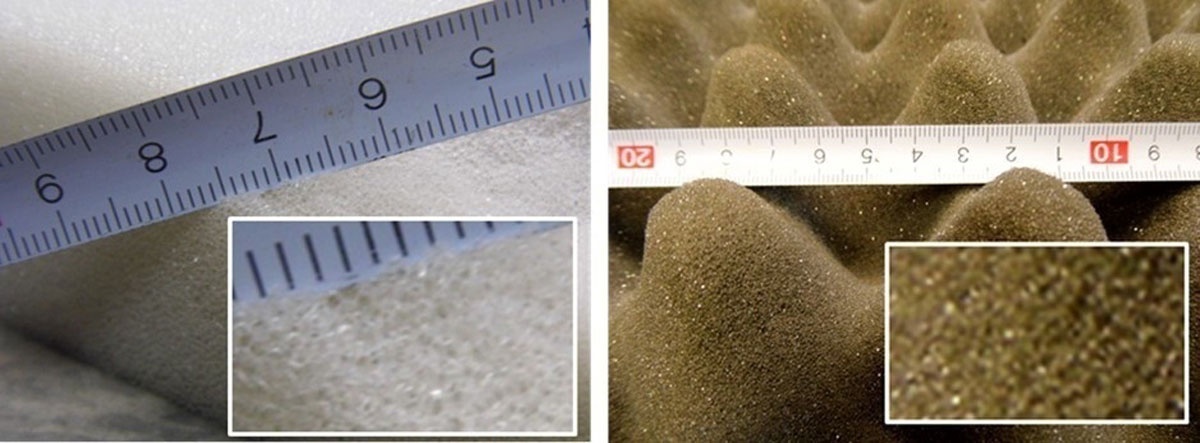
Figure 6
Left, open surface structure of the polyurethane soft foam plates. Right, special structured acoustic polyurethane foam plates.
In addition to these planar polyurethane soft foam plates, a special structured acoustic foam polyurethane plate designed for acoustic wave attenuation is tested. Figure 6 right shows a black acoustic polyurethane plate. The waveform structure of the surface can impinge acoustic waves to diffuse. Due to reflection in different directions, an attenuation of the level of sound takes place. This material has a density of 28 kg/m3 with a compression hardness of 4 kPa for 40% deformation. The thickness of the investigated acoustic polyurethane plates was 50 mm.
2.2 Test matrix
The test matrix with materials and thicknesses is shown in Table 1. To investigate the attenuation effect of the absorbing materials on SWs, tests with reflection from the steel body of the vessel were performed as a reference. In the entire test series, great emphasis was placed on the reproducibility of the pressure wave source (combustion cube) and the consistency of the pressure sensors (Figure 9). The results of the pressure wave attenuation at the soft reflective material are recorded as a relative difference compared to the reflection off a steel wall. By performing cyclic, repeated reference measurements of the pressure wave reflection off the steel wall, measurement uncertainties are largely eliminated.
3. Results
The used combustion unit generates a highly repeatable H2-detonation with 4 g H2. The picture series in Figure 7 left, taken from a high-speed movie (5000 f/s), shows the high uniformity of the detonation in cube geometry. For the visualization of the emitted SW, a large-scale shadow setup (Grune et al., 2021) with a frame rate of 40000 f/s was used, as shown in Figure 7 right.
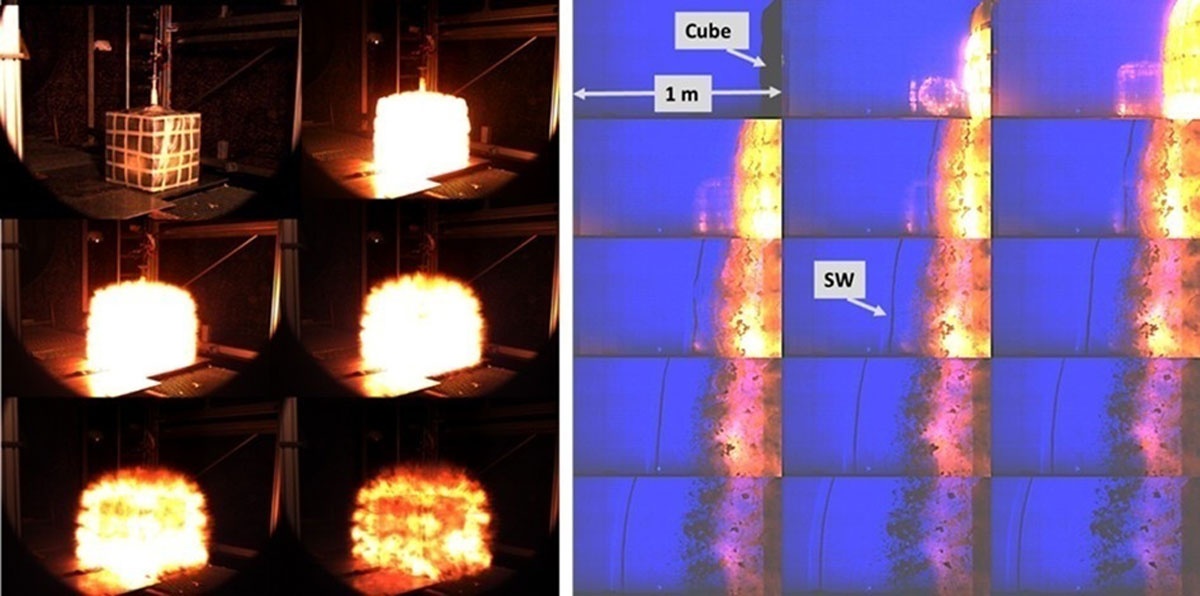
Figure 7
Left, picture series taken from a high-speed movie (5000 f/s). Right, visualization of the emitted shock wave via large-scale shadow setup with a frame rate of 40000 f/s.
The first picture shows one cube’s side. In the second picture, the detonation inside the cube is present and the thin plastic film blows slightly up. The emitted SW is visible in the fifth picture as a black line. The SW looks planar and propagates undisturbed from the combustion products inside the test area in the direction towards the reflection wall. The SW was measured quantitatively with the gauges (P1–P7) in a side-on configuration. Figure 8 shows the SW propagation and its reflection on the wall by using the pressure history of the gauges (P1–P7). The left side shows the SW propagation from the combustion unit and its reflection from the steel wall; the right side visualizes the SW reflection from the acoustic foam material (50 mm). It is directly visible that the reflected SW from the steel wall has a clearly identifiable shock front in contrast to the reflected SW from the acoustic foam material, which is not very clear.
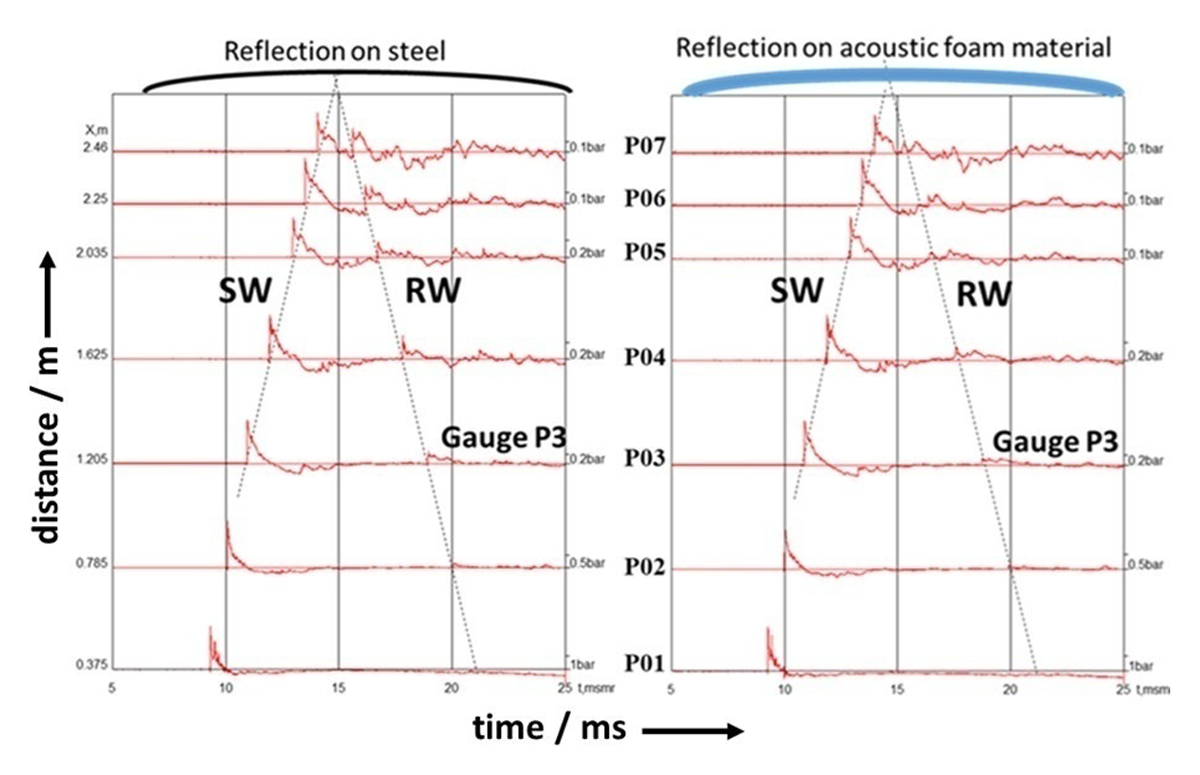
Figure 8
Shock wave propagation and its reflection on the wall using the pressure history of the gauges. Left, reflection on the steel wall. Right, reflection on acoustic foam material (50 mm).
The incident SW shows a negative phase with a duration of several milliseconds after the positive shock front. The reflected positive shock front overlaps with the negative phase of the incident SW for the gauges near the wall. For the gauge P3, the incident SW and its reflection are separated (Figure 8). The pressure histories from gauge P3 for all tests are compared in Figure 9.
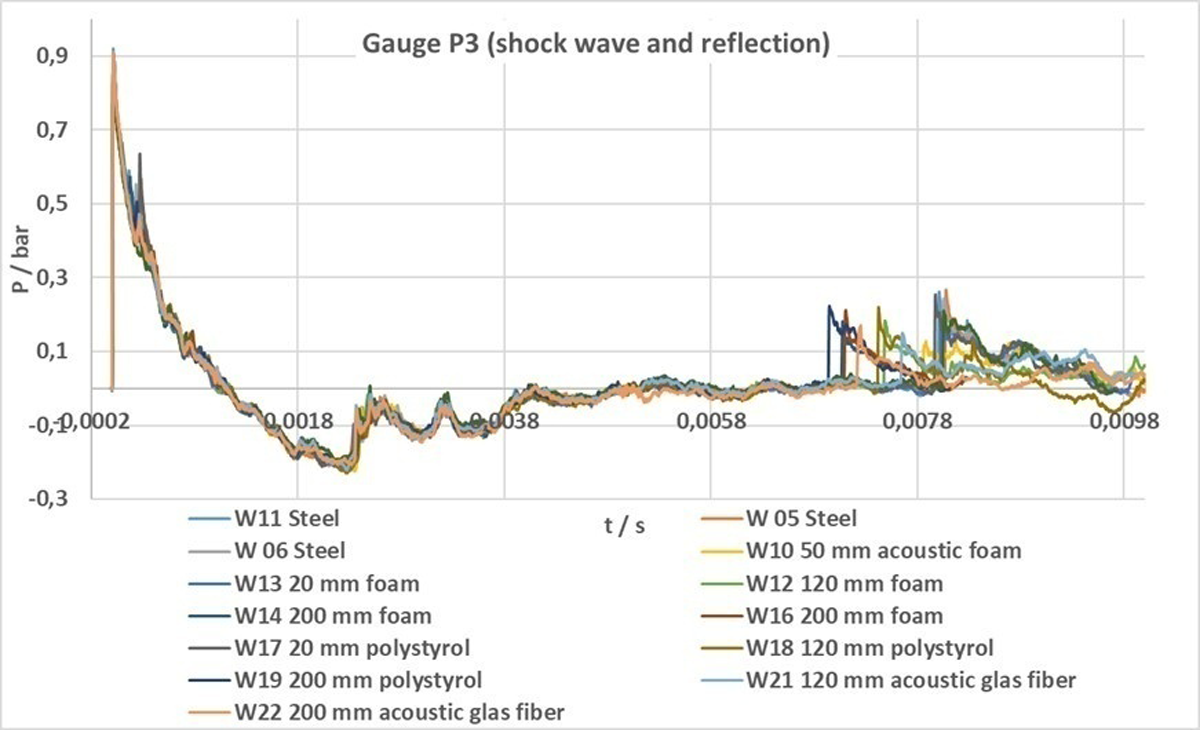
Figure 9
Comparison of the pressure histories from gauge P3 for all tests.
It is obvious that all curves from the incidence shocks collapse together in a very good agreement, including all small deviations from an ideal shape of a SW pressure history. In contrast, the reflected SWs arrive with time shifts. This is caused by the different propagation distances due to the different thickness of the test materials. This effect leads to a difference in the magnitude of the reflected SW. However, this slight attenuation effect at a distance of 2.5 m is not dominant in this application and is not considered in the data interpretation either.
All arrival times of the reflected shockwaves were set to zero to highlight the difference of amplitudes and impulses. Figures 10 and 11 show the comparison of the reflected SW (gauge P3) from tests with reflection on absorbing material with the reference test with a reflection on the steel wall.
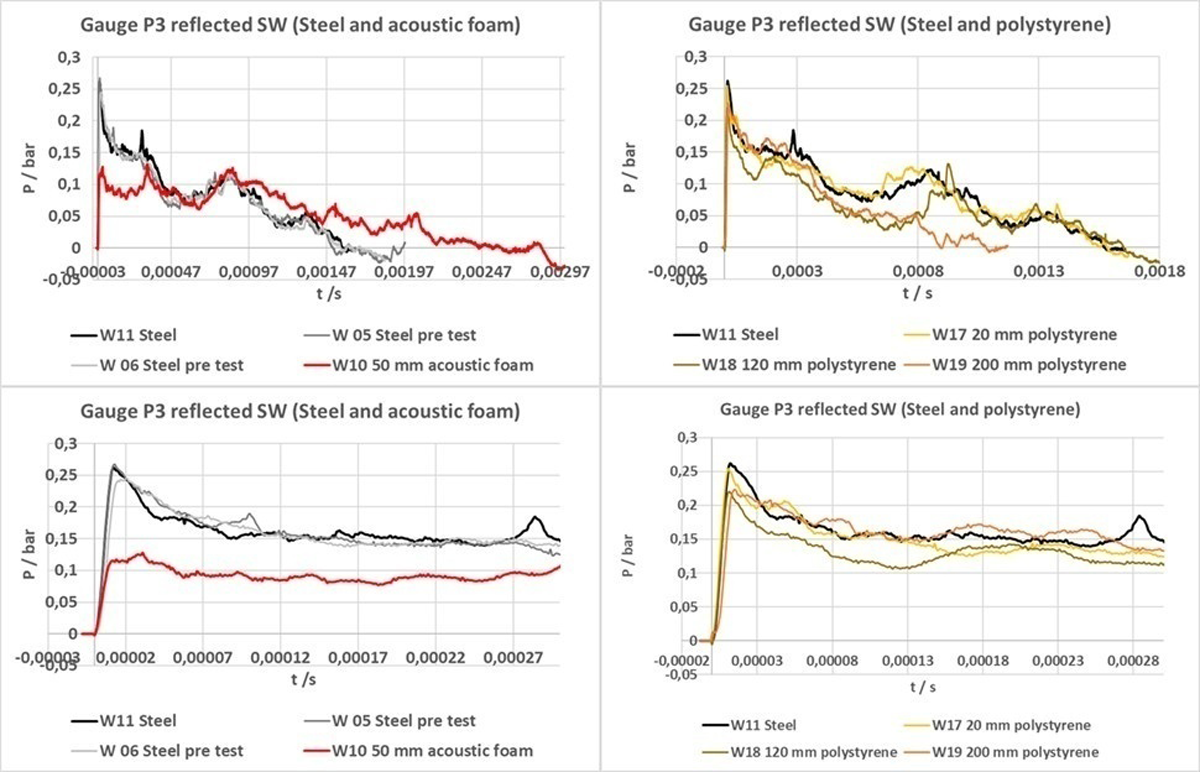
Figure 10
Comparison of the reflected shock wave (gauge P3) from tests with reflection on absorbing material with the reference test with a reflection on the steel wall.
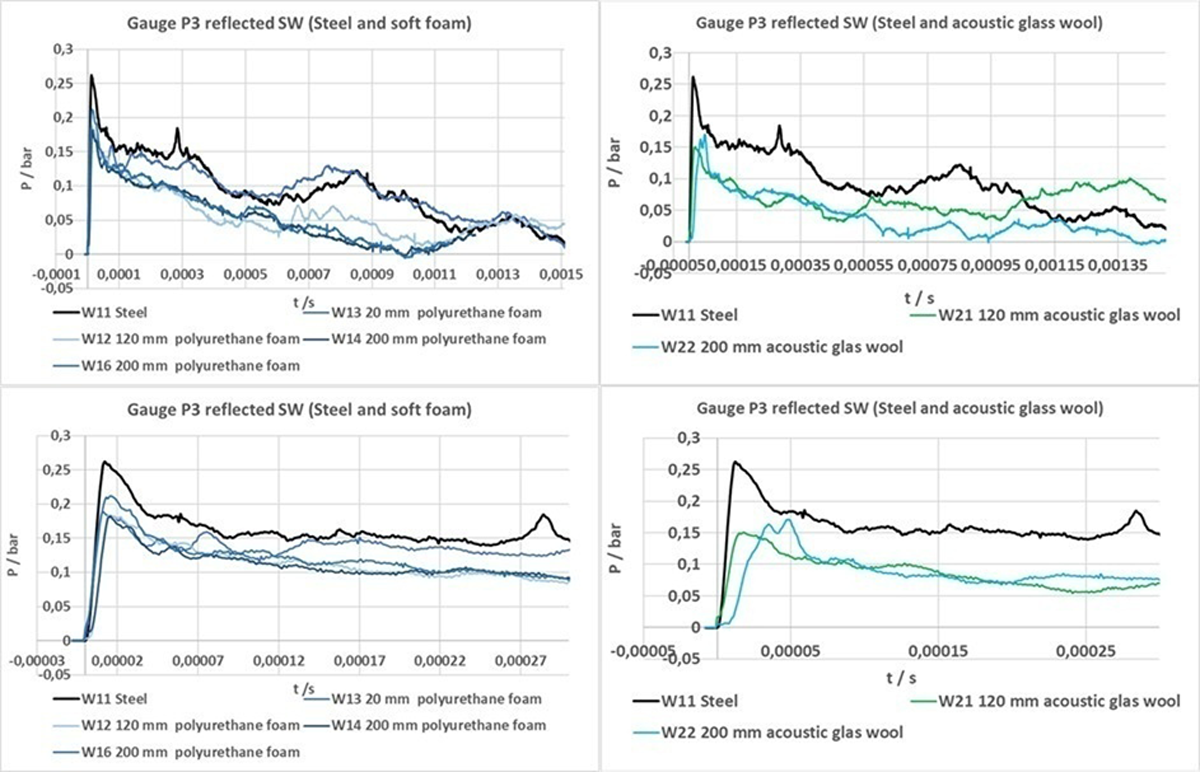
Figure 11
Comparison of the reflected shock wave (gauge P3) from tests with reflection on absorbing material with the reference test with a reflection on the steel wall.
The left side of Figure 10 shows the pressure histories of the reflection (gauge 3) for the three reference tests (steel wall) and the test with the acoustic polyurethane structured plates (50 mm). The top diagram shows the complete positive SW, while the below is the zoomed amplitude in a shorter time range. All reference tests (reflection on steel) show a nicely identical shape. The shape of the pressure history of the reflection on acoustic polyurethane plate (red line) looks different. The magnitude of the amplitude reaches 50% of that in reference test. On the other hand, the duration of the positive amplitude is roughly two times longer than that of all steel tests. On the right side of Figure 10, the shock reflection on polystyrene plates with different thicknesses is compared with the steel reference case. The pressure history of the 20 mm plate looks very close to the steel reference. The reflection on the 120 and 200 mm polystyrene plates shows only a slight attenuation effect. This can be seen in the zoomed plot in Figure 10 bottom right.
The left side of Figure 11 shows the pressure histories of the reflection (gauge 3) from polyurethane soft foam (thickness 20, 120, and 200 mm) and the reference test (steel wall). The top diagram shows the complete positive SW, while the below is the amplitude in a reduced time scale. The reflection on the polyurethane soft foam shows a clear attenuation effect regarding the amplitude. The difference between the plate with 20 mm and both tests with 200 mm thickness is very low. On the right side of Figure 11, the shock reflection on glass wool plates with different thicknesses is compared with the steel reference. There is a clear reduction of the shock amplitude due to the absorbing material. However, the attenuation effect is almost the same for both investigated thicknesses (120 mm, 200 mm).
The top left plot in Figure 12 shows the amplitudes from all pressure gauges and all tests in the distance of the reflected wall (x = 0). The amplitude of the incidence SW decays fast at an earlier stage, then decays moderately near the reflection. The red curve represents the measured maximum value from the three reference tests with reflection on steel. This value is taken as the reference value and is normalized to 100%. To visualize the attenuation effect due to the shock-absorbing material, the values of all amplitudes are expressed in this normalized way. In Figure 12 top right, the normalized amplitudes from the maximum values of the reference steel wall tests are compared with the normalized data from the acoustic polyurethane structured plates (50 mm) and the acoustic glass wool. All incident shock amplitudes are nearly equal and close to 100%. The results of the reflected amplitudes are 100% for the reference test. The top-right plot shows a reduction of the SW amplitude due to the reflection on the absorbing material of ~50% on average. It is worth remarking that the observed attenuation effect decreases with increasing propagation distance of the wave. The observed attenuation effect of the soft polyurethane foam is consistently in a range of ~40% and is independent of the thickness of the probes, as shown in Figure 12 bottom left. The investigated polystyrene plates show a value of ~20% attenuation. It is the lowest effect in the test series. In this case, the thickness of the test plates looks negligible too.
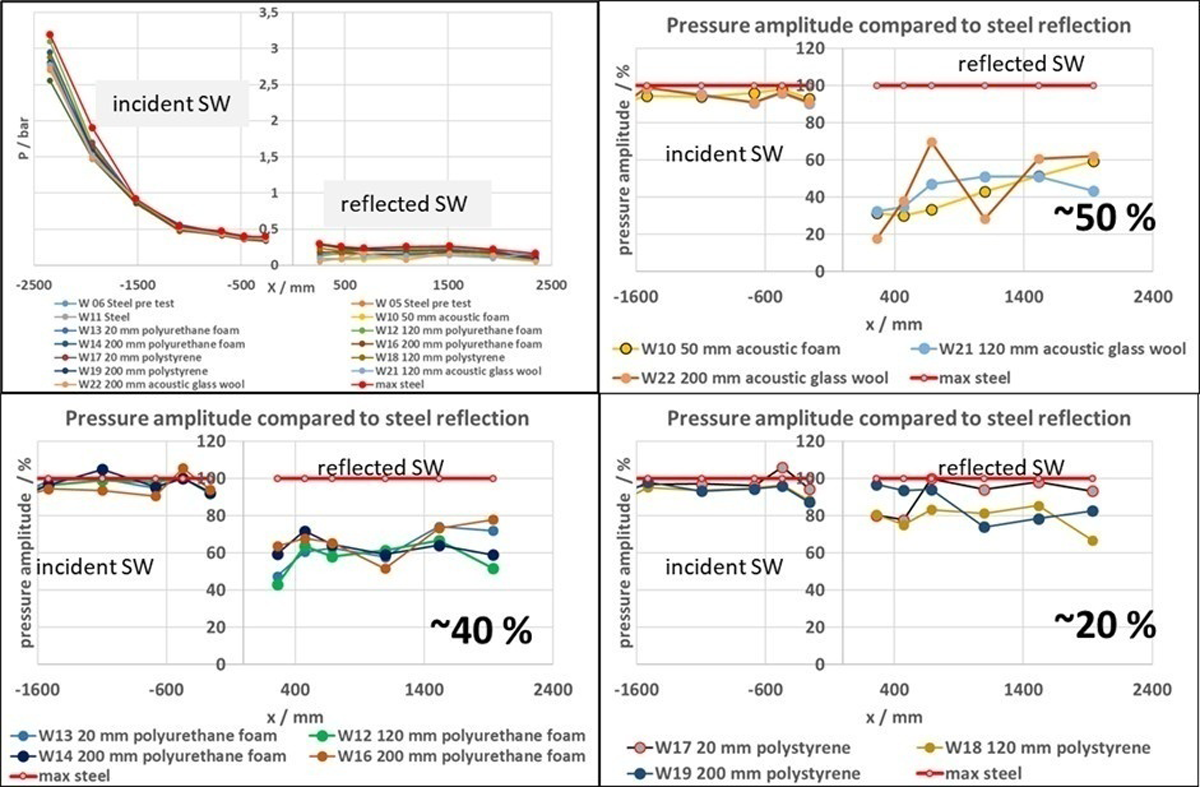
Figure 12
Top left, amplitudes from all pressure gauges and all tests in the distance of the reflected wall (x = 0). Comparison of the pressure amplitudes with normalized steel wall reflection.
A proper evaluation of the positive impulse of the reflected SW is possible only for pressure gauges P2 and P3. Figure 13 shows the impulse values plotted against the thickness of the investigated absorbing material. For the reference tests (reflection on the steel wall), the thickness is zero, denoted as red points. It is worth noting that the measured positive impulse for the structured acoustic polyurethane plate with a thickness of 50 mm (black points) is higher than that of the steel reference (referring to Figure 10). All other plates, including the polyurethane, present a decreasing positive impulse with increasing thickness of the tested material. The all-test material with a thickness of 200 mm shows an attenuation of the positive impulse of ~50% compared to the reference value (steel wall). In contrast to the amplitude analysis, a clear influence of the absorbing material’s thickness is observed to the attenuation of the positive impulse.
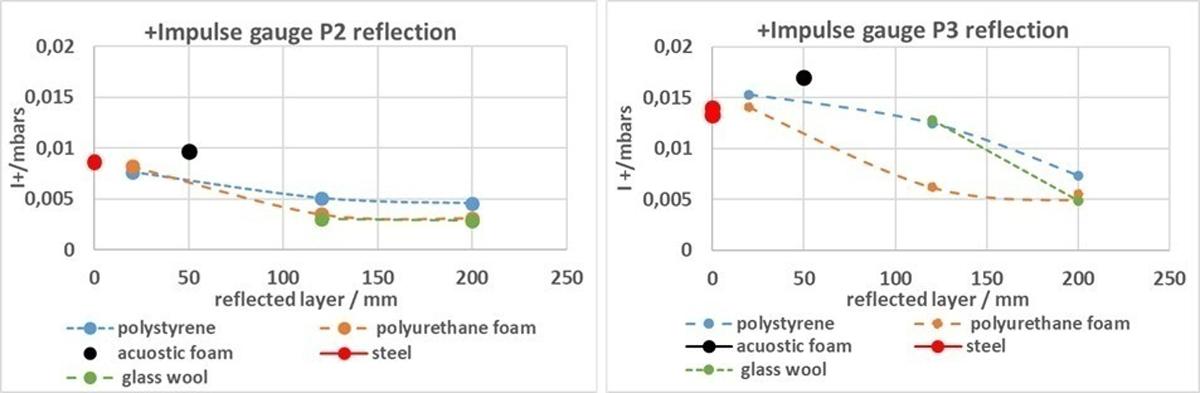
Figure 13
Positive impulse values plotted against the thickness of the investigated absorbing material for pressure gauges P2 and P3.
4. Summary and conclusions
The SW attenuation due to reflection on soft materials was investigated inside a vessel of 220 m3 volume. A cube-sized (0.55 m) combustion unit filled with 4 g H2 was used to provide reproducible SW from an unconfined H2/air detonation.
A SW amplitude attenuation, expressed as difference of the reflected SW amplitude from the steel wall to the reflected SW amplitude from absorbing (soft) materials was found:
~50% glass wool (fiber) and structured acoustic polyurethane
~40% polyurethane foam (soft foam)
~20% polystyrene
Regarding the SW amplitude attenuation, clear influence of the thickness of the absorbing material was not observed.
For the SW positive impulse attenuation, an influence of the thickness of the absorbing material was observed. The positive impulse attenuation increases with increasing thickness of the absorbing material. An exception is the structured acoustic polyurethane foam. Its reflected positive impulse is higher than the reflected positive impulse from the steel wall.