
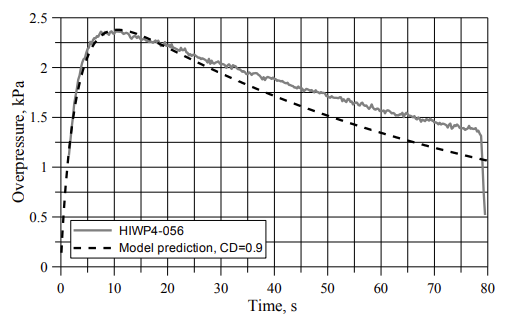
Figure 1
Pressure peaking test (1.086 g/s gaseous hydrogen leak in a 1 m3 enclosure with a 16.5-mm-diameter vent). The grey line shows experimental overpressure; the black dashed line shows the modelled overpressure (Shentsov, Kuznetsov and Molkov, 2015).
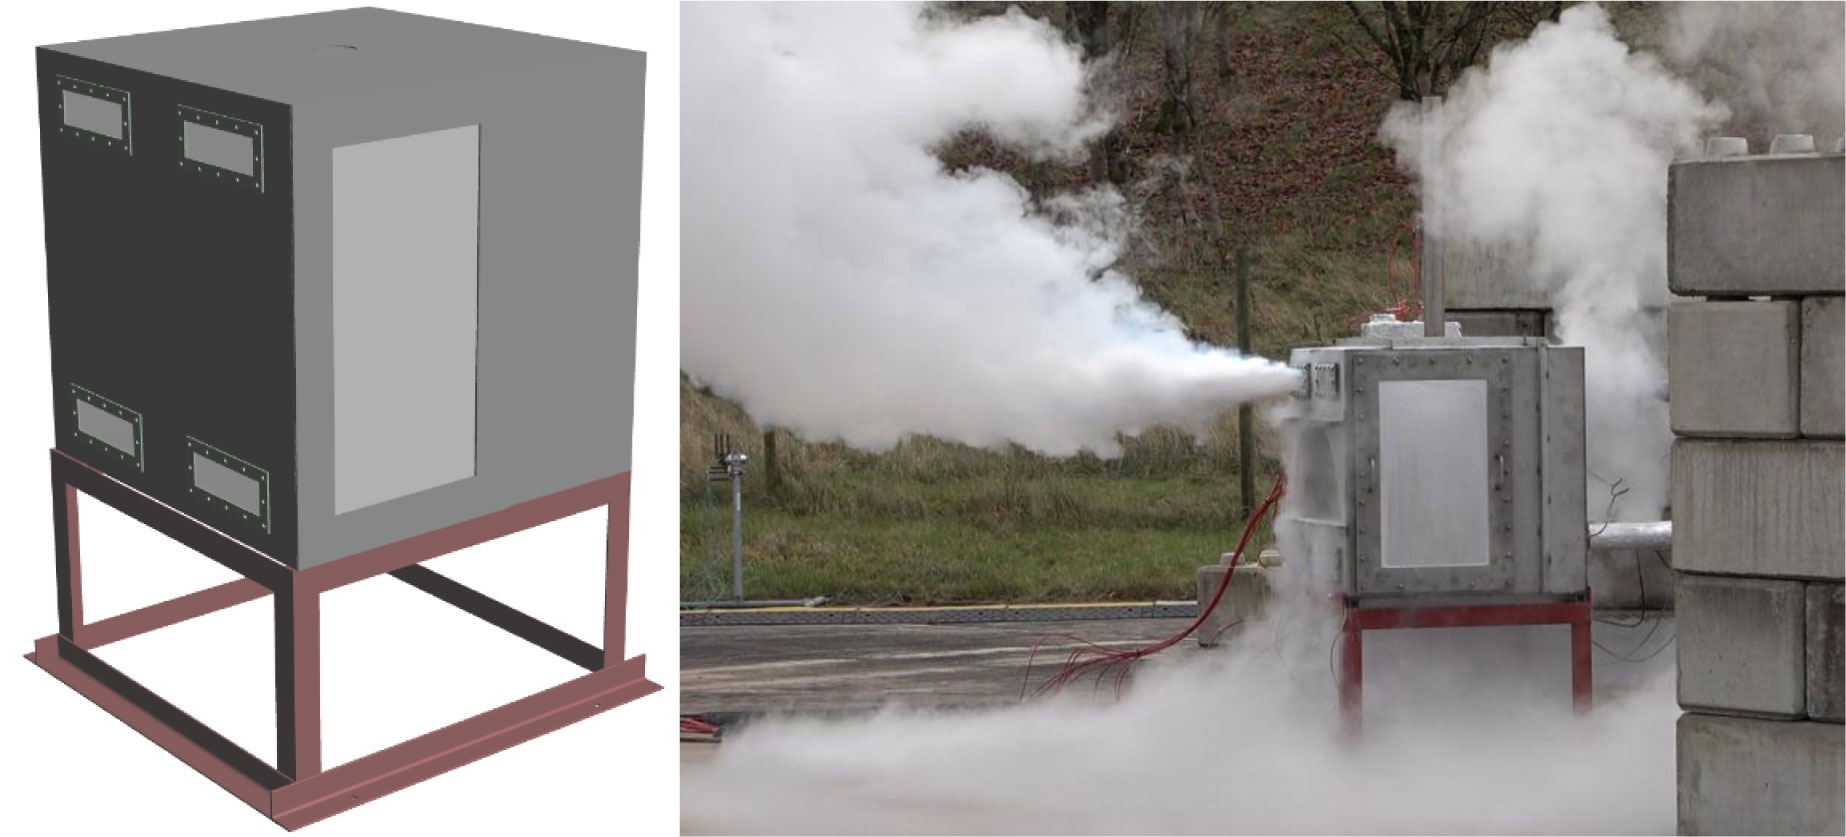
Figure 2
Left: A CAD model of the 1 m3 enclosure with four passive vents and a burst panel on a frame. Right: Image during Test 3 with one open vent.
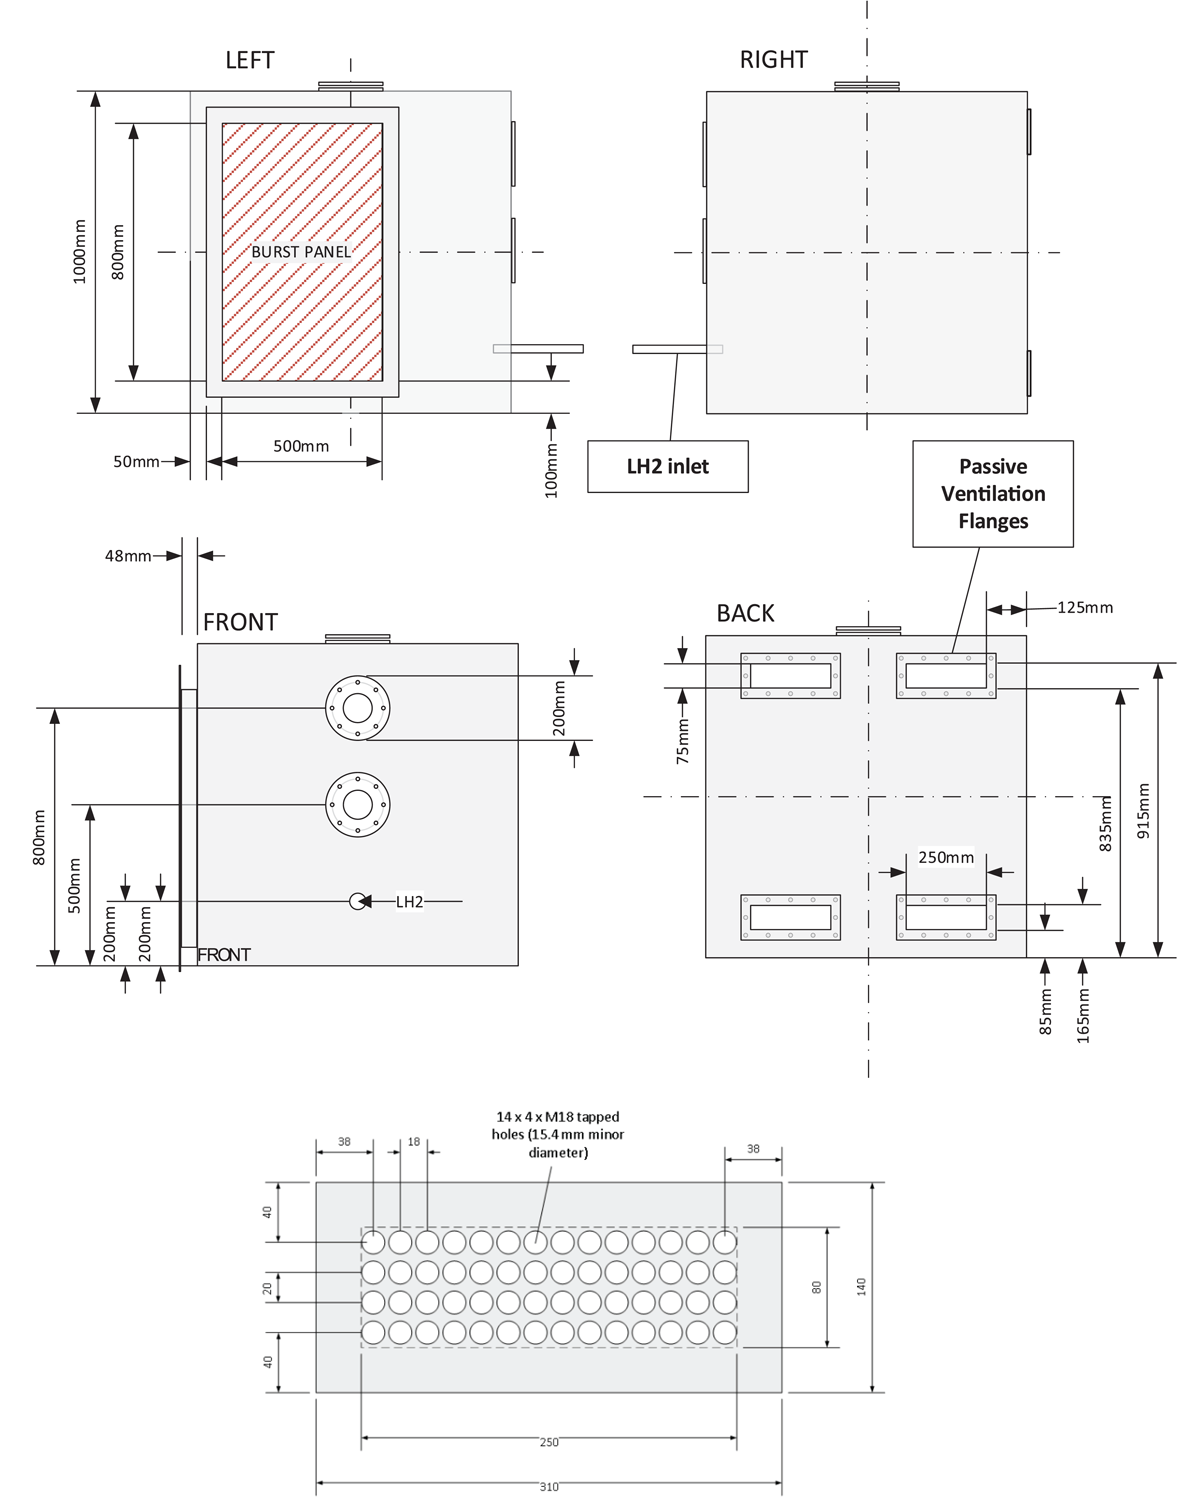
Figure 3
Top: Left, right, front and back dimensioned views of the 1 m3 enclosure. Note that for these tests, the two flanges on the front side of the enclosure were blanked. Bottom: Dimensions of plates attached to open flanges. The total ventilation area of each plate is 0.0104 m2.
Table 1
Instrumentation used in experiments.
| MEASUREMENT | INSTRUMENT | RANGE | ACCURACY | UNCERTAINTY |
|---|---|---|---|---|
| Release pressure | ESI IS 4200EXH0016AB Pressure Transducer | 0.1–1.1 MPa | ±0.25% | ±0.002 MPa |
| Release temperature | Type T thermocouple, 2 m × 1.5 mm | 4.2–400 K | ±8 K (@ 20 K) | ±8 K |
| Enclosure internal temperature | Type T thermocouple, 2 m × 1.5 mm | 77–400 K | ±1 K | ±1 K |
| Enclosure wall temperature | Type T thermocouple, 2 m × 1.5 mm | 77–400 K | ±1 K | ±1 K |
| Enclosure internal overpressure (PT1, PT2) | WIKA A-10 pressure transducer | 0–10 kPa | ±0.5% | ±0.03 kPa |
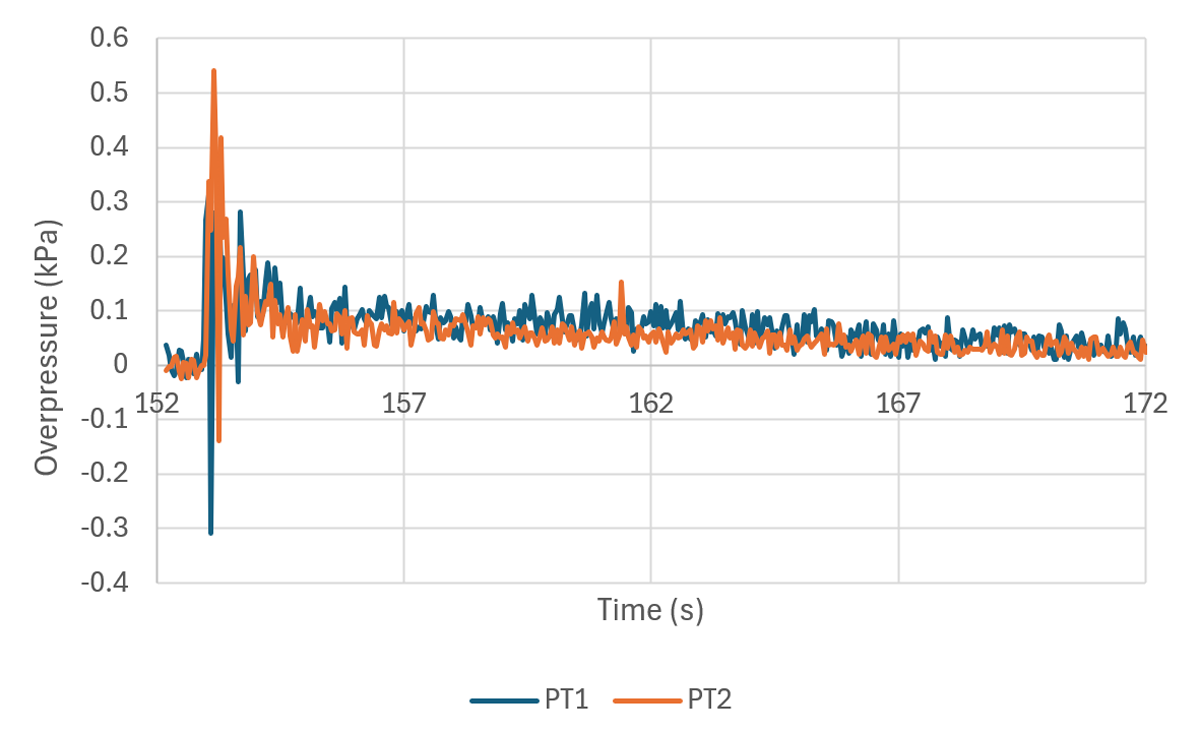
Figure 4
Test 1 enclosure overpressure.
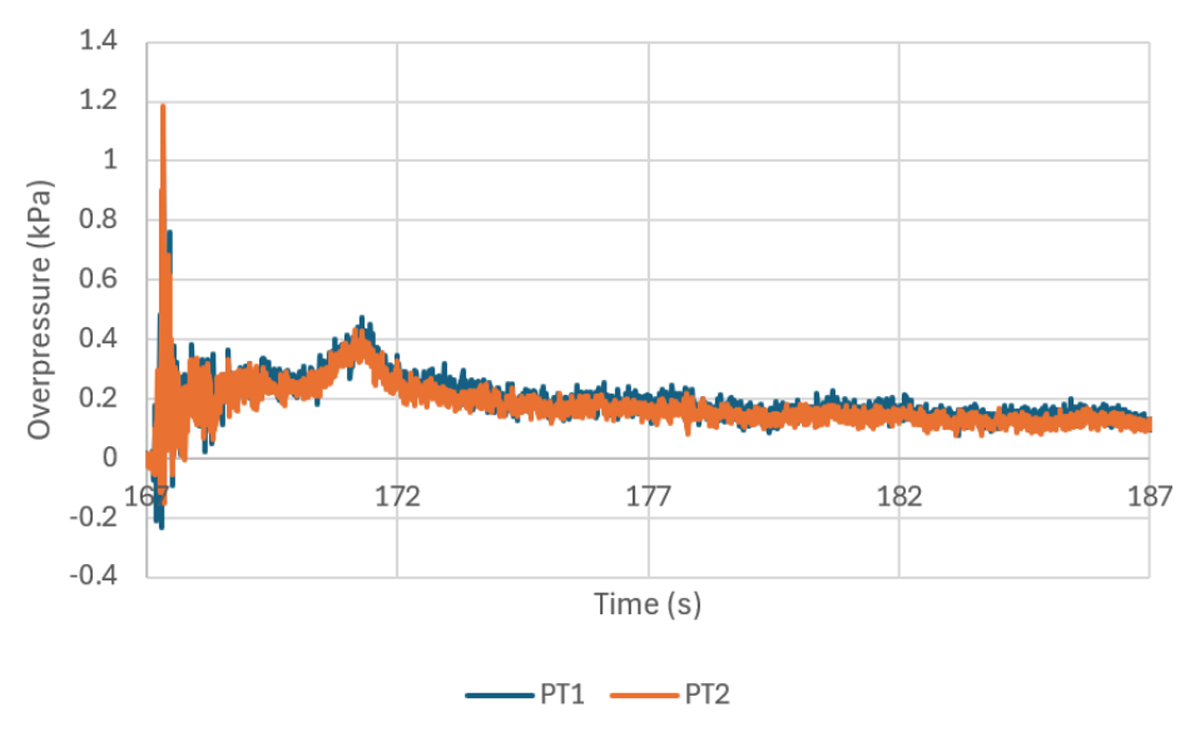
Figure 5
Test 2 enclosure overpressure.
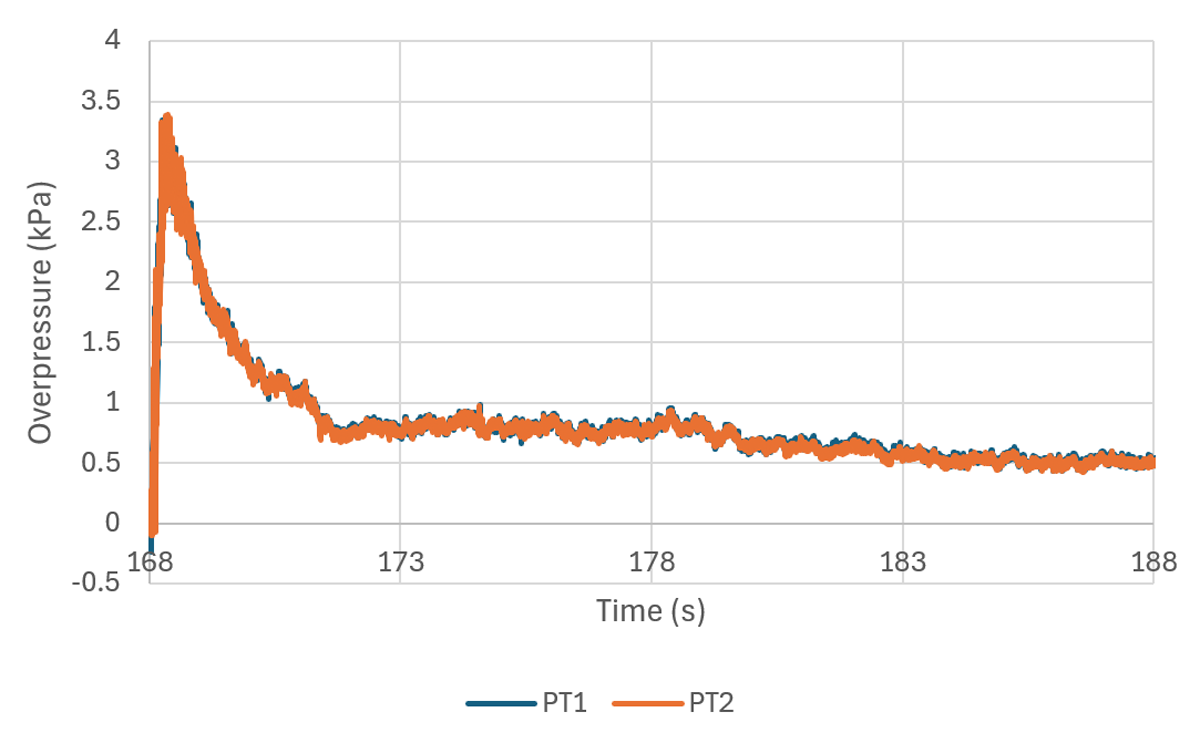
Figure 6
Test 3 enclosure overpressure.
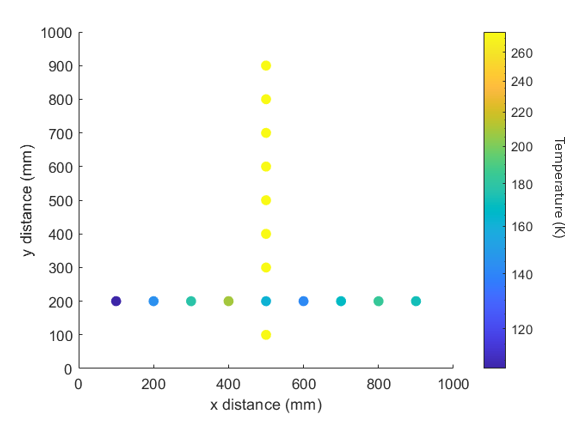
Figure 7
Temperature distribution in the enclosure during Test 3 at 168.5 s. All temperature probes are in the plane of the LH2 inlet, with the inlet at (0.200).
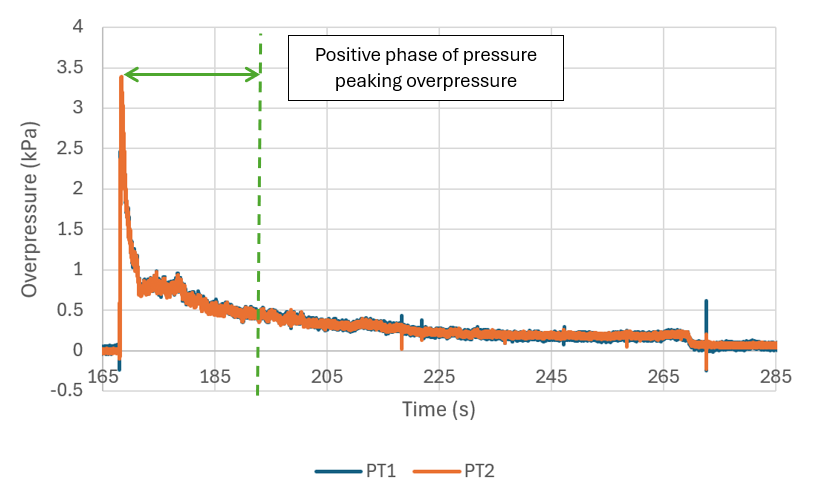
Figure 8
Graph of overpressure during Test 3 showing the positive phase cutoff.
Table 2
Input parameters into the Ulster University GH2 pressure peaking model.
| PARAMETER | SYMBOL | VALUE | UNIT |
|---|---|---|---|
| Atmospheric pressure measured in experiment | Patm | 96,900 | Pa |
| Enclosure temperature | Tencl | 280 | K |
| Enclosure volume | Vencl | 1 | m3 |
| Vent height | Hvent | 0.1 | m |
| Vent width | Wvent | 0.104 | m |
| Hydrogen mass flow rate | 0.18 | kg/s | |
| Coefficient of discharge | Cd | 0.6 | – |
| Integration time step | Δt | 0.002 | s |
| No. of time steps | nmax | 1000 | – |
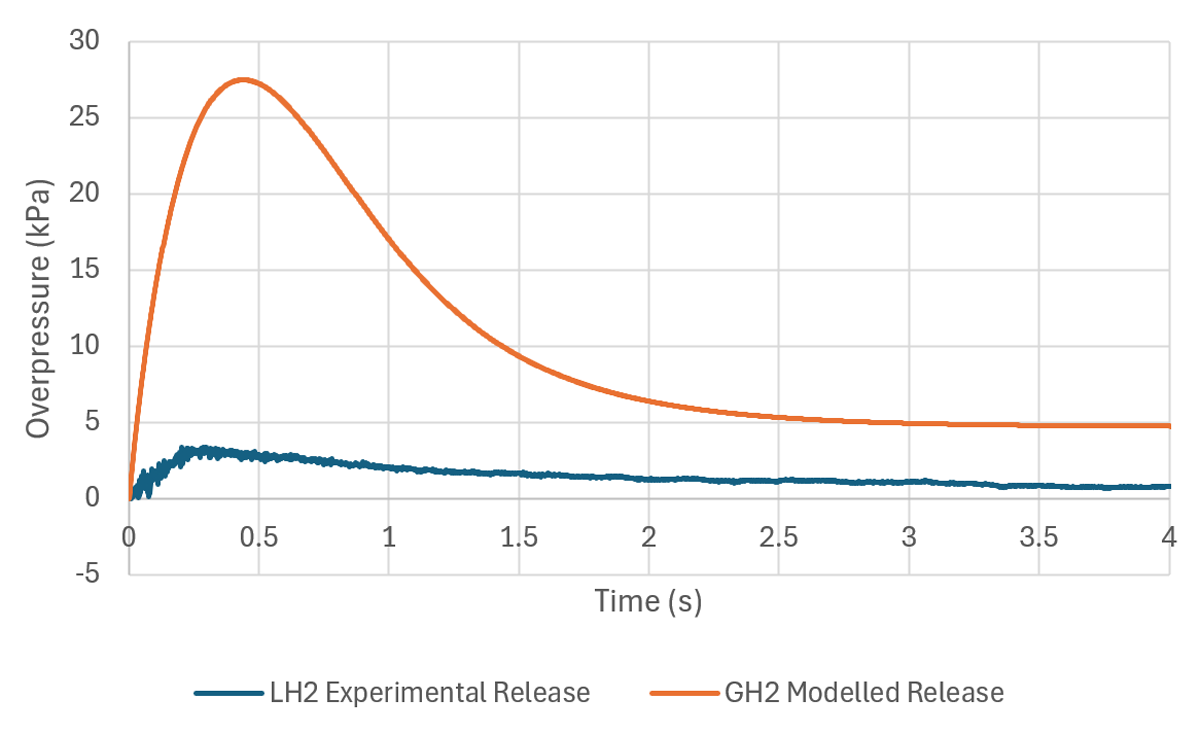
Figure 9
Graph of enclosure overpressure for LH2 experimental release (Test 3) and GH2 modelled release using Ulster University pressure peaking model.
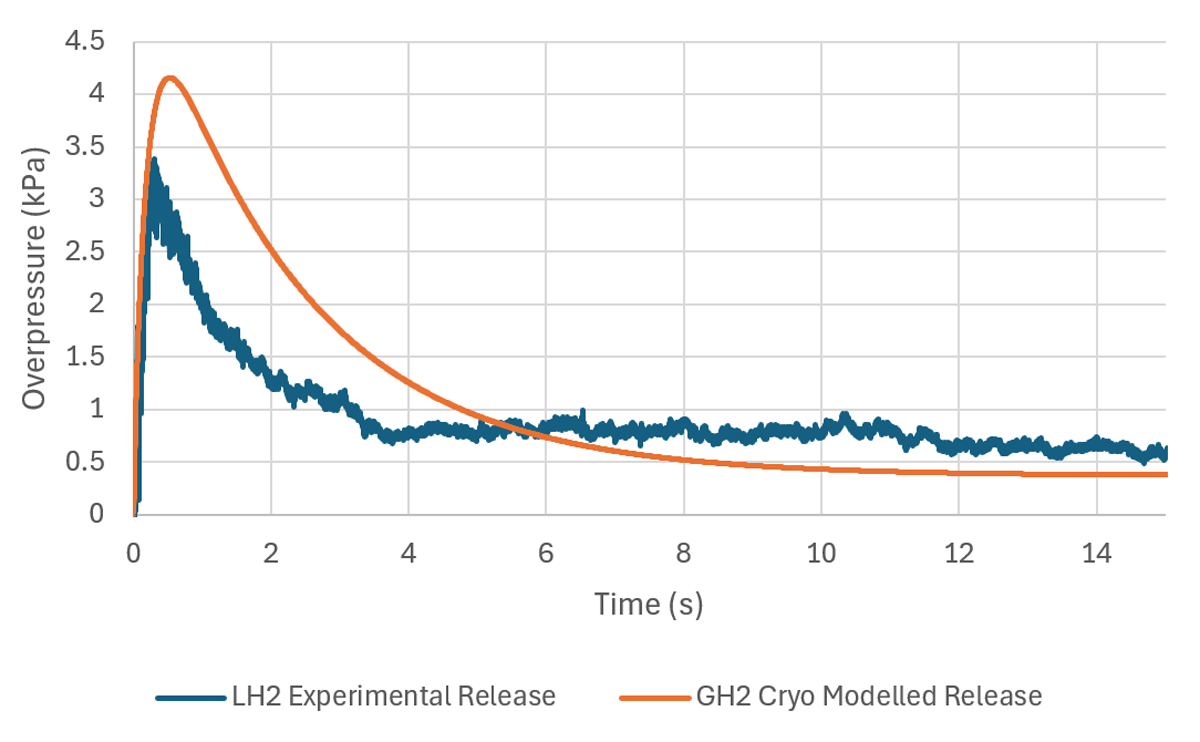
Figure 10
Graph showing enclosure overpressure for LH2 experimental release (Test 3) and GH2 modelled release using Ulster University model with cold enclosure (59 K) and increased Cd (0.998).
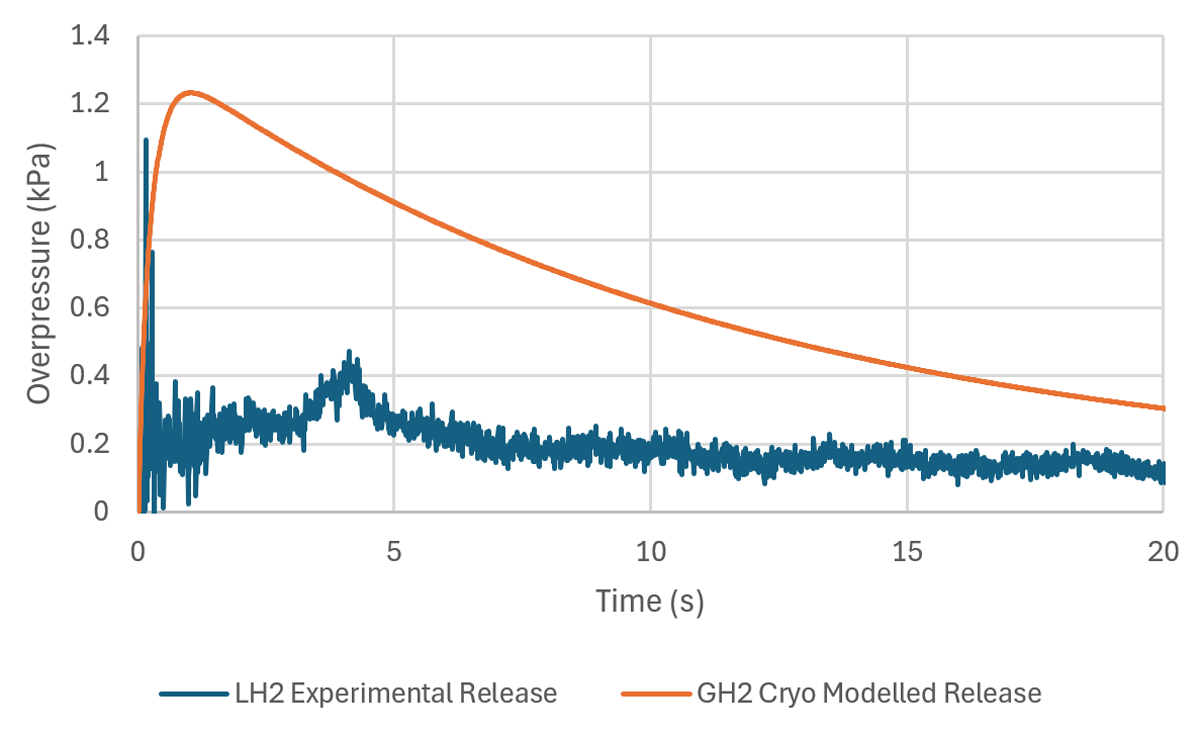
Figure 11
Graph showing enclosure overpressure for LH2 experimental release (Test 2) and GH2 modelled release using the Ulster University model with a cold enclosure (60 K) and increased Cd (0.998).