
Introduction
For hydrogen to be used safely as a zero-carbon fuel, the associated hazards must be fully understood and characterised. One novel hazard associated with hydrogen compared to other fuels is the ‘pressure peaking phenomenon’, where an overpressure can occur in a vented enclosure due to a leak of hydrogen. These overpressures may be capable of causing damage to structures even without ignition.
This phenomenon has been observed experimentally with helium and gaseous hydrogen (GH2) leaks (Lach, Gaathaug and Vaagsaether, 2020; Shentsov, Kuznetsov and Molkov, 2015) and modelled using numerical methods (Brennan and Molkov, 2013) and computational fluid dynamics (Cirrone et al., 2021).
The aim of this work was to investigate whether liquid hydrogen (LH2) leaks can result in pressure peaking, the extent of the overpressure and the effect of varying ventilation area. The potential damage from the overpressure is analysed, and the results are compared to modelled gaseous releases of an equivalent size.
GH2 pressure peaking
Experiments have shown that releases of buoyant gas (helium and hydrogen) into a vented enclosure can cause overpressure before decaying to a steady-state pressure (Shentsov, Kuznetsov and Molkov, 2015). This effect is not observed for releases of gases heavier than air. Figure 1 shows the largest hydrogen release rate test performed in the experimental program of Shentsov, Kuznetsov and Molkov.
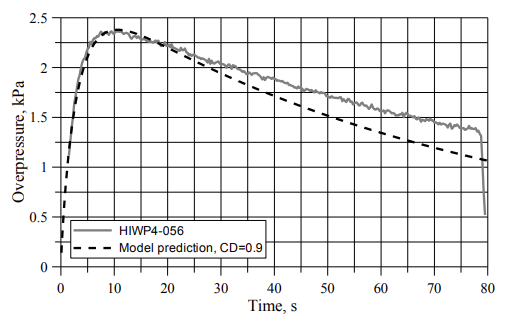
Figure 1
Pressure peaking test (1.086 g/s gaseous hydrogen leak in a 1 m3 enclosure with a 16.5-mm-diameter vent). The grey line shows experimental overpressure; the black dashed line shows the modelled overpressure (Shentsov, Kuznetsov and Molkov, 2015).
Larger-scale experiments conducted by Lach, Gaathaug and Vaagsaether (2020) released gaseous hydrogen into a 14.9 m3 chamber at flow rates of 1.9–10.10 g/s with vent areas of 0.0006–0.0020 m2. This achieved peak overpressures between 0.42 and 8.05 kPa. It was found that the larger enclosure did not have a significant effect on the peak overpressure achieved, but that the peak occurred later. Decreasing the ventilation area also caused the peak pressure to occur later.
A phenomenological model of hydrogen pressure peaking in a vented enclosure was developed by Brennan and Molkov (2013). The steady-state behaviour is found analytically by modelling the inlet flow using Bernoulli’s equation and modelling the vent flow as a subsonic orifice and equating the two. This results in an expression for the steady-state vent mass flow rate (1) and steady-state overpressure (2):
: vent flow rate (kg/s); C: coefficient of discharge; A: vent area (m2); γ: specific heat ratio of venting gas; Patm: atmospheric pressure (Pa); ρvent: density of gas at the vent (kg/m3); Pencl: enclosure pressure (Pa); : nozzle mass flow rate (kg/s).
Equation (2) shows that the steady-state overpressure is inversely proportional to the density of the fluid at the vent. This is important for the liquid tests because the density of vaporised cryogenic hydrogen can be many times higher than the density of ambient hydrogen gas.
To determine the transient pressure increase in the enclosure, a system of equations (enclosure mass, enclosure moles, ideal gas equation and vent flow rate) is solved numerically. As there is no spatial dimension in this approach, perfect mixing of hydrogen and air is assumed. If this approach were to be applied to LH2 leaks, a homogeneous temperature distribution would also have to be assumed.
Methodology
LH2 was released from a tanker through a 1″ ID pipe into a 1 m3 (1 m × 1 m × 1 m) enclosure with 3-mm-thick walls, shown in Figure 2. The enclosure had four passive vents, shown in Figure 2, to which the vent covers (bottom of Figure 3) were attached. These were swapped for blank flanges to reduce the vent area. The enclosure also had a larger foil burst panel to protect the enclosure in case of overpressurisation. The dimensions of the enclosure and vent geometry are shown in Figure 3.
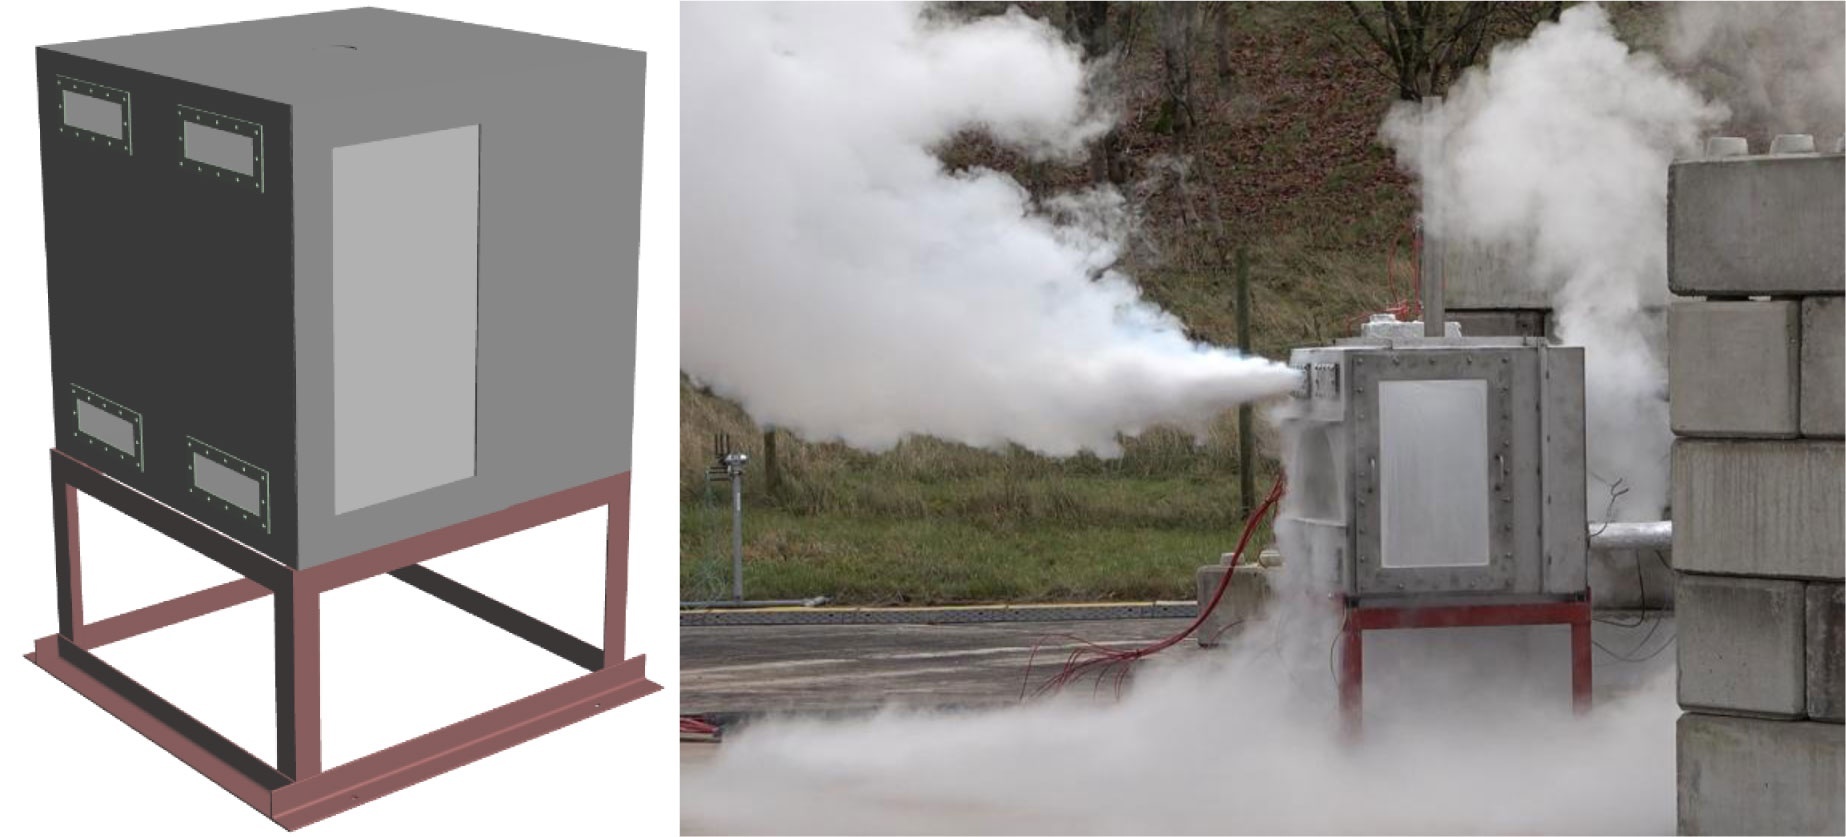
Figure 2
Left: A CAD model of the 1 m3 enclosure with four passive vents and a burst panel on a frame. Right: Image during Test 3 with one open vent.
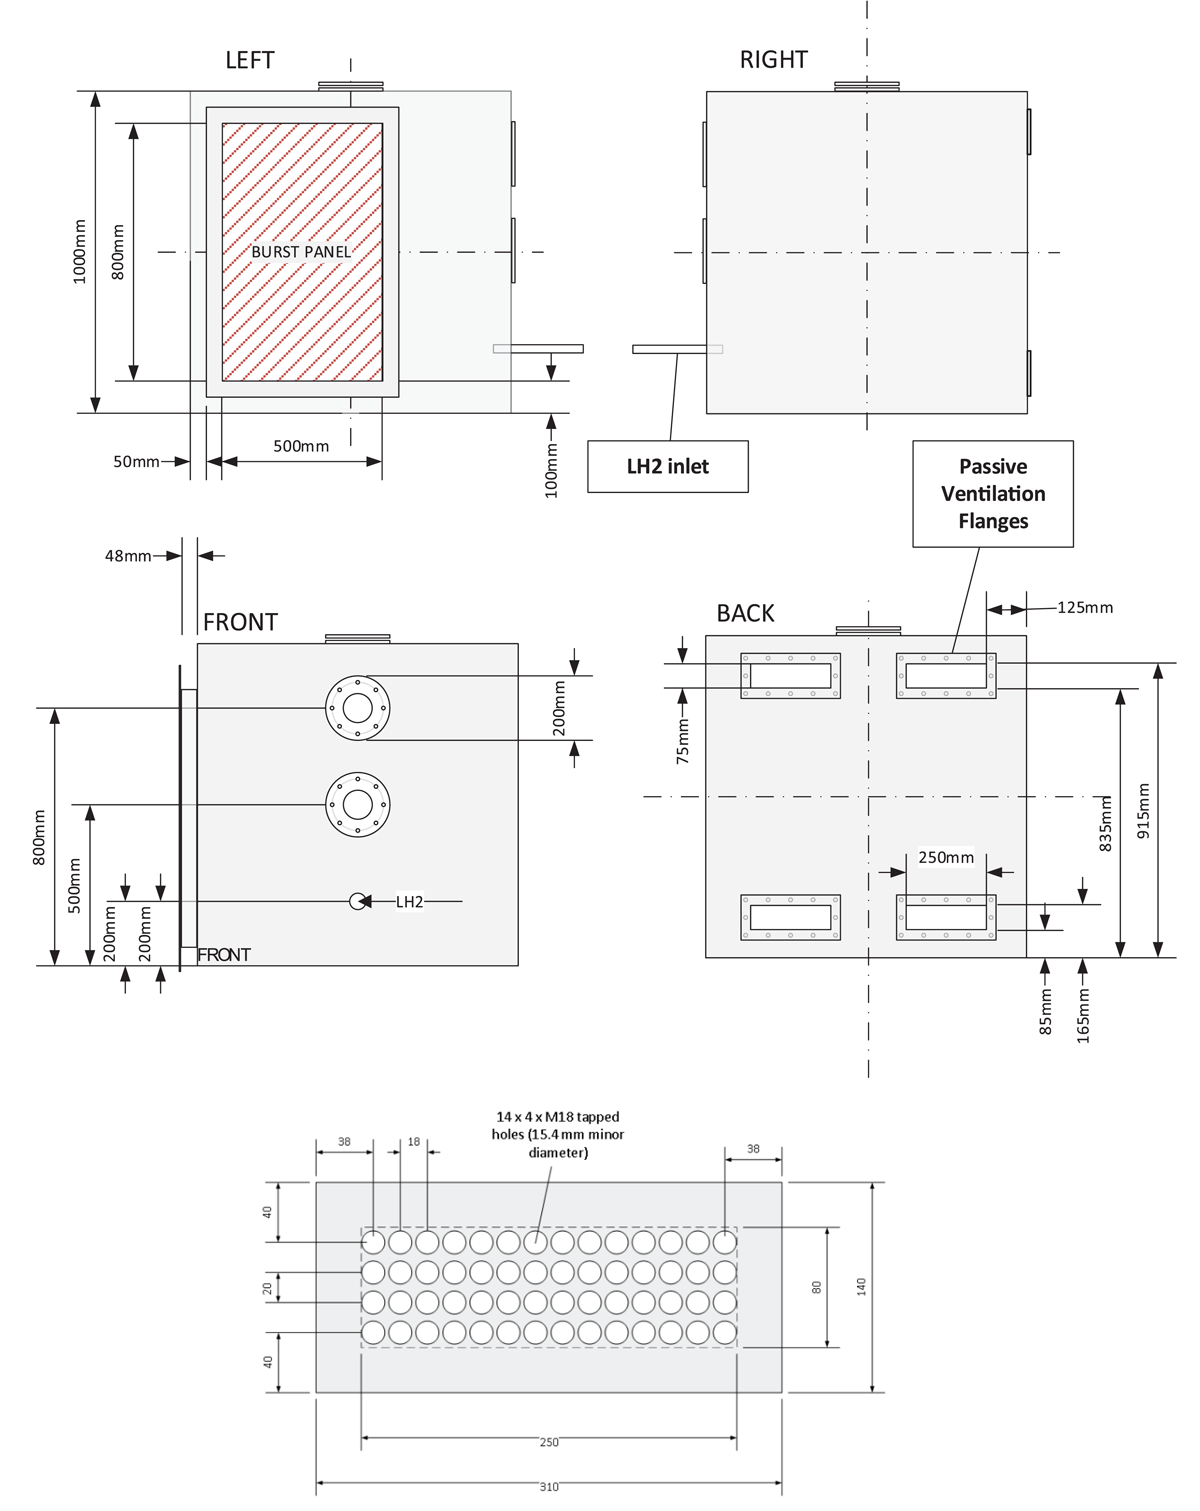
Figure 3
Top: Left, right, front and back dimensioned views of the 1 m3 enclosure. Note that for these tests, the two flanges on the front side of the enclosure were blanked. Bottom: Dimensions of plates attached to open flanges. The total ventilation area of each plate is 0.0104 m2.
Three tests were conducted with vent areas of 0.0416, 0.0208 and 0.0104 m2.
A sensing array inside the enclosure measured temperature and hydrogen concentration at various points. Gas in the enclosure was sampled and piped away from the experiment to the hydrogen sensors with a total sampling flow rate of approximately 60 L/min. Two pressure transducers (PT1, PT2) were attached to the box on the right side of the enclosure (Figure 3) at two points to measure the increase in pressure in the enclosure. Mass flow rate was not measured directly, but using the pressure and pipe diameter and correlating to previous experimental LH2 releases conducted at HSE, the mass flow was estimated to be 180 g/s. Details of experimental instrumentation are given in Table 1.
Table 1
Instrumentation used in experiments.
| MEASUREMENT | INSTRUMENT | RANGE | ACCURACY | UNCERTAINTY |
|---|---|---|---|---|
| Release pressure | ESI IS 4200EXH0016AB Pressure Transducer | 0.1–1.1 MPa | ±0.25% | ±0.002 MPa |
| Release temperature | Type T thermocouple, 2 m × 1.5 mm | 4.2–400 K | ±8 K (@ 20 K) | ±8 K |
| Enclosure internal temperature | Type T thermocouple, 2 m × 1.5 mm | 77–400 K | ±1 K | ±1 K |
| Enclosure wall temperature | Type T thermocouple, 2 m × 1.5 mm | 77–400 K | ±1 K | ±1 K |
| Enclosure internal overpressure (PT1, PT2) | WIKA A-10 pressure transducer | 0–10 kPa | ±0.5% | ±0.03 kPa |
Results
Test 1
For the first test, all four vents were open, resulting in a total vented area of 0.0416 m2. LH2 was released into the enclosure at 330 kPa. Figure 4 shows the pressure measured at two locations on the wall of the test rig. When LH2 was released into the test rig at 153 s, a sharp increase in overpressure was measured by both pressure transducers. PT1 measured a maximum overpressure of 0.30 kPa, and PT2 measured a maximum overpressure of 0.55 kPa. The burst panel, which was rated to fail at an overpressure around 12 kPa, did not rupture. The overpressure in the test rig then decayed over 26 s to a steady state of 0.00 kPa.
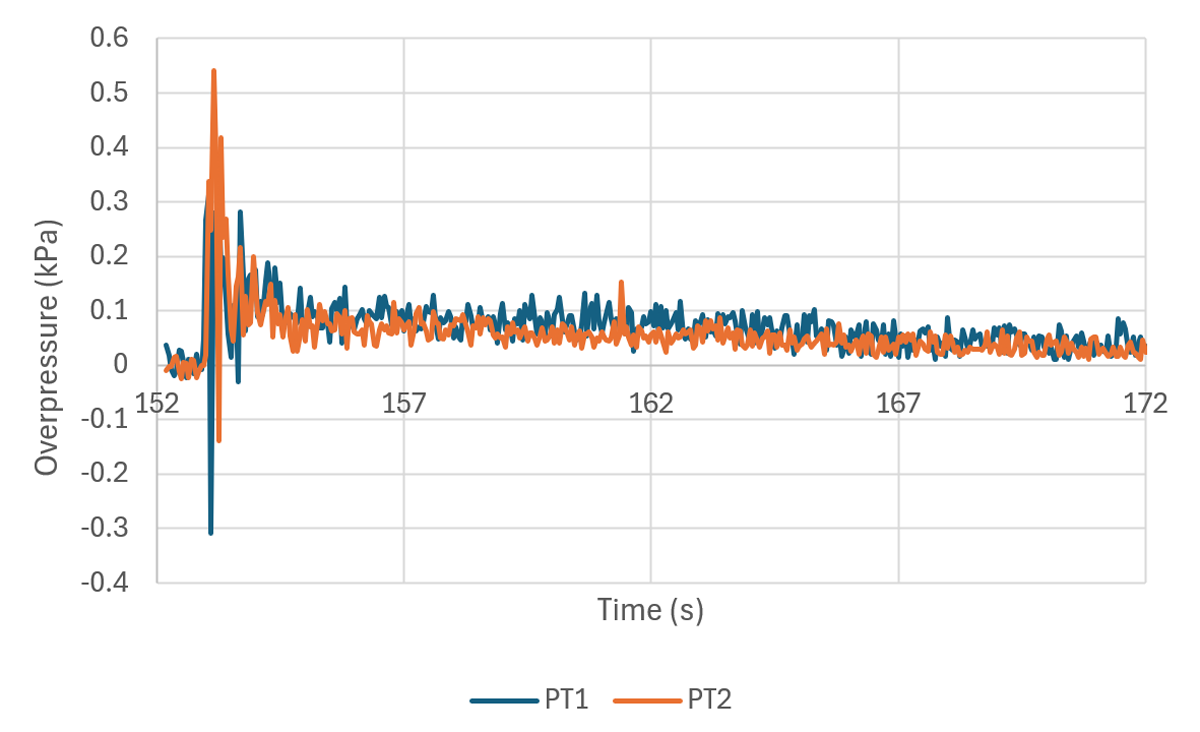
Figure 4
Test 1 enclosure overpressure.
The peak overpressure was achieved 0.15 s after the start of the release. The logging rate of the pressure transducers was 20 Hz, which may not have been fast enough to capture the true peak pressure.
Test 2
For the second test, the bottom two vent flanges were blanked off, and the two open vents had a total vent area of 0.0208 m2.
LH2 was released into the enclosure at 330 kPa. Figure 5 shows the pressure measured in the test rig. Again, a sharp increase in pressure was observed when the LH2 release started at 167 s. PT1 measured a maximum overpressure of 1.10 kPa, and PT2 measured a maximum overpressure of 1.20 kPa. The burst panel did not rupture. The overpressure in the test rig then decayed over 63 s to a steady state of 0.05 kPa.
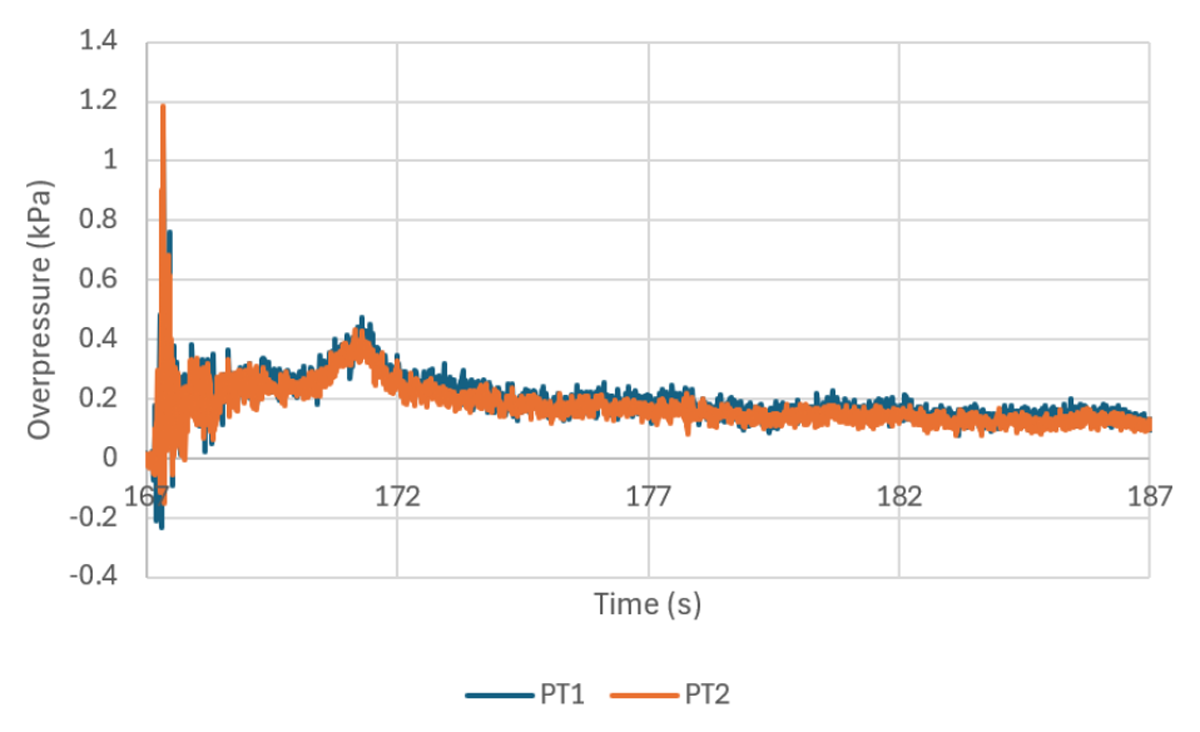
Figure 5
Test 2 enclosure overpressure.
The peak overpressure was achieved 0.2 s after the start of the release. It should be noted that the peak pressure was achieved before the end of the pressure drop due to opening the release valve (i.e. before the maximum LH2 flow rate is achieved).
Interestingly, during this test, there was a secondary peak in overpressure of 0.40 kPa which occurred 3.9 s after the primary overpressure peak. The reason for this is currently unclear.
Test 3
For the third test, the bottom two vent flanges and the top left vent flange were blanked off so that only the top right vent was open with a total vent area of 0.0104 m2.
The pressure at the release rig prior to opening the release valve was 340 kPa. Figure 6 shows the pressure measured in the cube. Again, a sharp increase in pressure was observed when the LH2 release started at 168 s. PT1 measured a maximum overpressure of 3.30 kPa, and PT2 measured a maximum overpressure of 3.35 kPa. Maximum overpressure was achieved 0.3 s after the start of the release. Pressure in the cube then decayed rapidly in 3.7 s to 0.60 kPa, where it plateaued for 6.8 s. The overpressure in the cube then decayed further over 56 s to a steady state of 0.20 kPa. The burst panel did not rupture.
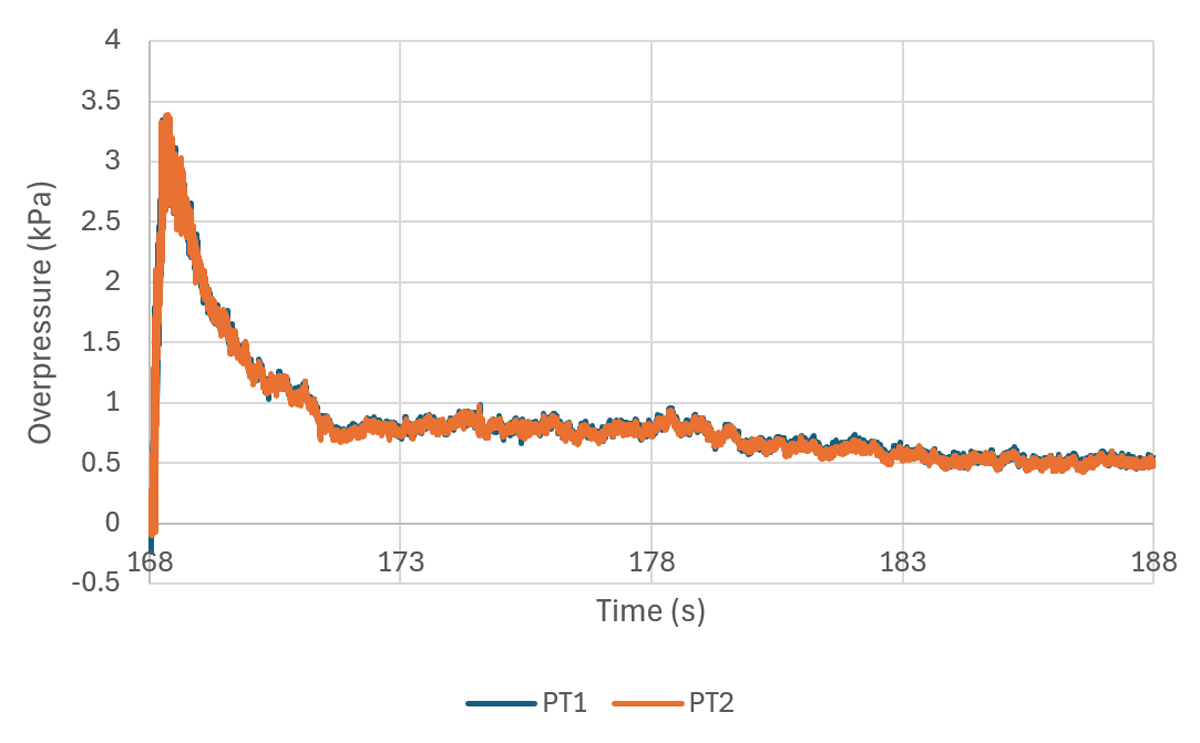
Figure 6
Test 3 enclosure overpressure.
Peak pressure was achieved 0.33 s after the start of the release. As in the previous test, the peak pressure was achieved before the end of the pressure drop due to opening the release valve (i.e. before the maximum LH2 flow rate is achieved). The maximum rate of pressure increase was 33.3 kPa/s.
Discussion
The time-to-peak pressure from the start of the release increases as a vent area increases for the LH2 experimental releases. This is notable because the opposite phenomenon is observed for gaseous releases. In Tests 2 and 3, plateaus in overpressure are observed for a few seconds before the overpressure reaches steady state, which is not typically observed during gaseous releases. This discontinuity in gradient may be indicative of LH2-specific pressure peaking behaviour because it is not observed in GH2 pressure peaking.
To model transient pressure peaking using a numerical model, it was assumed that the mixture in the enclosure was homogeneous with respect to hydrogen concentration and temperature. Figure 7 shows the measured temperature distribution in the enclosure for Test 3 at 168.5 s, just after the peak overpressure occurs. Temperature in the enclosure ranges from 107 to 275 K, with colder temperatures being restricted to the jet axis. It should also be noted that the temperature probes will have non-insignificant thermal inertia, so it is possible for this temperature range to be even wider in reality.
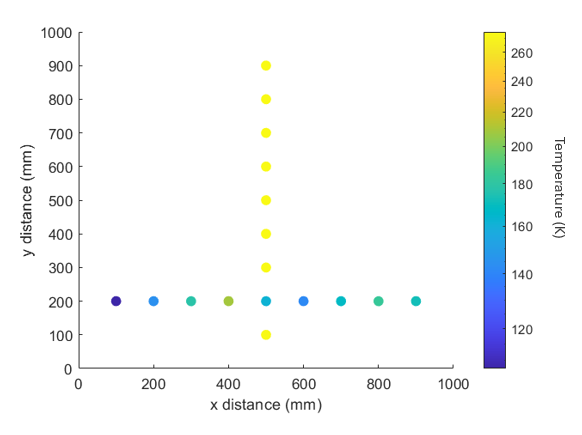
Figure 7
Temperature distribution in the enclosure during Test 3 at 168.5 s. All temperature probes are in the plane of the LH2 inlet, with the inlet at (0.200).
Damage analysis
Peak overpressures achieved by the tests are comparable to unconfined, uncongested hydrogen-air deflagrations (flash fires); however, the overpressure behaviour is significantly different because the positive phase duration is much longer than for explosive overpressures. Therefore, it is important to consider the impulse of the overpressure rather than only comparing peak overpressures.
Because an overpressure is observed throughout the continuous LH2 release, the associated impulse and phase duration are dependent on the duration of the LH2 release (the total impulse of the overpressure will keep increasing as the LH2 release continues, and the positive phase duration is essentially the same as the LH2 release duration). Overpressure reaches a steady state asymptotically, and therefore in order to determine the duration of the overpressure, the trace is truncated to the point where 95% of the steady state is achieved; the overpressure before this time is taken to be the positive phase, as shown in Figure 8.
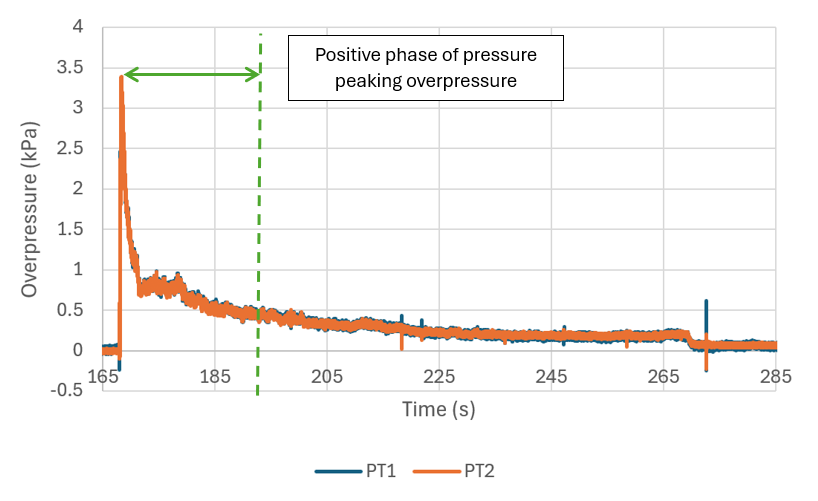
Figure 8
Graph of overpressure during Test 3 showing the positive phase cutoff.
Using this assumption, the positive phase duration is taken to be 32 s. This is much longer than the positive phase duration for explosive overpressures, which are on the order of 10 ms. The impulse is the integral of overpressure with respect to time, which is 22,500 Pa-s, much higher than for an explosion (on the order of 100s Pa-s) due to the extended length of the positive phase duration. Even considering only the sharp peak in the period 0–4 s, the impulse is 6,000 Pa-s, an order of magnitude larger than for an explosion. Because of the high impulse and relatively low rate of pressure rise, a pressure wave from this unignited pressure peaking will act on a structure quasi-statically, and the structure will not experience an increase in strength due to high strain-rate behaviour (an apparent increase that should be taken into account when designing structures that may be exposed to pressure peaking phenomena).
However, the overpressures observed in these tests are unlikely to be high enough to cause significant damage to even very light wooden structures. Higher overpressure could be caused by increased mass flow or decreased vent area.
Comparison with GH2 pressure peaking
The pressure peaking phenomena for gaseous releases are modelled using the pressure peaking phenomenon for unignited releases tool created by Ulster University (Shentsov, Makarov and Molkov, 2019). Only the third pressure peaking test was analysed as it had a high enough logging rate to capture transient phenomena.
The gaseous release was modelled using the parameters provided in Table 2.
Table 2
Input parameters into the Ulster University GH2 pressure peaking model.
| PARAMETER | SYMBOL | VALUE | UNIT |
|---|---|---|---|
| Atmospheric pressure measured in experiment | Patm | 96,900 | Pa |
| Enclosure temperature | Tencl | 280 | K |
| Enclosure volume | Vencl | 1 | m3 |
| Vent height | Hvent | 0.1 | m |
| Vent width | Wvent | 0.104 | m |
| Hydrogen mass flow rate | 0.18 | kg/s | |
| Coefficient of discharge | Cd | 0.6 | – |
| Integration time step | Δt | 0.002 | s |
| No. of time steps | nmax | 1000 | – |
The vent area is aggregated into a single rectangular opening with the same total area as the LH2 experiment.
A modelled gaseous release of 180 g/s achieves a maximum overpressure of 27.6 kPa in 0.43 s before decaying to a steady state of 4.6 kPa. The maximum rate of pressure increase is 149 kPa/s and the impulse (applying the same method as for the LH2 experiment) is calculated to be 21,600 Pa-s.
Figure 9 shows that for an equivalent mass flow in the same volume enclosure, the LH2 experiment was found to achieve peak pressure approximately 8.3 times lower than the GH2 modelled release. The peak pressure was achieved 0.11 s faster for the LH2 experiment. The steady-state overpressure in the enclosure is also lower for the LH2 experiment. However, the LH2 experiment takes much longer to reach steady state; hence, the LH2 experiment and GH2 model have similar impulses despite the GH2 model having a much higher peak pressure. It is known that pressure peaking does not occur for releases of heavier-than-air gases, so it is assumed that the largest contributor to the decrease in peak overpressure for the LH2 experiment is the increased density of the venting fluid (approximately 3.7 times greater for cryogenic hydrogen).
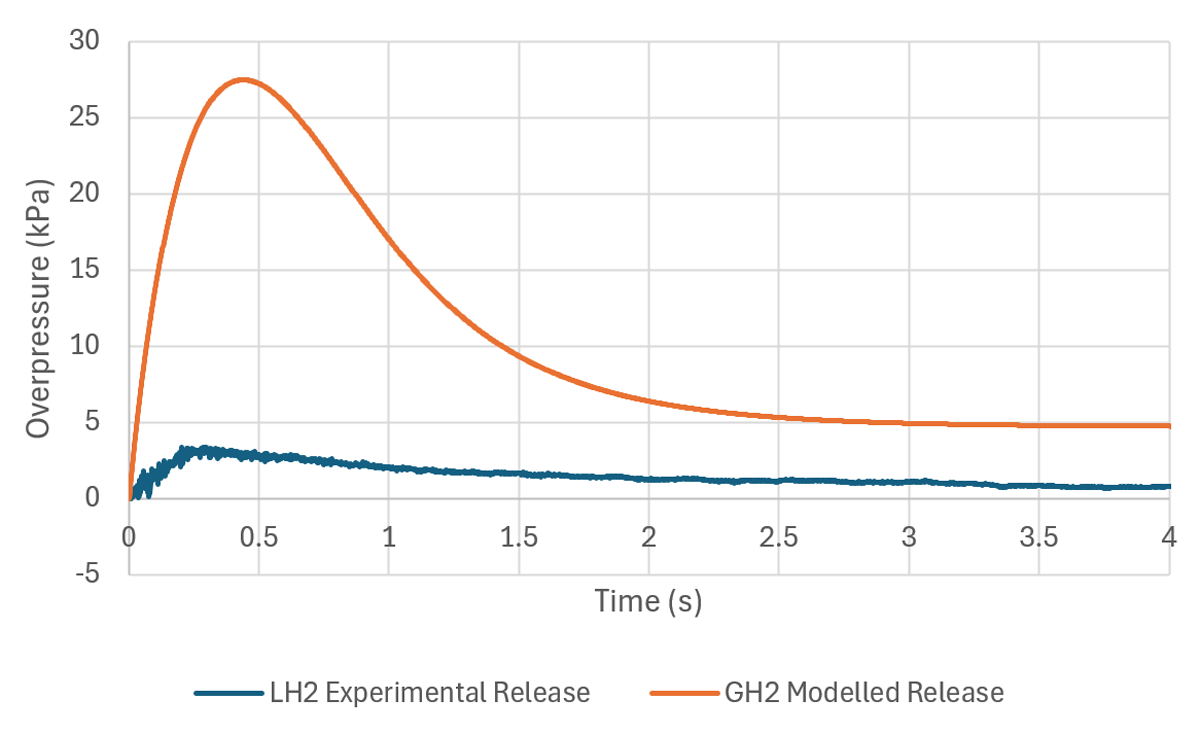
Figure 9
Graph of enclosure overpressure for LH2 experimental release (Test 3) and GH2 modelled release using Ulster University pressure peaking model.
By setting the inlet mass flow equal to the vent mass flow, which must be true for the system to be at steady state, equations (1) and (2) can be combined to produce an equation for the discharge coefficient, which is dependent on the ambient and enclosure pressures (at steady state) and the specific heat ratio of the venting gas:
This yields a discharge coefficient of 0.998 for the LH2 pressure peaking experiment. This discharge coefficient is much larger than those found experimentally by Shentsov, Kuznetsov and Molkov (2015) or by Lach, Gaathaug and Vaagsaether (2020), which range between 0.65 and 0.75. One explanation for this is that the enclosure was not fully sealed at the LH2 inlet or other flanges, and therefore the vent area would be larger than 0.0104 m2, with the increased vent area being accounted for by a larger discharge coefficient. The very low pressure differential across the vent may also result in a high discharge coefficient.
Equations (1) and (2) are used to model the steady-state behaviour of Test 3. In Test 3, the steady-state vent temperature was measured to be 59 K. Assuming that the concentration at the vent was 100% H2, the density of the venting hydrogen is 0.412 kg/m3 (Leachman et al. 2009). The specific heat ratio at this temperature is 1.67.
Using equation (1) with a density of 0.412 kg/m3, an overpressure of 0.2 kPa, a vent area of 0.0104 m2, a specific heat ratio of 1.67 and a coefficient of discharge of 0.998, the steady-state vent flow rate can be calculated to be 177 g/s, which is close to the nozzle flow rate of 180 g/s.
Using equation (2) with a density of 0.412 kg/m3, nozzle flow rate of 0.18 kg/s and vent area of 0.0104 m2, a steady-state enclosure overpressure of 0.36 kPa is predicted, which is double the experimental steady-state overpressure of 0.2 kPa.
The release was modelled again using the same parameters as in Table 2 except for the enclosure temperature being equal to the steady-state vent temperature, 59 K, and the discharge coefficient being equal to the calculated value, 0.998. This results in a peak overpressure of 4.1 kPa and a steady-state overpressure of 0.38 kPa as shown in Figure 10.
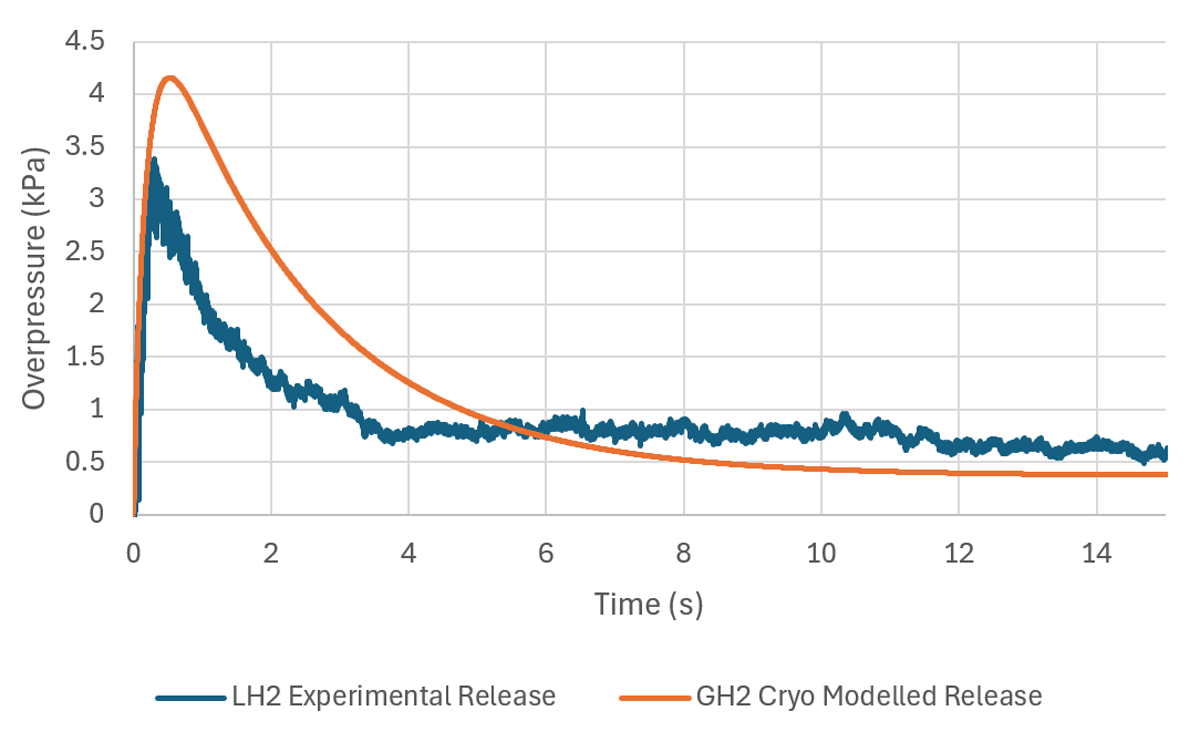
Figure 10
Graph showing enclosure overpressure for LH2 experimental release (Test 3) and GH2 modelled release using Ulster University model with cold enclosure (59 K) and increased Cd (0.998).
Agreement between the model and the experiment is good in the transient period (below 4 s) and then deviates beyond that. The decay in overpressure is slower for the modelled release but falls below the experimental release at 6 s, around the point where the experimental overpressure first plateaus. This may indicate that there are additional phenomena occurring, causing the plateau and slower decay, which are not captured in the model.
The impulses of the experiment and model are similar (12,000 Pa-s for the modelled release, 16,900 Pa-s for the experimental release).
This approach was also applied to Test 2, which had a steady-state vent temperature of 60 K. The modelled overpressure is compared to the test overpressure in Figure 11.
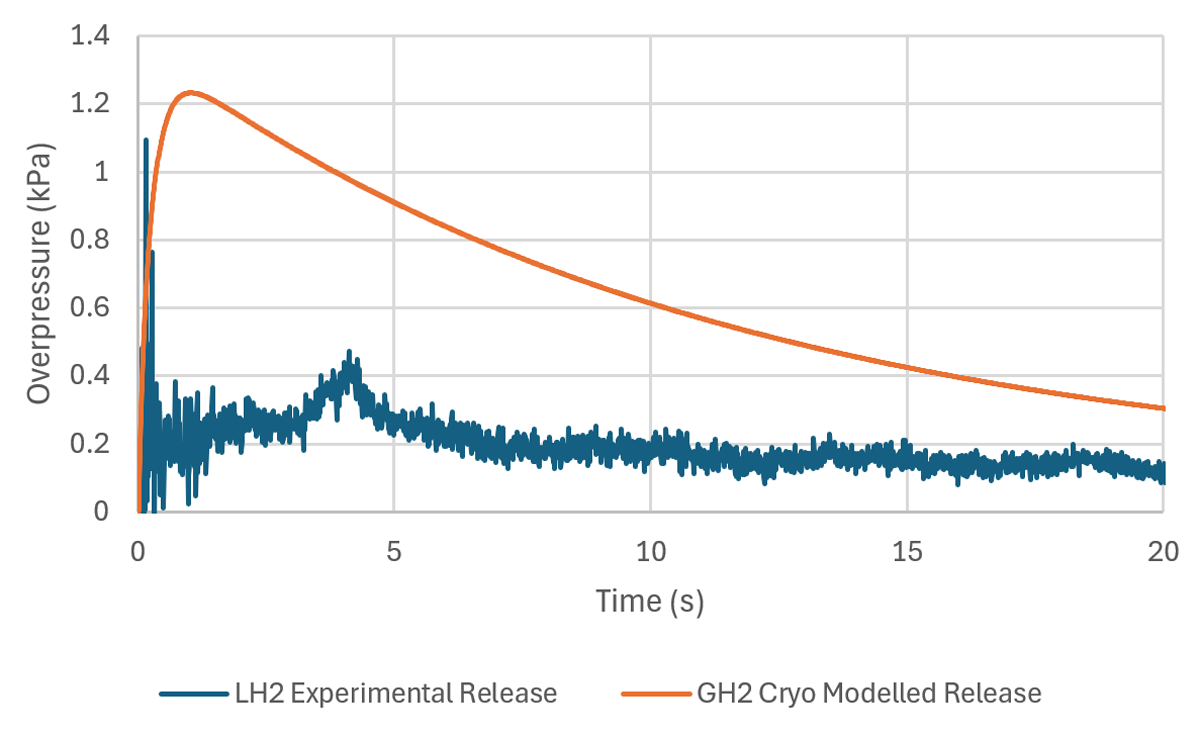
Figure 11
Graph showing enclosure overpressure for LH2 experimental release (Test 2) and GH2 modelled release using the Ulster University model with a cold enclosure (60 K) and increased Cd (0.998).
Agreement between the modelled overpressure and Test 2 experimental overpressure is worse, especially for the overpressure decay, though the model produces a similar peak overpressure to the experimental data.
Notably, these analytical models do not consider the cooling and condensation of air, which will cause a reduction in overpressure, nor do they account for the phase change of LH2 as it vaporises to a cryogenic gas. The model has also not been validated for liquid or cryogenic hydrogen releases. It is worth restating that the LH2 mass flow rate is estimated, and any error in the estimation will have a significant impact on the modelled overpressure. As such, comparisons between the modelled and experimental results should be taken to be indicative rather than definitive. However, the modification of parameters based on experimental data may serve to advise changes to the model to account for cryogenic pressure peaking phenomena as well as provide validation data for future models.
Conclusion
Liquid hydrogen was released into an enclosure with a variable vent area to assess the extent of pressure peaking for LH2 leaks. It was found that pressure peaking did occur and that the peak overpressure increased as the vent area decreased. Decreasing the vent area had the effect of increasing the time-to-peak overpressure.
The overpressure was analysed, and it was found that the pressure peaking from even the smallest vent area in the LH2 experiment conducted was unlikely to cause significant damage to a structure. The experimental results for the third test were compared to modelled GH2 releases of the same mass flow rate, enclosure volume and vent area, and it was found that the peak overpressure due to LH2 pressure peaking in one of the experiments was 8.3 times lower than the overpressure of a modelled GH2 release of the same mass flow rate, which is attributed to the higher density of cryogenic hydrogen.
The results of these experiments may aid in the development of models for cryogenic pressure peaking phenomena and the design of enclosures and vent sizes to mitigate damage arising from pressure peaking. The results show that, generally, pressure peaking from LH2 releases is not a significant hazard compared to pressure peaking from GH2 releases.
Future work may include the development of analytical or numerical models that take into account the contribution of air cooling and condensation to pressure peaking overpressure. As LH2 technologies develop and the size and structure of typical transfer connection spaces become clearer, it may be useful to conduct pressure peaking experiments on a more realistic transfer connection space. The effect of increased vaporisation rate (due to increased surface area or heating) on the pressure peaking of LH2 releases, particularly for subcooled LH2 releases, would contribute to a better understanding of this phenomenon.
Data Accessibility Statement
The data from these experiments can be found under the pressure peaking section of the following dataset: https://dataverse.no/dataset.xhtml?persistentId=doi:10.18710/JXJP0H.
Additional sensor information can be found in the following dataset: https://dataverse.no/file.xhtml?persistentId=doi:10.18710/JXJP0H/SUAIAR.
Disclaimer
This paper and the work it describes were undertaken by the Health and Safety Executive (HSE). Its contents, including any opinions and/or conclusions expressed or recommendations made, do not supersede current HSE policy or guidance.
Competing Interests
Janni Vizma is a reviewer for Hydrogen Safety journal. Authors have no other competing interests.