
Figure 1
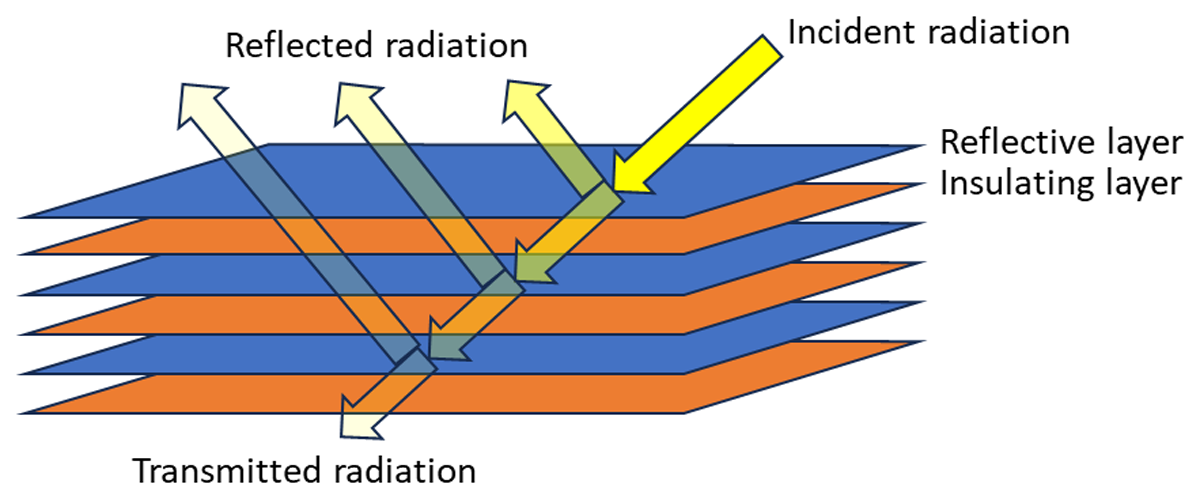
A simplified diagram showing how MLI prevents transfer of radiation across the vacuum space. Secondary radiation reflections within the MLI are not shown for ease of understanding (taken from Goff, 2024). Abbreviation: MLI, multi-layer insulation.
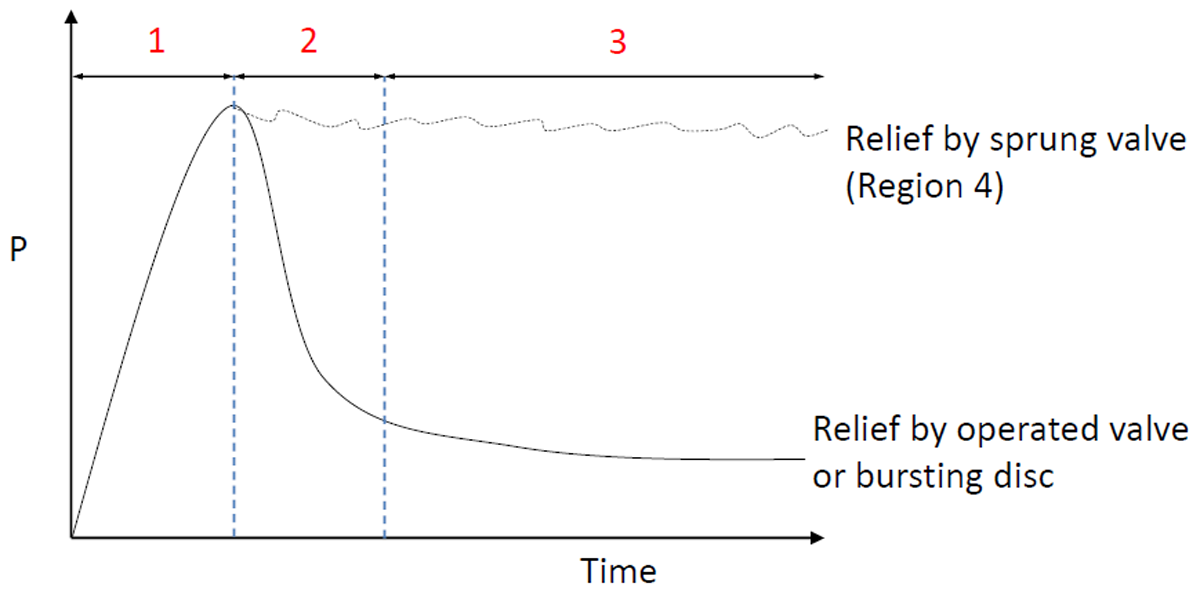
Figure 2
A schematic to show how the vessel pressure (P) would vary in an LH2 vessel during vacuum failure. Abbreviation: LH2, liquid hydrogen.
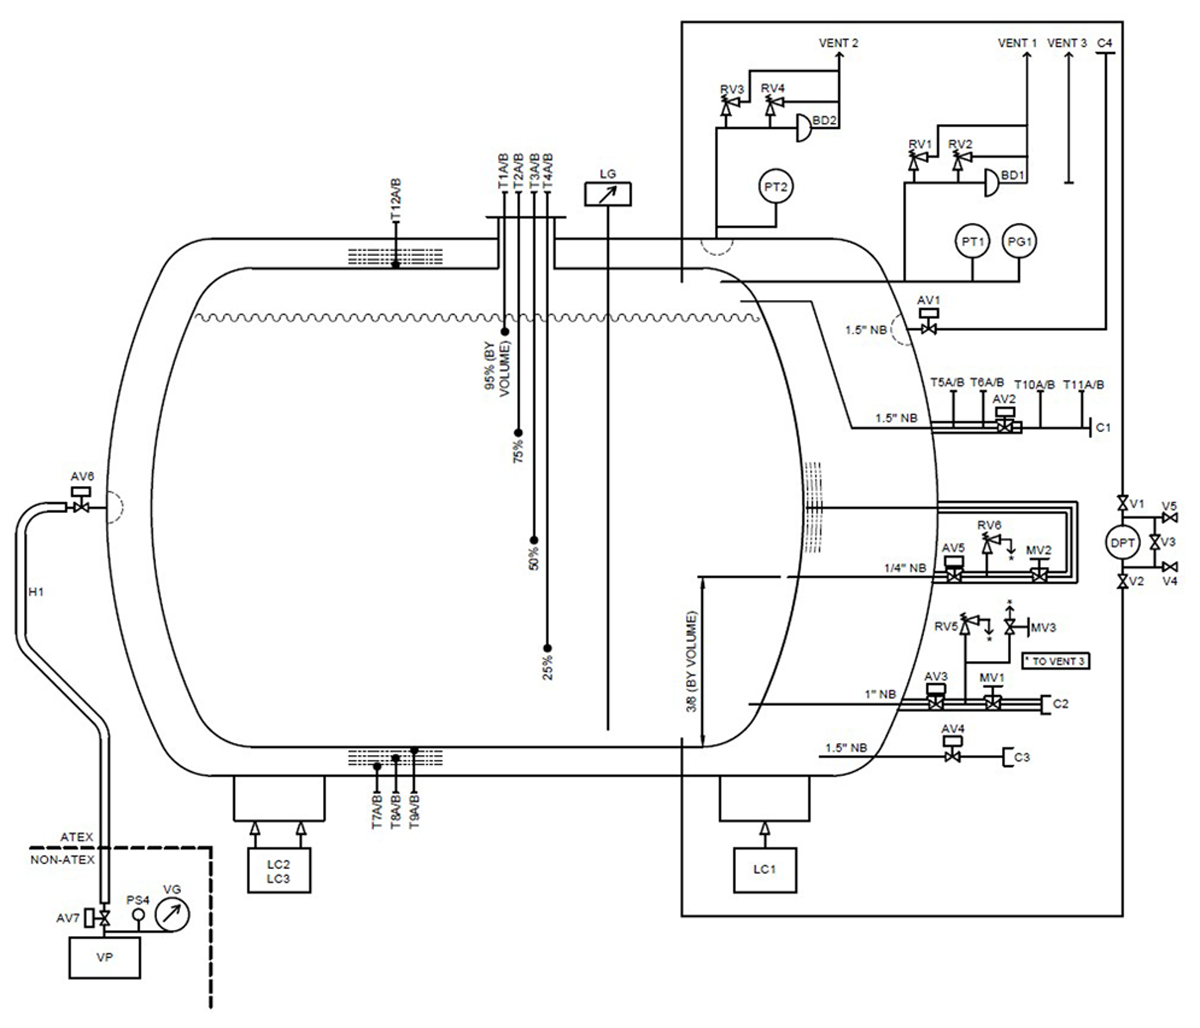
Figure 3
The final version of the P&ID for the tank. Pipework with three parallel lines are the super-insulated vacuum lines (SIVL).
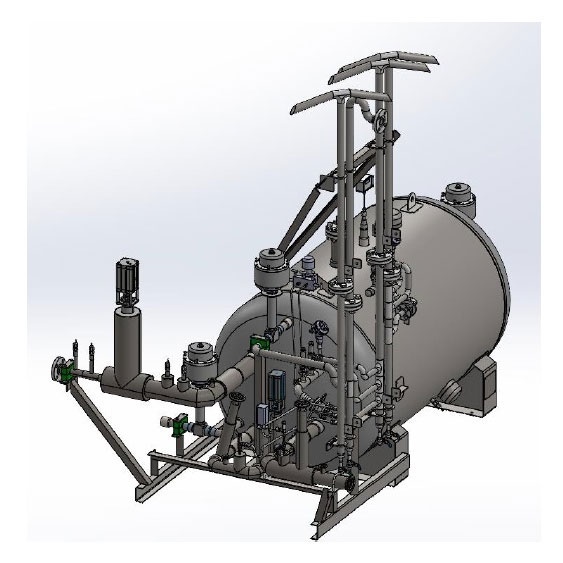
Figure 4
An overall view of the tank design.
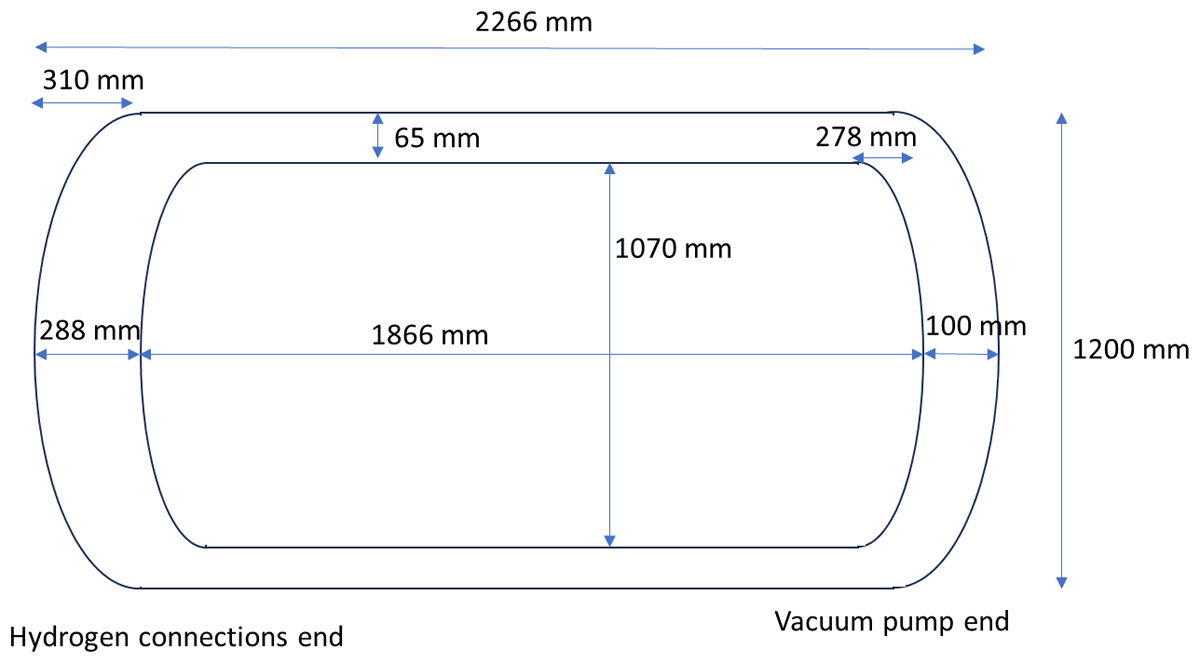
Figure 5
The dimensions of the inner and outer tanks.
Table 1
A timeline of events during the experiment.
| TIME (S) | DESCRIPTION OF EVENT |
|---|---|
| 20 | Depressurised inner tank from ~0.1 barg that came from the filling and self-pressurisation before start of experiment, vent left closed afterwards |
| 40 | Start of N2 flow through the Bronkhorst flow controller |
| 60 | Flow of N2 stopped |
| 65 | Flow of N2 restarted, and from this point onwards the Bronkhorst was adjusted so the rate of gas supplied matched the rate of condensation |
| 125 | Experimental vent (valve AV2) opened, and inner tank depressurised from 1.3 barg |
| 125–310 | Experimental vent left open to measure steady-state boil-off to compare to the standards |
| 200–250 | Pressure in outer tank slowly decreasing, giving a minimum value for the N2 flow into the outer tank to replace the N2 that has condensed out of the gas phase |
| 250–310 | Pressure in outer tank slowly increasing, giving a maximum value for the N2 into the outer tank flow to replace the N2 that has condensed out of the gas phase |
| 310–640 | Experimental vent closed and inner tank allowed to pressurise to 3 barg |
| 640 | Depressurised inner tank from 3 barg |
| 710 | N2 flow stopped |
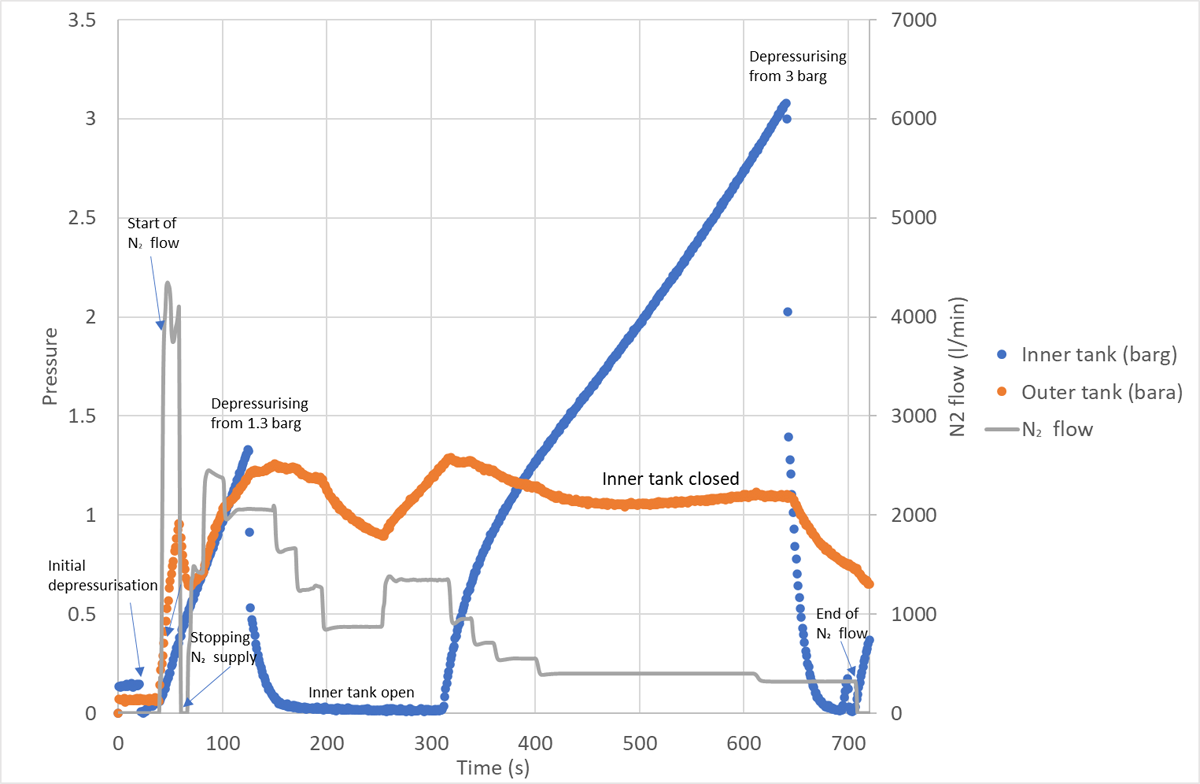
Figure 6
The pressure measured in the inner and outer tanks. The nitrogen flow into the vacuum space is also shown.
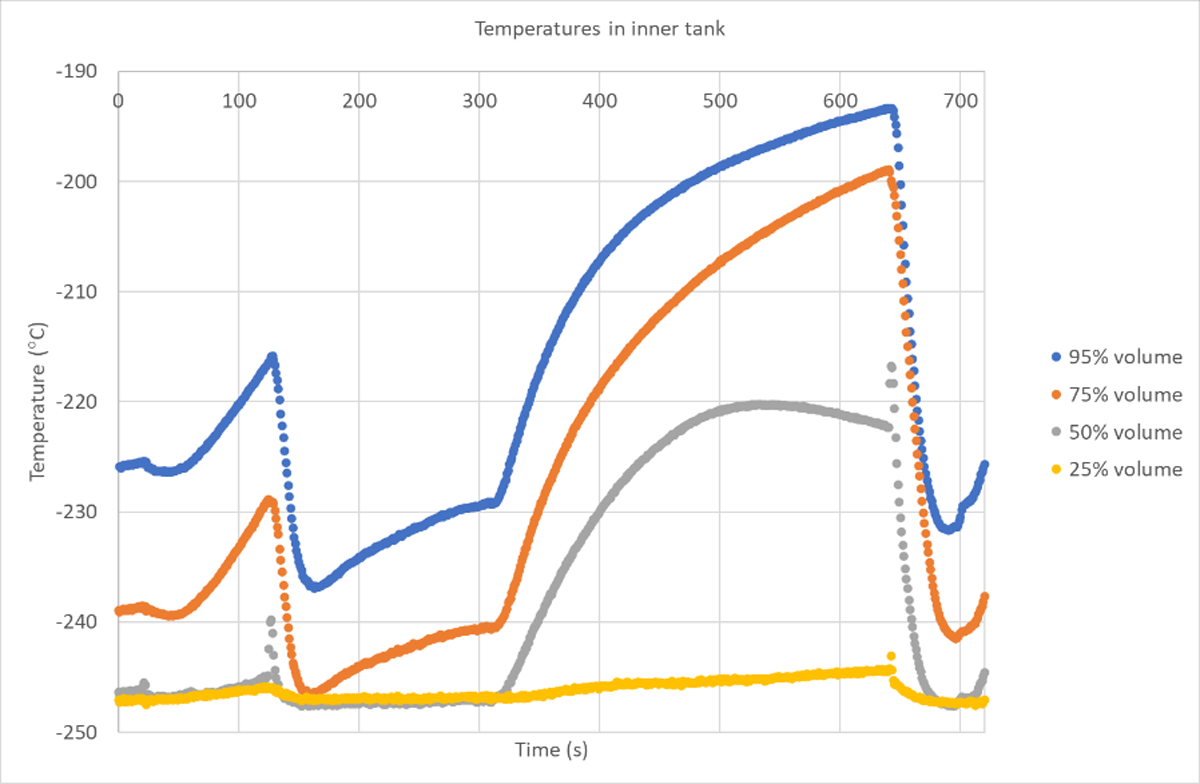
Figure 7
The temperatures measured in the inner tank.
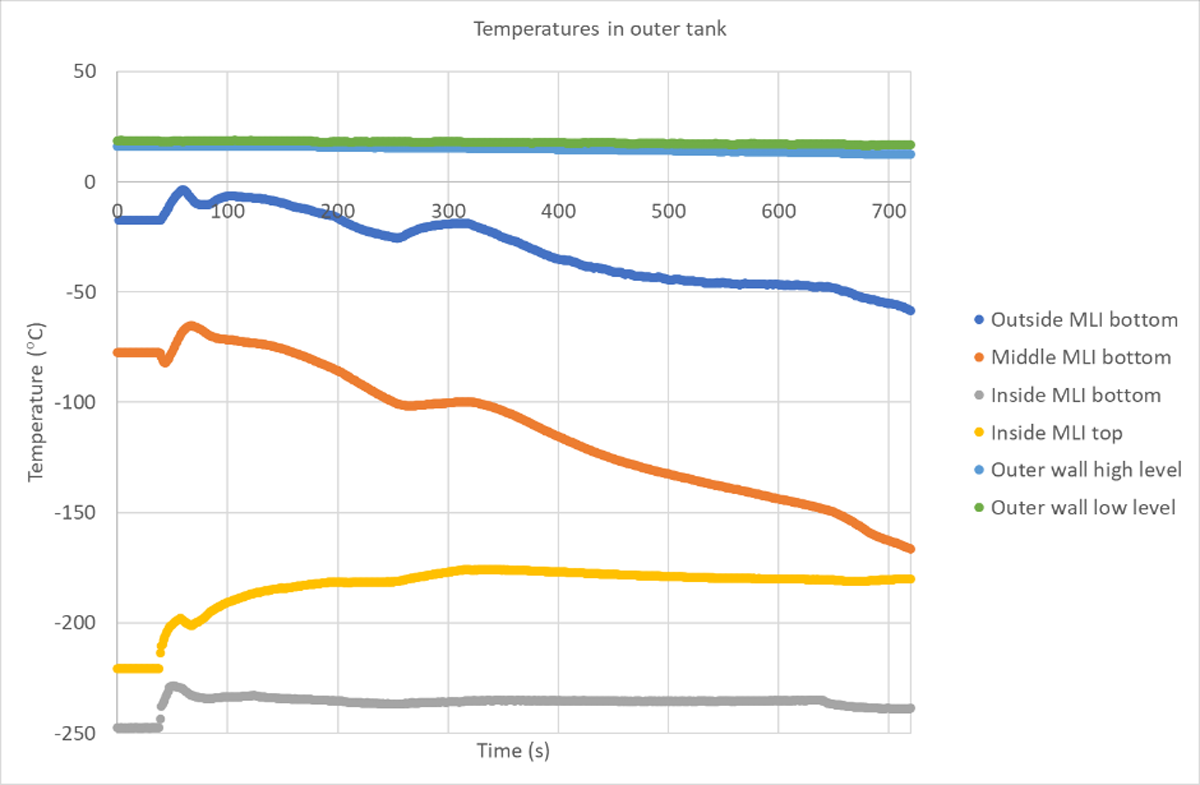
Figure 8
The temperatures measured in the outer tank.
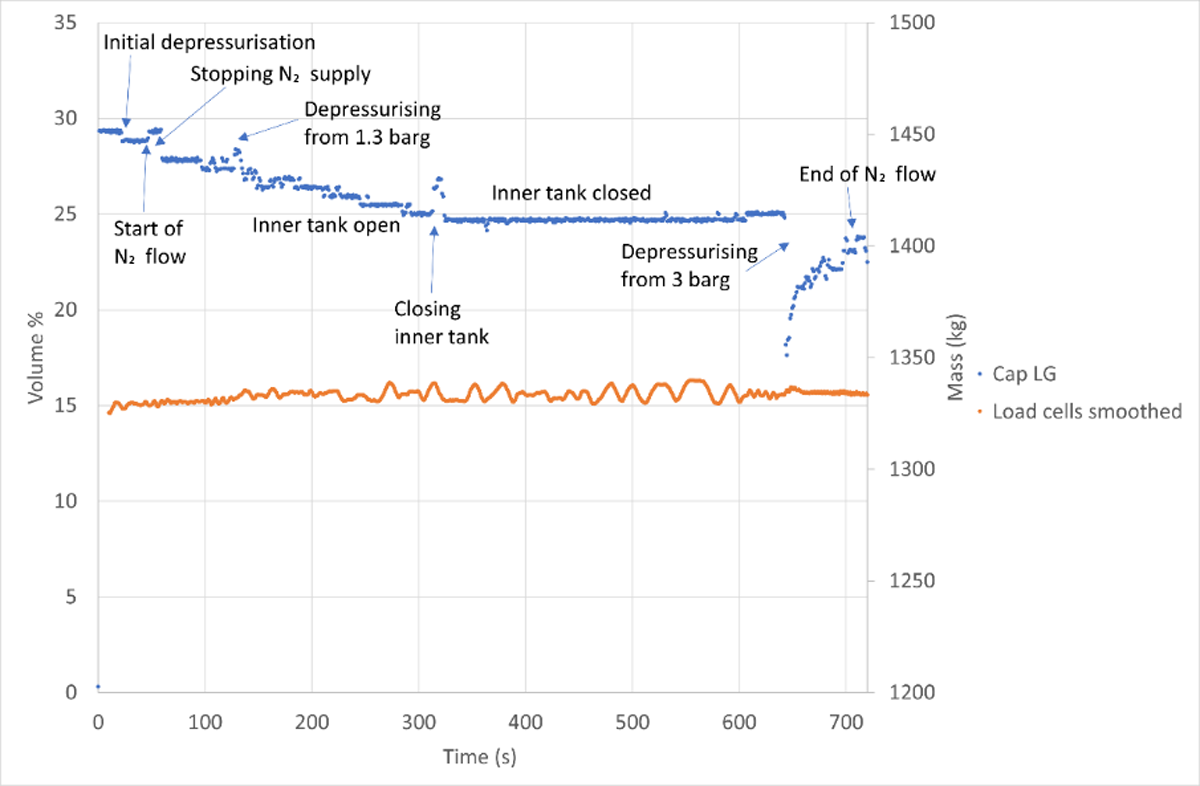
Figure 9
The liquid level from the capacitance level gauge and the mass on the load cells.
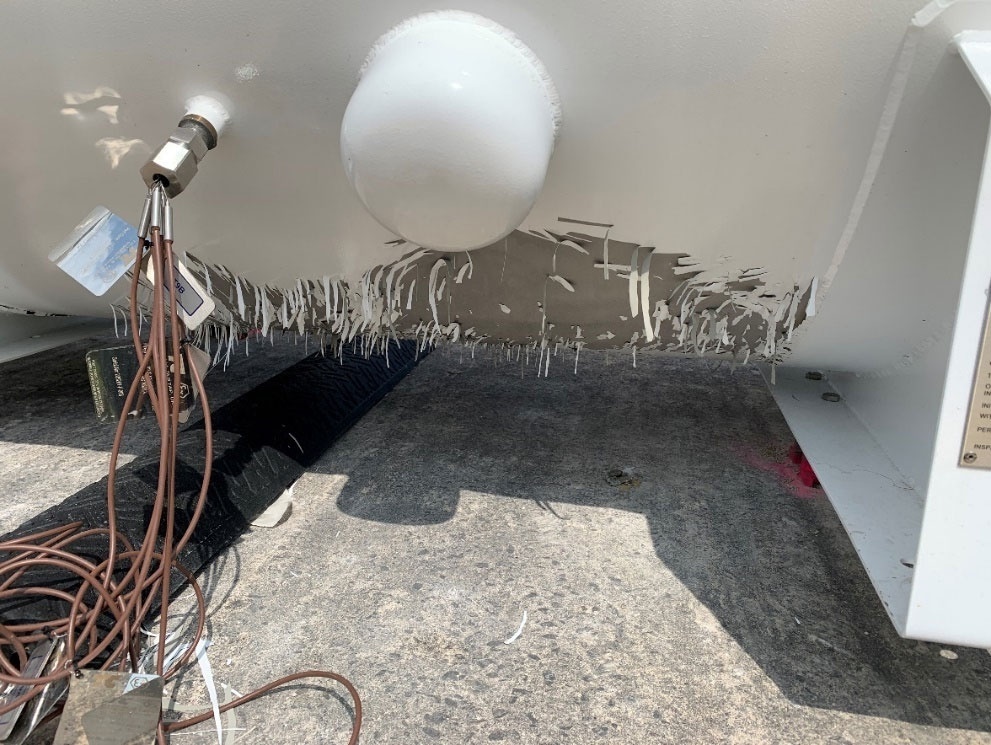
Figure 10
The paint peeling from the underside of the tank.
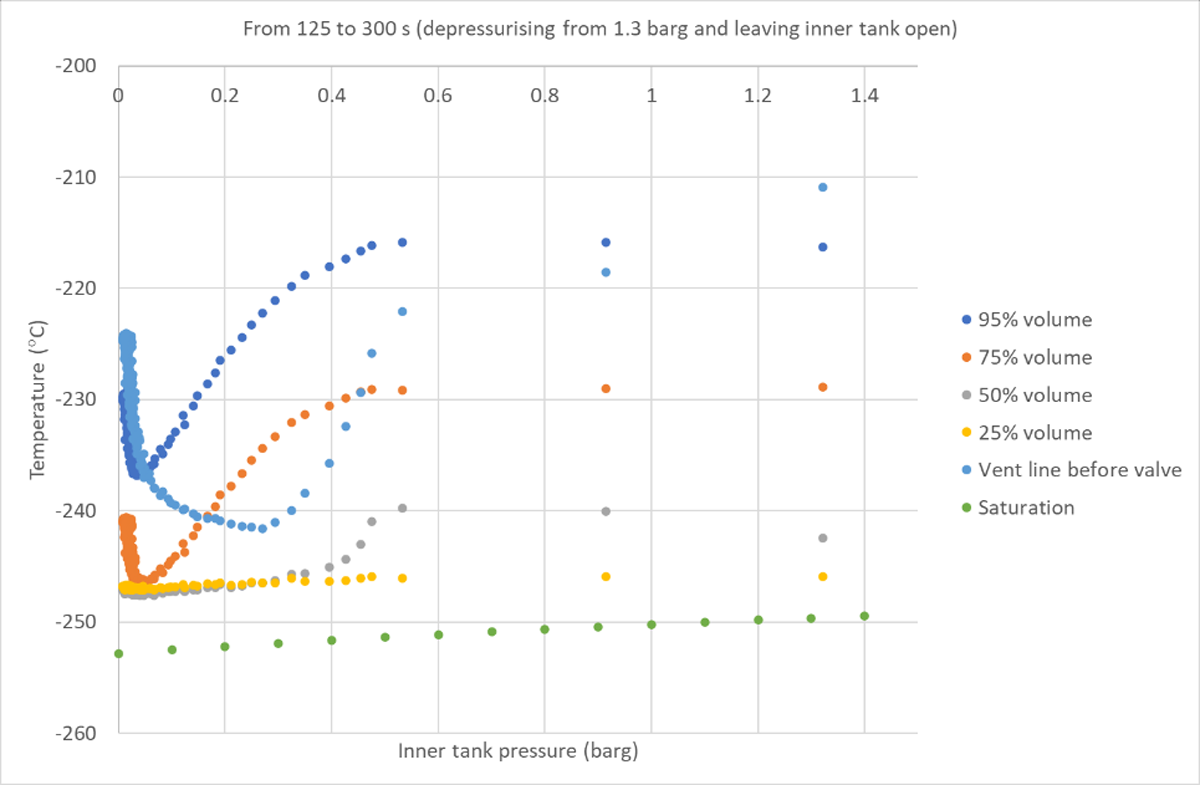
Figure 11
The temperatures and pressures in the inner tank and entrance to the vent line compared to the saturation temperature and pressure during the depressurisation from 1.3 barg and while leaving the vent line open. It should be noted that there is a 6°C offset for the thermocouples at LH2 temperature. Abbreviation: LH2, liquid hydrogen.
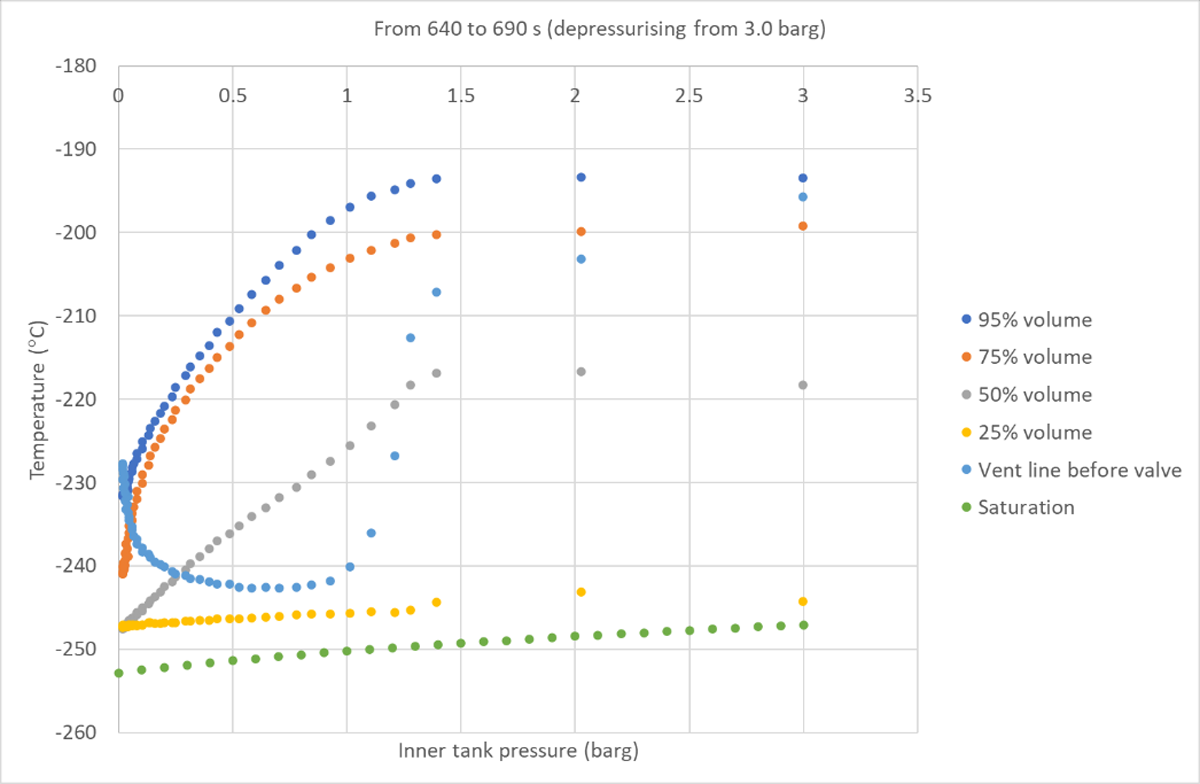
Figure 12
The temperatures and pressures in the inner tank and entrance to the vent line compared to the saturation temperature and pressure during the depressurisation from 3 barg. It should be noted that there is a 6°C offset for the thermocouples at LH2 temperature. Abbreviation: LH2, liquid hydrogen.
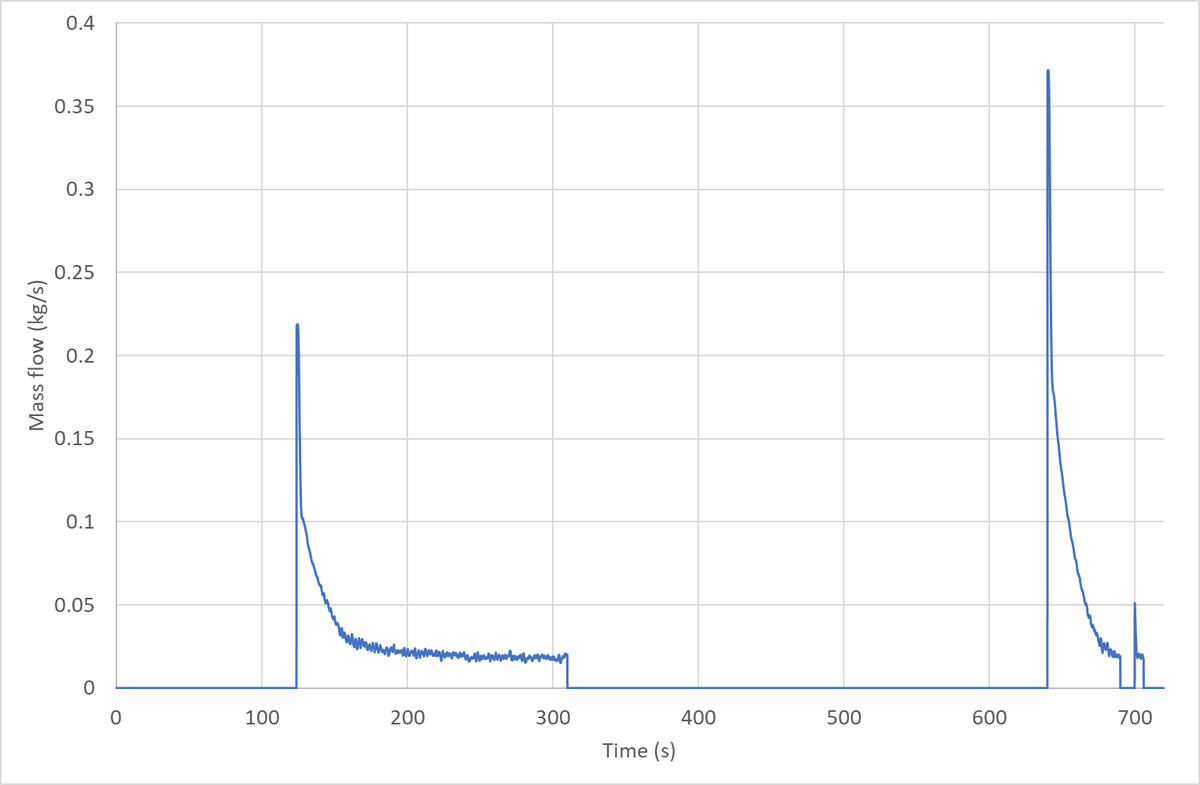
Figure 13
The calculated mass flow out of the experimental vent. This was from a model derived by fitting commissioning data.
Table 2
The minimum heat flows from the gaseous nitrogen flow with the inner tank open if all condenses at the bottom of the outer tank, and the corresponding LH2 boil-off rate.
| Min. heat flow from cooling GN2 to boiling point (kW) | 4.139 |
| Min. heat flow from liquifying LN2 (kW) | 3.611 |
| Min. heat flow from cooling LN2 to freezing point (kW) | 0.510 |
| Min. heat flow from freezing LN2 (kW) | 0.468 |
| Min. heat flow from cooling solid N2 (kW) | 0.772 |
| Total min. heat flow (kW) | 9.501 |
| Min. evaporation rate if all heat is transferred to LH2 (kg/s) | 0.021 |
Table 3
The maximum heat flows from the gaseous nitrogen flow with the inner tank open if all condenses at the bottom of the outer tank, and the corresponding LH2 boil-off rate.
| Max. heat flow from cooling GN2 to boiling point (kW) | 6.396 |
| Max. heat flow from liquifying LN2 (kW) | 5.580 |
| Max. heat flow from cooling LN2 to freezing point (kW) | 0.789 |
| Max. heat flow from freezing LN2 (kW) | 0.723 |
| Max. heat flow from cooling solid N2 (kW) | 1.193 |
| Total max. heat flow (kW) | 14.682 |
| Max. evaporation rate if all heat is transferred to LH2 (kg/s) | 0.033 |
Table 4
The minimum heat flows from the gaseous nitrogen flow with the inner tank open if all heat is transferred to the top of the outer tank, and the corresponding LH2 boil-off rate.
| Min. heat flow from cooling GN2 to temperature of the top of the tank (kW) | 3.770 |
| Min. evaporation rate if all heat is transferred to LH2 (kg/s) | 0.008 |
Table 5
The maximum heat flows from the gaseous nitrogen flow with the inner tank open if all heat is transferred to the top of the outer tank, and the corresponding LH2 boil-off rate.
| Max. heat flow from cooling GN2 to the temperature of the top of the tank (kW) | 5.826 |
| Max. evaporation rate if all heat is transferred to LH2 (kg/s) | 0.013 |
Table 6
The heat flows from the gaseous nitrogen flow with the inner tank closed if all condenses at the bottom of the outer tank.
| Heat flow from cooling GN2 to boiling point (kW) | 1.901 |
| Heat flow from liquifying LN2 (kW) | 1.658 |
| Heat flow from cooling LN2 to freezing point (kW) | 0.234 |
| Heat flow from freezing LN2 (kW) | 0.214 |
| Heat flow from cooling solid N2 (kW) | 0.355 |
| Total heat flow (kW) | 4.361 |
Table 7
The heat flows from the gaseous nitrogen flow with the inner tank closed if all heat is transferred to the top of the outer tank.
| Heat flow from cooling GN2 to the temperature of the top of the tank (kW) | 1.731 |
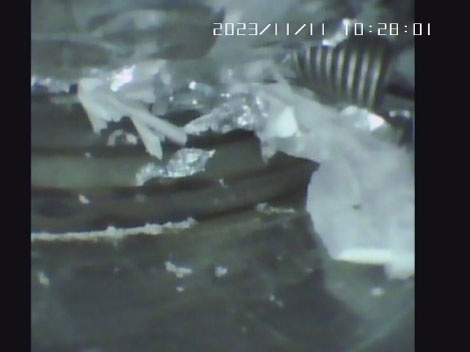
Figure 14
Torn MLI accumulated around a coil in the outer tank. Abbreviation: MLI, multi-layer insulation.
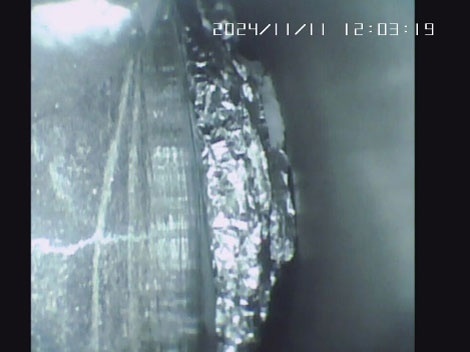
Figure 15
Layer(s) of MLI peeled back along the cylindrical section of the tank. Abbreviation: MLI, multi-layer insulation.
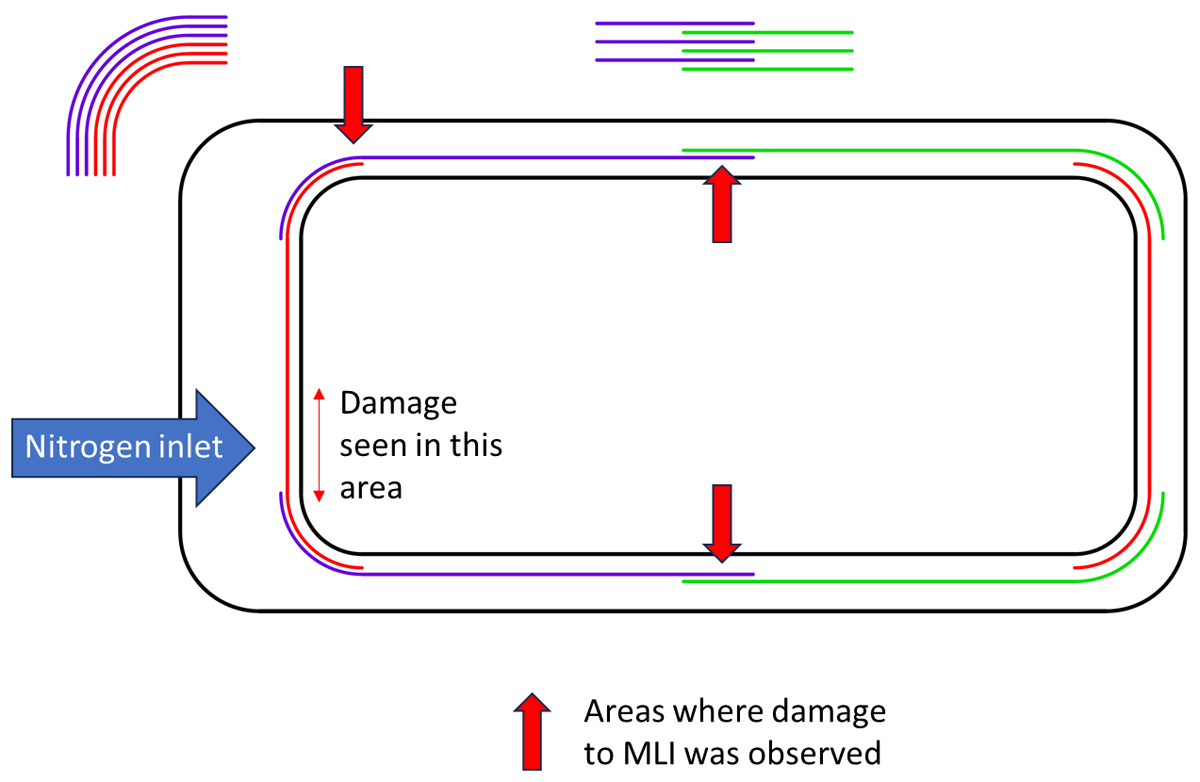
Figure 16
A diagram showing where damage to the MLI was observed; the different colours are different MLI blankets. Abbreviation: MLI, multi-layer insulation.