
Introduction
Liquid hydrogen (LH2) is being considered as a fuel for transportation that is carbon-free at the point of usage due to its high density compared to gaseous hydrogen (H2). LH2 tanks require a high degree of insulation to prevent heat ingress due to the low boiling point of hydrogen (~20 K), leading to pressure rise and wastage. This is usually achieved through the use of a double-walled tank with multi-layer insulation (MLI) in the interstitial space, combined with a high vacuum. Figure 1 (taken from Goff et al., 2024) shows how MLI reduces radiation transfer, and the high vacuum reduces convective transfer. This paper describes work conducted as part of the Zero Emissions for Sustainable Transport 1 project (ZEST1), where the vacuum was intentionally failed.
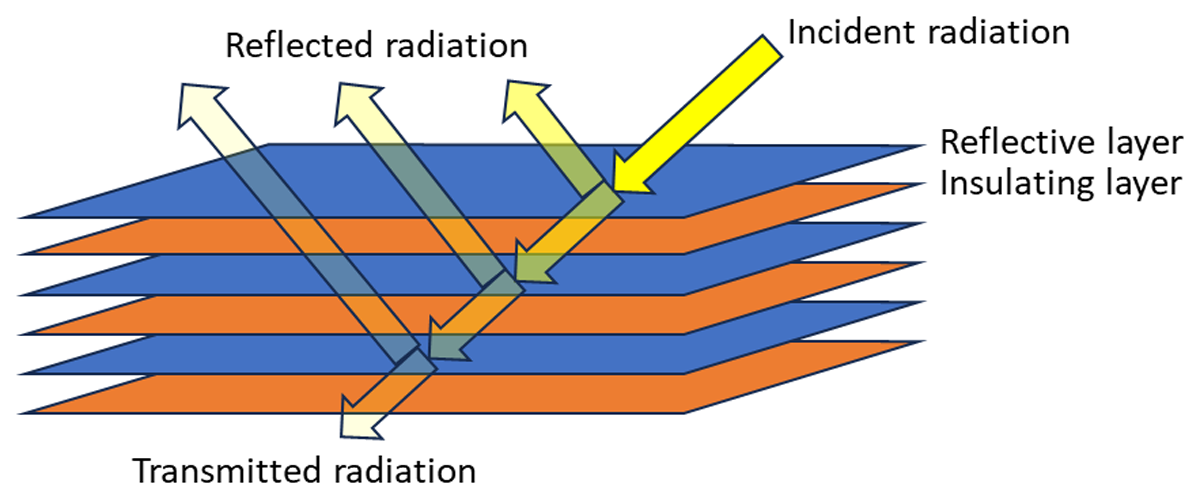
Figure 1
A simplified diagram showing how MLI prevents transfer of radiation across the vacuum space. Secondary radiation reflections within the MLI are not shown for ease of understanding (taken from Goff, 2024). Abbreviation: MLI, multi-layer insulation.
The ISO 21013 series (of which there are four parts) gives guidance on pressure relief devices for cryogenic vessels. In particular, BS EN ISO 21013-3:2016 covers sizing the pressure relief devices for the inner tank, including the scenario where the vacuum is lost on the outer tank. Also, BS EN 17527:2021 on helium cryostats has guidance on sizing pressure relief for the inner tank.
CGA S-1.3:2020 and BS EN13458-2:2002 have a requirement for the relief capacity of the outer tank to be 0.34 mm2 per litre of fluid of the inner tank and for it to limit the pressure to 0.5 barg.
As far as the authors are aware, this paper details the first large-scale experiments on an LH2 tank with a realistic scenario for the vacuum loss. Previous experiments have looked at liquid helium (Xie, Li and Wang, 2012) or liquid nitrogen (Weber et al., 2017). Experiments conducted by NASA on LH2 investigated different scenarios due to differences in the design and use of their tanks compared to a typical fixed storage arrangement. Differences included the use of foam in addition to MLI, with no outer tank, as the vacuum was provided by outer space in Martin and Hastings (2001), or the use of a spherical tank, with heating directly applied into the vacuum space, rather than heating from vacuum loss (Aydelott and Spuckler, 1969). Tani et al. (2019) performed experiments on a 30 m3 LH2 tank to study depressurisation-induced boiling. The SH2IFT programme of work performed experiments resulting in boiling liquid expanding vapour explosions (BLEVEs) in LH2 tanks from fire impingement (van Wingerden et al., 2022). The results of the SH2IFT BLEVE experiments were also compared against the results of other BLEVE experiments that had much smaller inventories (between 1.4 and 3.9 kg of LH2, compared with 27 kg in SH2IFT) (Ustolin et al., 2023).
A motivation for carrying out experimental studies of this type is to provide data for use in the development and evaluation of predictive models that are used in the design and analysis of LH2 tanks. Models are also embedded in standards, such as the ISO 21013 series, introduced previously. Various assumptions are made in these models; for instance, BS EN ISO 21013-3:2016 assumes that the vapour in the vent line is at saturation conditions.
As part of this project, a review of models was carried out to help understand the origins and assumptions behind the methods set out in the relevant standards and also to help inform the design of the experimental test rig and instrumentation. These models range in complexity from homogeneous equilibrium models (e.g. Lin, Van Dresar and Hasan, 1991; Varghese and Zhang, 1992) to multi-layer models (e.g. Bolshinskiy et al., 2017; Osipov et al., 2011; Tani et al., 2019) to computational fluid dynamics (e.g. Kassemi and Kartuzova, 2016). The different modelling approaches have advantages and disadvantages in terms of their predictive capabilities and data requirements. However, many of the standards are based on these models because they can be readily implemented and provide a conservative estimate of mass flow during venting, as it is assumed that all the heat input results in phase change.
Types of Vacuum Failure Considered
Two types of vacuum loss were considered:
Air ingress from the exterior, for instance, from the failure of a vacuum plug
H2 (liquid or cold gas) leaking from the interior via a crack in a weld
To decide on testing methodologies for vacuum failure, it is necessary to consider how the pressure would vary in an LH2 tank during a vacuum failure. This is shown schematically in Figure 2. This analysis primarily considers air/nitrogen from the atmosphere (or a gas cylinder for the experiments) as the fluid that breaks the vacuum.
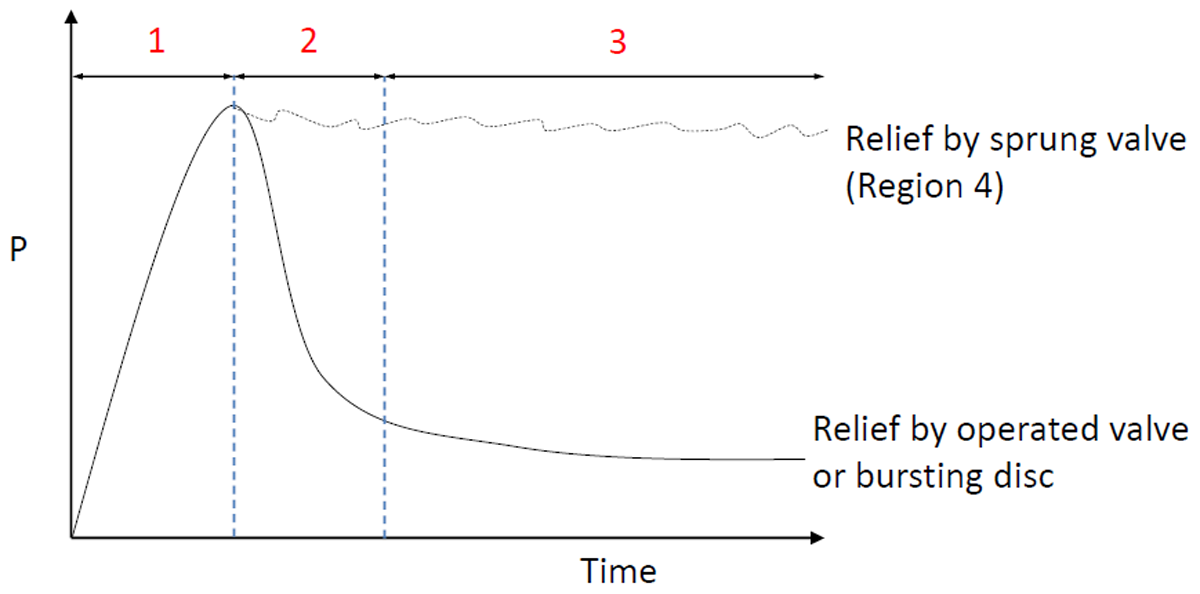
Figure 2
A schematic to show how the vessel pressure (P) would vary in an LH2 vessel during vacuum failure. Abbreviation: LH2, liquid hydrogen.
Region 1 corresponds to a pressurisation of the tank with the safety device closed after failure of the vacuum due to heat ingress. In Region 2, after the operation of a bursting disc, there would be a rapid depressurisation before a steady-state boil-off in Region 3. The models used by some standards assume that when the vacuum fails, there is no pressurisation and it is immediately relieved; that is, that Regions 1 and 2 are skipped and only Region 3 occurs. This would mean that the safety device is open to the atmosphere when the vacuum failure occurs. This is not a realistic scenario; future work is planned to compare this scenario with the one that occurs in reality.
It was not intended to study Region 4 (which is an alternative path through Regions 2 and 3), which would represent the scenario of a safety relief valve opening and closing to maintain the pressure in the tank. The flow would stop and start with the motion of the safety valve and would not be representative of the majority of models that were evaluated as part of this work. This was studied in Weber (2017).
LH2 Tank Design for the Experiments
Figure 3 shows the P&ID created for the tank, and Figure 4 shows the design drawing of the tank. The measurements of the tank are shown in Figure 5. The capacity of the inner tank was 1.5 m3. Both inner and outer tanks had ASME flanged and dished ends, with the surface areas of the inner and outer tanks being 6.69 and 9.93 m2, respectively. Both inner and outer tanks were specified for a maximum operating pressure of 10 barg. The inner tank was also designed to take a reverse pressure of 10 barg. Normally, the outer tank would only be specified for 1 barg, but a higher pressure rating was needed in case it were to be pressurised during the experiments.
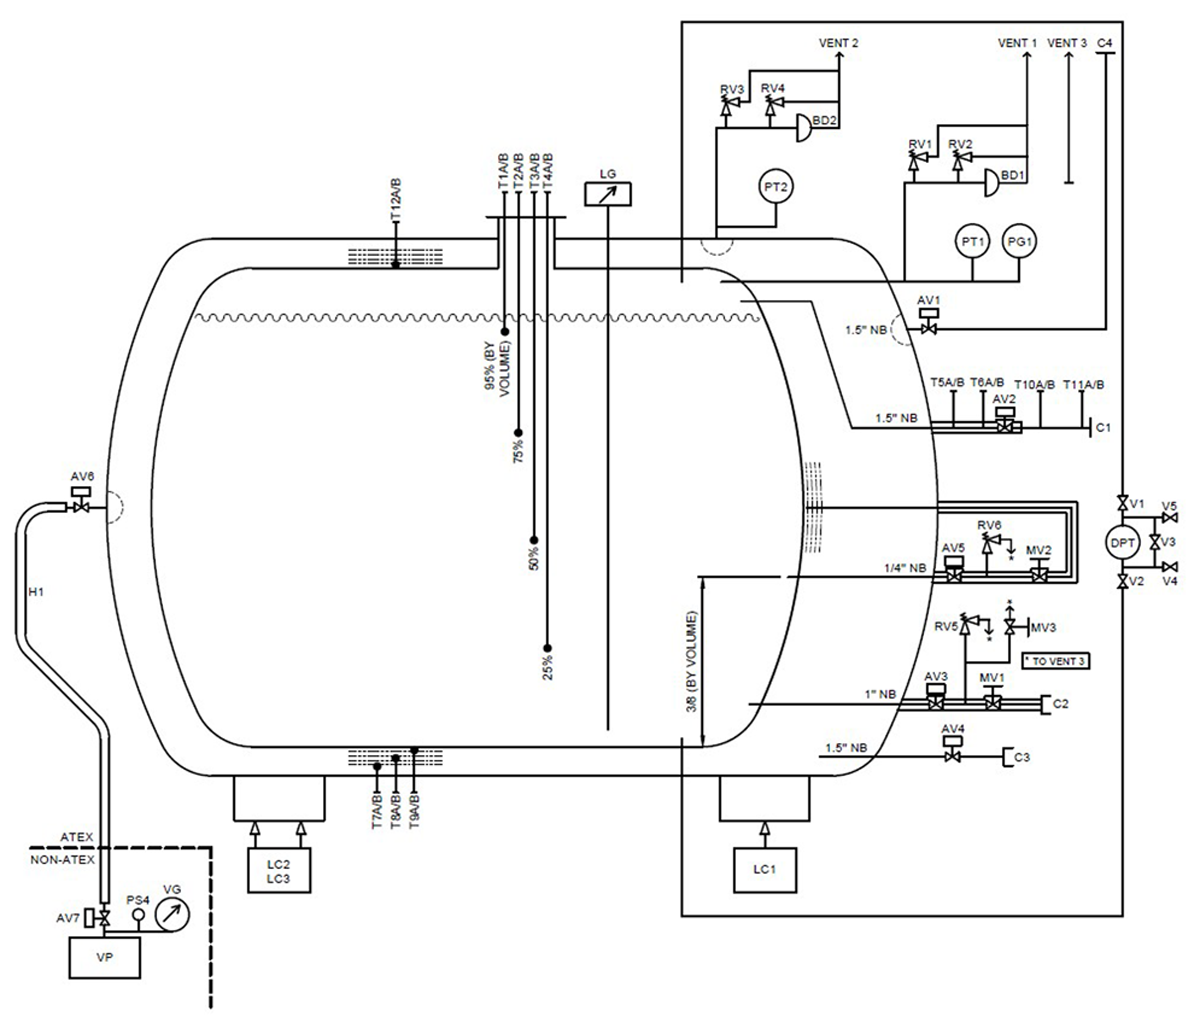
Figure 3
The final version of the P&ID for the tank. Pipework with three parallel lines are the super-insulated vacuum lines (SIVL).
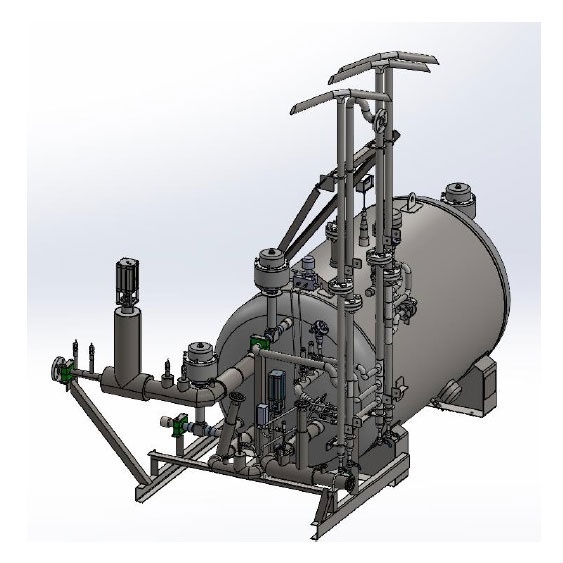
Figure 4
An overall view of the tank design.
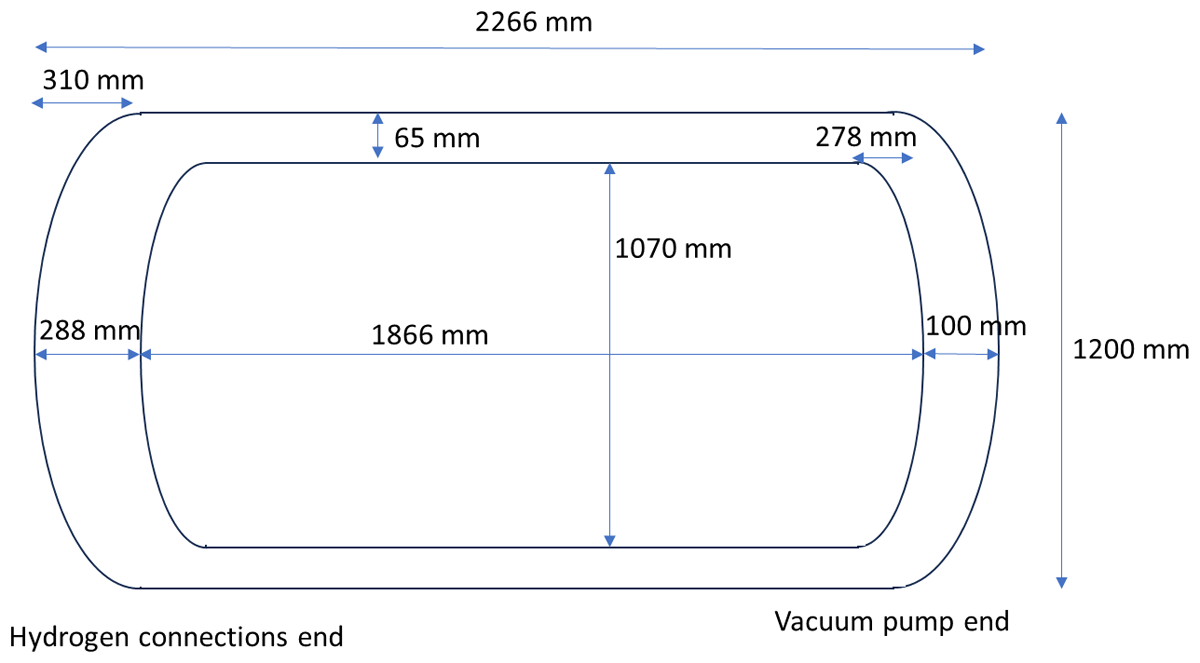
Figure 5
The dimensions of the inner and outer tanks.
The cylindrical section of the inner tank was 6 mm thick and had three equally spaced 50 × 50 × 5 mm angle stiffening rings. The dished ends were pressed from a 6 mm plate. As a comparison, the cylinder only needs to be 4 mm thick for 10 barg internal pressure; the extra thickness and stiffening rings are to resist the reverse pressure. The cylindrical section of the outer tank was 5 mm thick due to the 10 barg maximum operating pressure; however, a standard tank built for 1 barg would only be 4 mm thick. The dished ends of the inner and outer tanks were 6 mm thick.
The inner tank and outer tanks were designed such that they had vent lines which could be controlled remotely during the experiments, which would be specified to match the safety relief requirements of a cryogenic tank in service with LH2. The safety relief requirements on the outer tank of cryogenic tanks are generally met through the vacuum plug, which doubles up to both sealing after creating the vacuum and acting as a bursting disc in the event of pressurisation.
BS EN ISO 21013-3:2016 was used to calculate the vent area required for the inner tank when the vacuum is lost on the outer tank. The vent line needed to be a minimum of 1″ (25.4 mm); however, it was decided to specify a 1.5″ (38.1 mm) diameter vent line for a margin of safety (this was the design intention, as all pipes in this tank were constructed of Schedule 10S pipe, which had a larger internal diameter). Specifying a 1.5″ vent line allowed for factors such as restrictions in the valve used on the vent line and minimised pressure drops in the line. BS EN ISO 21013-3:2016 has criteria for maximum allowable pressure drops of 3% upstream of the valve and 10% downstream. At the time of specifying the vent size, the geometries were not known, so a larger-bore pipe made these requirements easier to comply with.
CGA S-1.3:2020 and BS EN 13458-2:2002 have a requirement for the relief capacity of the outer tank to be 0.34 mm2 per litre of fluid of the inner tank and for it to limit the pressure to 0.5 barg. This gives a required vent internal diameter of 24.6 mm, so a vent line of 1.5″ (38.1 mm) was specified to allow for a discharge coefficient of less than 1.
This nitrogen (N2) vacuum break line was sized to represent a large failure to the outer tank, and it was decided that this should be based on a catastrophic failure of the vacuum port, as such the N2 line was specified to be 1.5″ (see paragraph above).
In a real-life scenario, air would be the gas breaking the vacuum, but this was substituted with N2 instead. This would avoid any potential build-up of solid or liquid oxygen in the vacuum space, as it was intended that H2 would be added to the vacuum space in one test. Mixtures with enriched solid oxygen and LH2 can lead to high-order explosions (Atkinson, 2021; Hall, Hooker and Willoughby, 2014). The thermodynamic properties of N2 and air are similar, and it was not expected that this would have a major influence on the phenomena observed.
The maximum flow of N2 in the event of a lost vacuum plug was calculated to be 8200 L/min assuming a choked flow (BS EN IEC 60079-10-1:2021) with a discharge coefficient of 0.6 for a sharp-edge nozzle. In this work, L/min refers to normal litres per minute. A Bronkhorst IN-FLOW mass controller with a capacity of 8000 L/min of N2 was chosen to control and measure the supply of N2 into the vacuum space. The maximum flow is only important for how fast the outer tank fills to atmospheric pressure, provided it is large enough to match the condensation rate of the N2 at steady state.
The H2 transfer line was sized to replicate a small representative leak from the inner tank to the outer tank. The scenario this represents would be a crack to a weld. A ¼″ line was chosen for this as the most suitable of the standard pipe sizes; the design intention was for the internal area of this pipe to approximate a crack 30 mm long and 1 mm wide. The Schedule 10S pipe chosen in the detailed design had a larger internal area than this, but the cryogenic valve will place a restriction on this line.
Results
The vacuum failed by setting the Bronkhorst mass flow controller to 4000 L/min, with the tank 25% full (27 kg of LH2). This was intended as an initial test under less onerous conditions before doing full-bore failures in later tests. A timeline of key events is given in Table 1. The data measured is shown in Figures 6, 7, 8, 9.
Table 1
A timeline of events during the experiment.
| TIME (S) | DESCRIPTION OF EVENT |
|---|---|
| 20 | Depressurised inner tank from ~0.1 barg that came from the filling and self-pressurisation before start of experiment, vent left closed afterwards |
| 40 | Start of N2 flow through the Bronkhorst flow controller |
| 60 | Flow of N2 stopped |
| 65 | Flow of N2 restarted, and from this point onwards the Bronkhorst was adjusted so the rate of gas supplied matched the rate of condensation |
| 125 | Experimental vent (valve AV2) opened, and inner tank depressurised from 1.3 barg |
| 125–310 | Experimental vent left open to measure steady-state boil-off to compare to the standards |
| 200–250 | Pressure in outer tank slowly decreasing, giving a minimum value for the N2 flow into the outer tank to replace the N2 that has condensed out of the gas phase |
| 250–310 | Pressure in outer tank slowly increasing, giving a maximum value for the N2 into the outer tank flow to replace the N2 that has condensed out of the gas phase |
| 310–640 | Experimental vent closed and inner tank allowed to pressurise to 3 barg |
| 640 | Depressurised inner tank from 3 barg |
| 710 | N2 flow stopped |
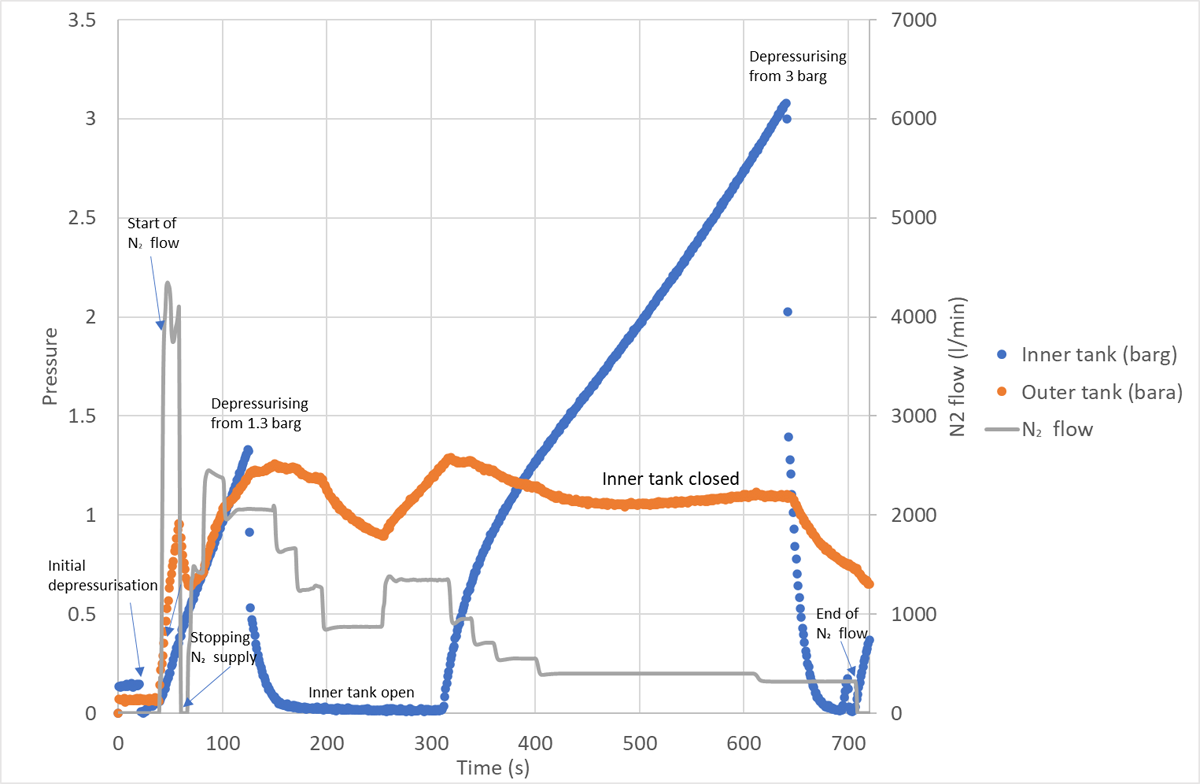
Figure 6
The pressure measured in the inner and outer tanks. The nitrogen flow into the vacuum space is also shown.
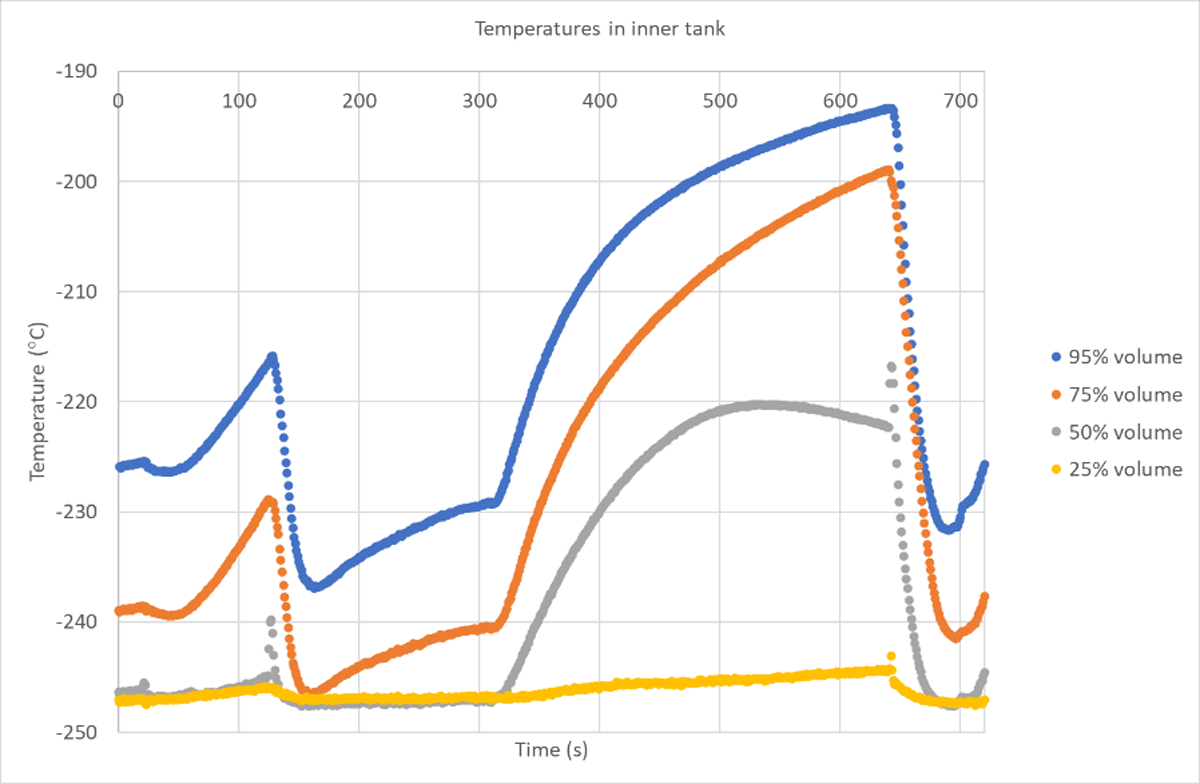
Figure 7
The temperatures measured in the inner tank.
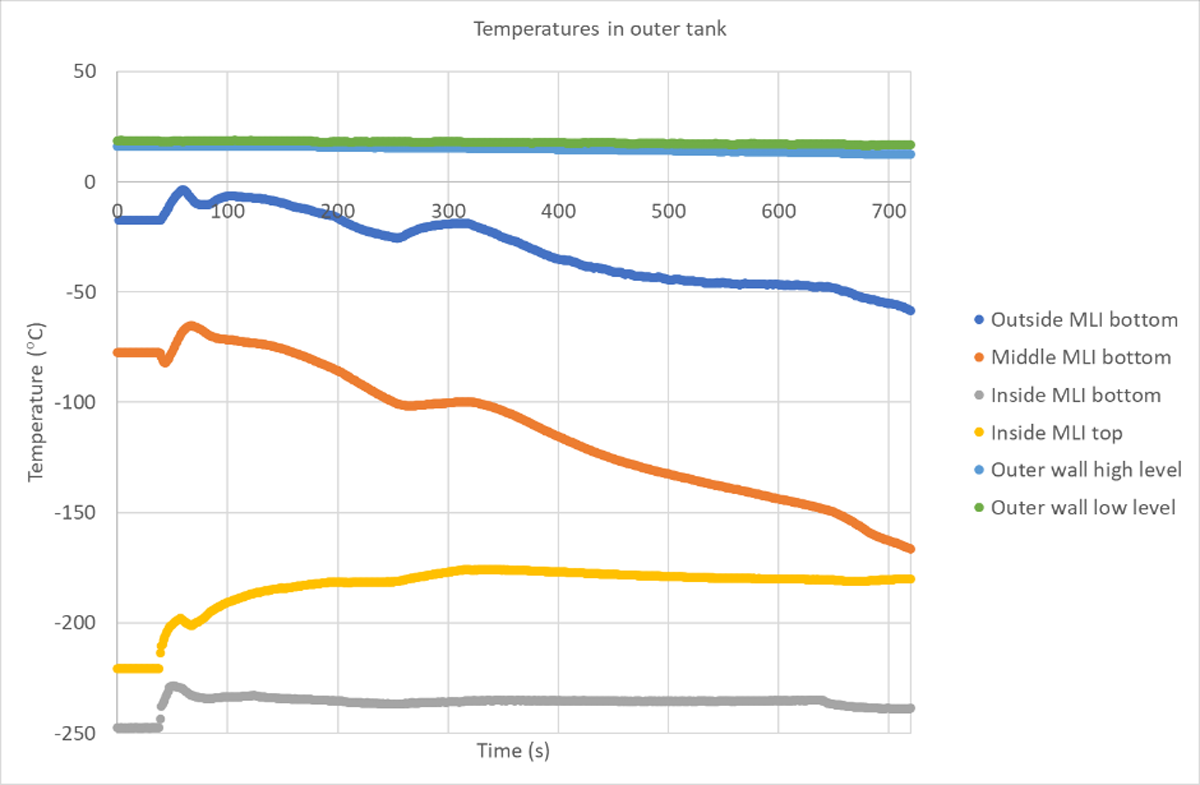
Figure 8
The temperatures measured in the outer tank.
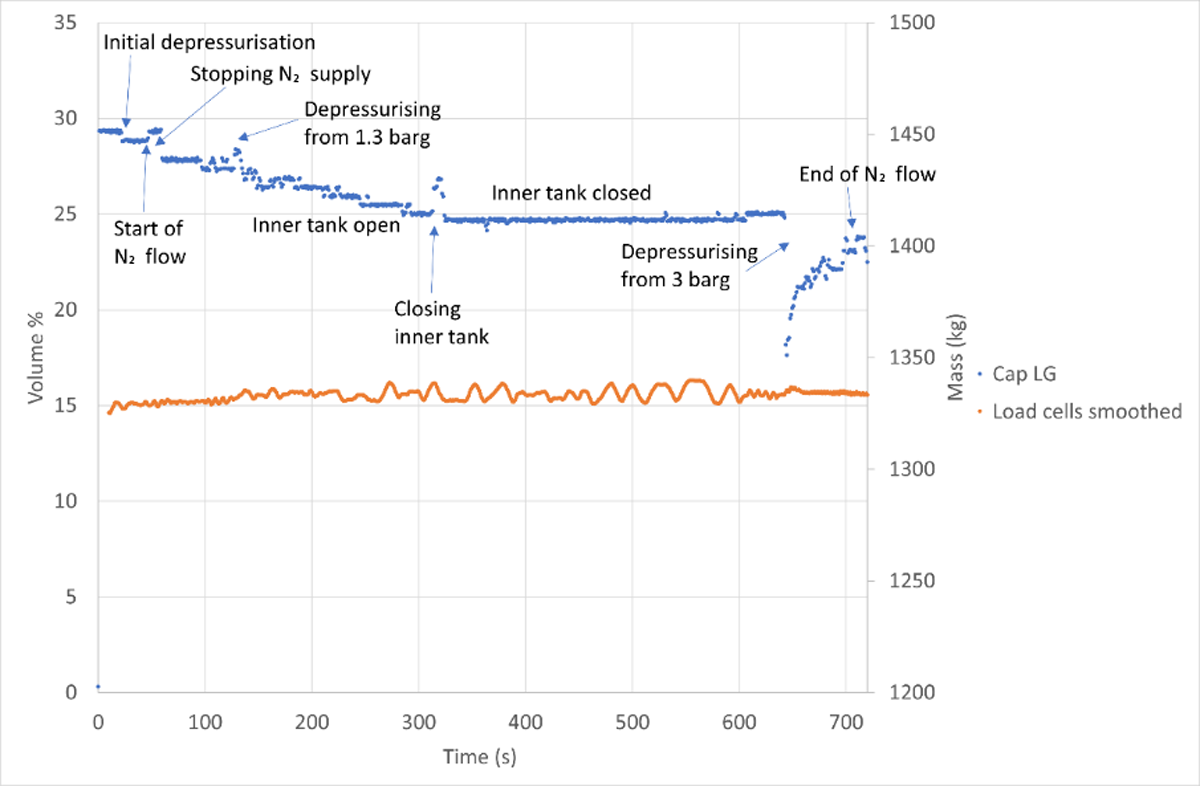
Figure 9
The liquid level from the capacitance level gauge and the mass on the load cells.
After this test, it was not possible to restore the vacuum to perform the further planned tests while there was an LH2 tanker available. The gauge on the vacuum pump was giving significantly different readings to that on the outer tank, and it was suspected there was a blockage. The vacuum hose was removed from the tank, and pieces of insulation could be seen in the valve. As there was loose insulation material in the outer tank, it was decided on the grounds of safety that no more tests were possible, as these loose fragments could block the pressure safety valves.
It was found after the test that the paint had peeled off the underside at the H2 connection end and along the cylindrical section. This can be seen in Figure 10. A camera recording a video of the experiments lasted for three hours, and no indication of damage to the paint was seen in it. A thermal imaging camera recorded data for five minutes after the breaking of the vacuum; no cooling was detected to the underside of the tank in that time. Thermocouples on the outer tank at high and low levels did not detect any deviation from ambient temperature while logging (around 30 minutes).
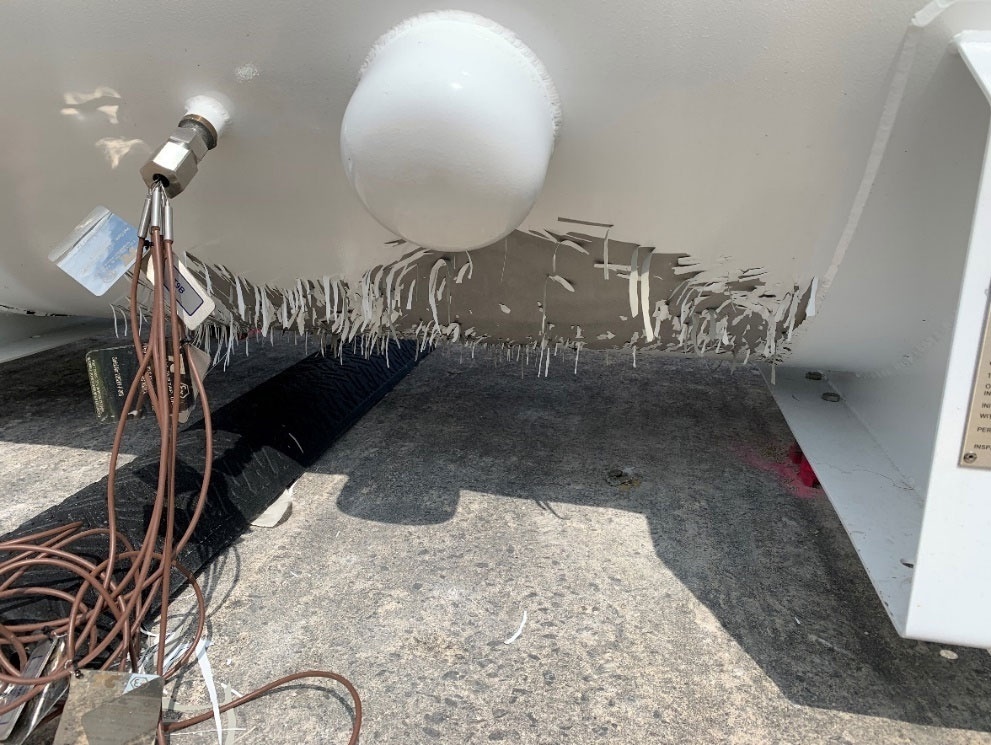
Figure 10
The paint peeling from the underside of the tank.
The likely explanation is that cryogenic liquids pooled at the bottom of the tank while the tank was warming up, with the solid N2 that condensed on the inner tank wall turning to liquid. The datasheet for the paint used does not specify a minimum service temperature (only a maximum is specified) but gives a minimum curing temperature of –10°C. It can be assumed that the temperature that caused the damage was lower than the minimum curing temperature. The paint in this case was aesthetic, as the outer tank was made of stainless steel, but it could be a problem for a larger tank where the outer tank may be made of mild steel. This paint loss is indicative that cold temperatures could be occurring at the base of the tank following vacuum failure.
Discussion
N2 gas flow
When N2 gas was first released into the outer tank at 4000 L/min (which is half the maximum flow), the time taken for the pressure in the outer tank to increase from 0 to 1 bara was 20 s (see Figure 6). This time was similar to that of the oscillations observed in the mass flow rate in an LH2 vacuum hose that suffered a vacuum failure (Goff et al., 2024). It was suspected that those oscillations were related to repeated cycles of air filling the hose and then condensing. The reason for the gas flow rate dropping and recovering at 50 s is unknown.
At around 60 s, the N2 gas flow was stopped as atmospheric pressure was reached in the outer tank. This caused the pressure in the outer tank to drop dramatically, likely due to condensation of gaseous N2 and further cooling of the gas. The flow of N2 was restarted, and the pressure quickly recovered. This was an artefact of the way the experiment was conducted, and subsequent changes in the N2 flow were regulated with smoother variable adjustments to the flow. The Bronkhorst flow controller used for the measurements required manual control of the flow of N2, rather than it being a meter which merely measured the flow of gas into the vacuum space; this system allowed nitrogen from a bottle to be used instead of air and for the flow to be regulated to less than the maximum in this test.
Once the outer tank reached atmospheric pressure, the gas flow rate required to maintain pressure was much reduced. This gas flow rate would be equal to the rate of condensation of nitrogen. The change of volume of a gas from cooling is considered negligible compared to the change in volume from condensation. During the experiment, the controlled gas flow did not exactly match the condensation rate in the outer tank (see Figure 6); however, it is possible to put bounds on it:
Between 200 and 250 s, the pressure in the outer tank is slowly decreasing, so the flow rate of nitrogen is just below the condensation rate, putting a lower bound on the N2 flow at steady state.
Between 250 and 310 s, the pressure in the outer tank is slowly increasing, so the flow rate of nitrogen is just above the condensation rate, putting an upper bound on the N2 flow at steady state.
While the N2 gas flow used for this experiment was only half the maximum flow rate, that would only affect the initial rate of pressurisation of the tank between 40 and 60 s and would not affect the steady-state gas flow with the outer tank open between 200 and 310 s. From these gas flows, it is possible to estimate the heat transfer from the nitrogen and the expected boil-off rate if all heat is transferred to the liquid (see section on Mass Flows). This is a reasonable assumption as the bottom of the tank is cold enough to freeze N2 (–234°C), whereas the top was not cold enough to condense N2 (–177°C). It should be noted that the top of the tank is only just above the boiling point of oxygen (–183°C), and that under different conditions, such as tank fill level, it could be cold enough to condense oxygen.
The pressure in the outer tank fell during depressurisation from 3 barg; this is likely to have been caused by the cooling that occurs from the inner tank taking heat from the outer tank, and this was not matched by heat from the nitrogen gas flow, as the flow through the Bronkhorst was not increased. In a system where the gas flowing into the outer tank was not metered, the flow of gas would have increased to maintain atmospheric pressure.
Temperatures
From Figure 7 the LH2 temperature is –247°C (26 K) at ambient pressure after depressurising the tank (assuming the liquid is at its saturation temperature after depressurising), whereas the NIST database (2023) gives the boiling point of LH2 at ambient pressure as –253°C (20 K), so there is a 6°C error in the temperature measurement. This is a good agreement given the challenges of measuring temperature in this range and is less than the error of 8°C quoted for the thermocouple in the release station that was calibrated with liquid helium.
During depressurisations of the inner tank, sharp temperature spikes were observed on some thermocouples in Figure 7. This is thought to be due to rapid turbulent mixing of the stratified vapour, where warmer vapour at the top of the tank mixed with cooler vapour lower down. This can be seen for the thermocouple at 50% volume during the depressurisations from 1.3 and 3.0 barg. It can also be seen on the thermocouple at 25% volume during the depressurisation from 3 barg; it is likely that this thermocouple was near the surface of the liquid (just in or just out). A small temperature rise of 3°C in the liquid was observed during the pressurisation to 3 barg and a 1°C rise during the pressurisation to 1.3 barg.
During the pressurisation to 3 barg, the temperatures at 95% inner tank volume and 75% inner tank volume continued to rise until the depressurisation. However, the temperature at 50% volume initially rose and then fell. It is thought that there was a change in the stratification of the vapour to cause this behaviour. Possible explanations are that the depth of the colder layer above the surface of the liquid increased by evaporation or that this layer was pushed further up the tank by expansion of the liquid.
During depressurisation, temperatures measured in the experimental vent line before and after the valve were within error of each other, so the valve was not a significant source of heat transfer. However, a temperature increase was seen along the vent line, as expected due to thermal transfer from the metal walls.
The temperature measured in the vent line before the valve was used as representative of the temperature of the fluid as it left the tank and entered the vent line. This was compared against those measured in the inner tank and the saturation curve (NIST, 2023) in conjunction with the pressure measured. The pressure measured in the inner tank was assumed to apply at the location of the thermocouple, which was on the exit of the tank before the actuated valve. This is shown in Figures 11 and 12.
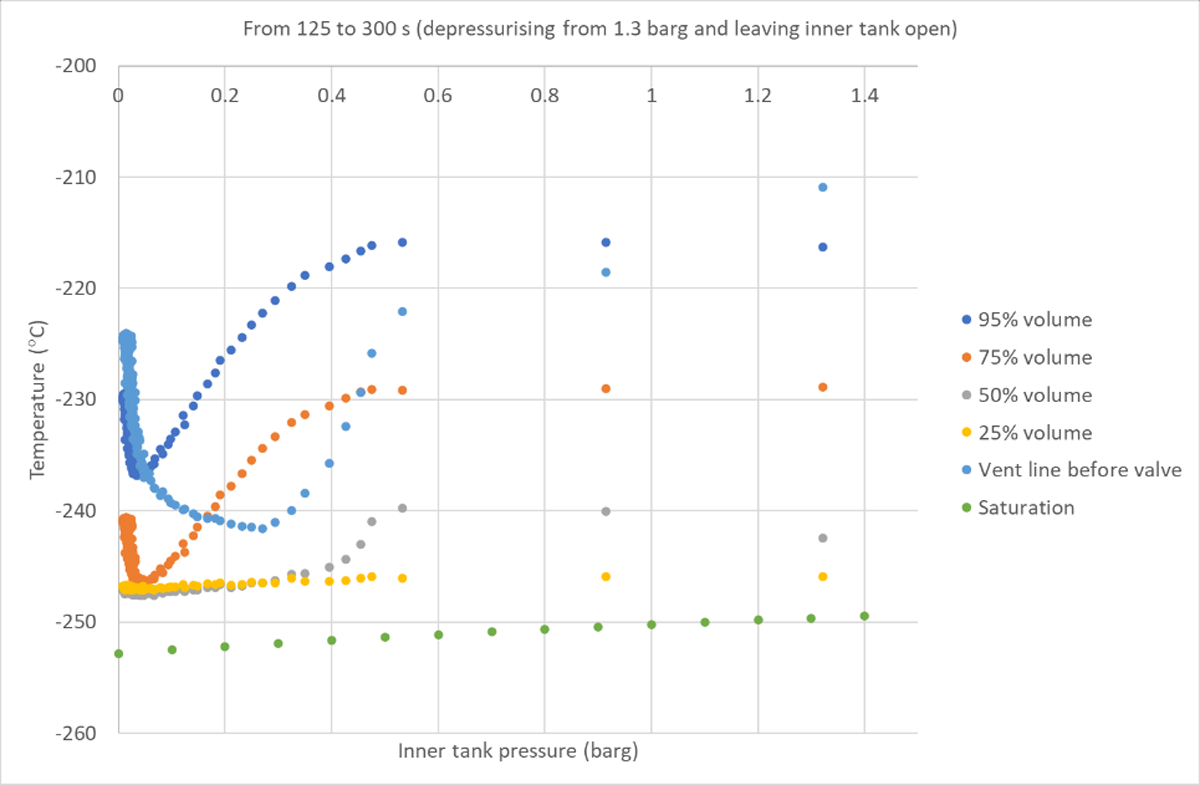
Figure 11
The temperatures and pressures in the inner tank and entrance to the vent line compared to the saturation temperature and pressure during the depressurisation from 1.3 barg and while leaving the vent line open. It should be noted that there is a 6°C offset for the thermocouples at LH2 temperature. Abbreviation: LH2, liquid hydrogen.
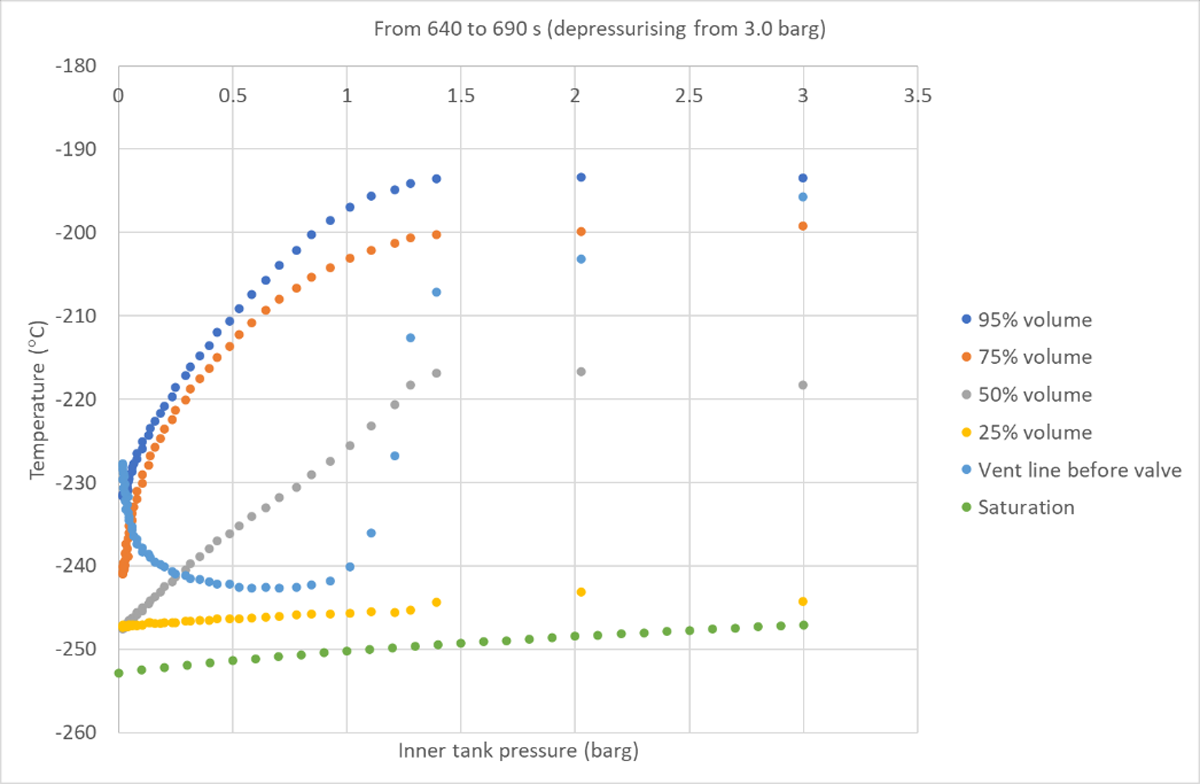
Figure 12
The temperatures and pressures in the inner tank and entrance to the vent line compared to the saturation temperature and pressure during the depressurisation from 3 barg. It should be noted that there is a 6°C offset for the thermocouples at LH2 temperature. Abbreviation: LH2, liquid hydrogen.
During the depressurisation from 3 barg, the temperature in the vent line drops rapidly with decreasing pressure and gets close to that of the liquid (at 25% volume) and the saturation curve (when the 6°C offset in temperature is considered). When depressurising from only 1.3 barg, the temperature and pressure in the vent line are further from the saturation value. This suggests that if depressurisation is fast enough and from a high enough pressure, saturation conditions could be met in the vent line. This could mean that vapour condenses out in the vent line for a short period of time during expansion and depressurisation as the temperature in the vent line rises after the initial depressurisation.
It should be noted that the pipe that leaves the inner tank for the vent line starts at the top and dips down to a lower level to exit the domed end through the middle section (a strength requirement of the design), so it passes through a cooler region, as there is temperature stratification in the inner tank. The depressurisation is quick enough that initially very little heat will be taken in from the pipework and allows the cooling to take place from the expansion of the gas (adiabatic). Over time the temperature of the vapour in the vent line and the top of the tank increases due to further heat transfer from the outer tank. As the temperature in the vent line recovers faster than at the top of the tank, this process is quicker through the pipe that passes through the outer tank, particularly when the flow rate drops due to decreasing driving pressure from the inner tank.
The temperature beneath the MLI (which will be the same as the temperature of the inner tank wall) rose quickly when nitrogen gas entered the outer tank (see Figure 8). After the initial rise, the temperature of the inner layer of insulation at the bottom of the tank stayed constant, but at the top it continued to rise for longer, then stayed constant. The temperature of the middle and outer layers of the MLI at the bottom of the tank continued to fall for the duration of the experiment.
After the experiment, paint damage was observed on the bottom of the tank, which was likely to be caused by pooling of cryogens. This did not occur in the first five minutes of the test, as seen by the thermal imaging. Thermocouples on the outside of the tank remained at ambient and changed very little during the 2000 s of data logging; however, these were at the vacuum connection end of the tank, which did not show any damage to the paintwork.
Liquid level
When the inner tank was open to atmosphere, the reading on the capacitance level gauge decreased steadily in an approximately linear fashion. This can be used to estimate the boil-off rate of LH2 (see section on Mass Flows).
During the depressurisation from 3 barg, the reading from the capacitance level gauge can be seen to drop rapidly and then recover quickly to a level below the initial value. The level gauge consists of a probe inside a cylinder, and the capacitance is measured between them. The cylinder is open at the bottom and has a breather hole at the top. It is thought that the level gauge was a nucleation point for the rapid boiling and that vapour/bubbles could have built up inside the tube and given an artificially low reading.
In contrast, a small temporary increase was also seen at the depressurisation from 1.3 barg. A similar small temporary increase was also seen when the inner tank was closed. The first of these is consistent with level swell during depressurisation, but the second is unexplained.
Overall, it is not possible to examine if level swell occurred during the rapid depressurisations when the actuated valve (which simulated a safety device) opened due to the level probe potentially acting as a nucleation point.
Mass flows
The mass flow meter installed on the vent line did not function as intended during the vacuum loss experiment. As a result, the mass flow rates were calculated using a model derived from fitting the blowdown of a commissioning test with the inner tank containing ambient H2 at 4 barg. The equation that best fitted the data was
where is the change of mass in the tank (which equals the mass flow of hydrogen out of the tank), ρ is the density, and ΔP is the relative pressure between the inner vessel and the atmosphere. This is analogous to the subsonic flow model (the equation for subsonic flow can be found in BS EN IEC 60079-10-1:2021), which is to be expected at lower pressures and is the most applicable in the region of most interest for the vacuum loss experiments. The mass of hydrogen in the tank during the commissioning test was calculated from the temperature and pressure, assuming it was a real gas.
The calculated mass flows during the vacuum loss experiments are shown in Figure 13. The region where the mass flow is of most interest is when the inner tank was left open after the depressurisation from 1.3 barg; the value calculated was 0.019 kg/s. In this region, the average temperature was –230°C and the average pressure was 0.015 barg (the time interval 280–300 s was chosen for this calculation). The temperature measured at 95% volume in the tank was taken as representative of the fluid entering the vent line as the vent line starts at the very top of the tank. The density of the cold gas in the vent line was evaluated using CoolProp (Bell et al., 2014) at the measured pressure and the temperature at the highest point in the tank. This meant the real density was used rather than an ideal gas approximation. If the temperature at the start of the vent line was used instead, this would have resulted in a lower calculated mass flow, as it was approximately 5°C warmer.
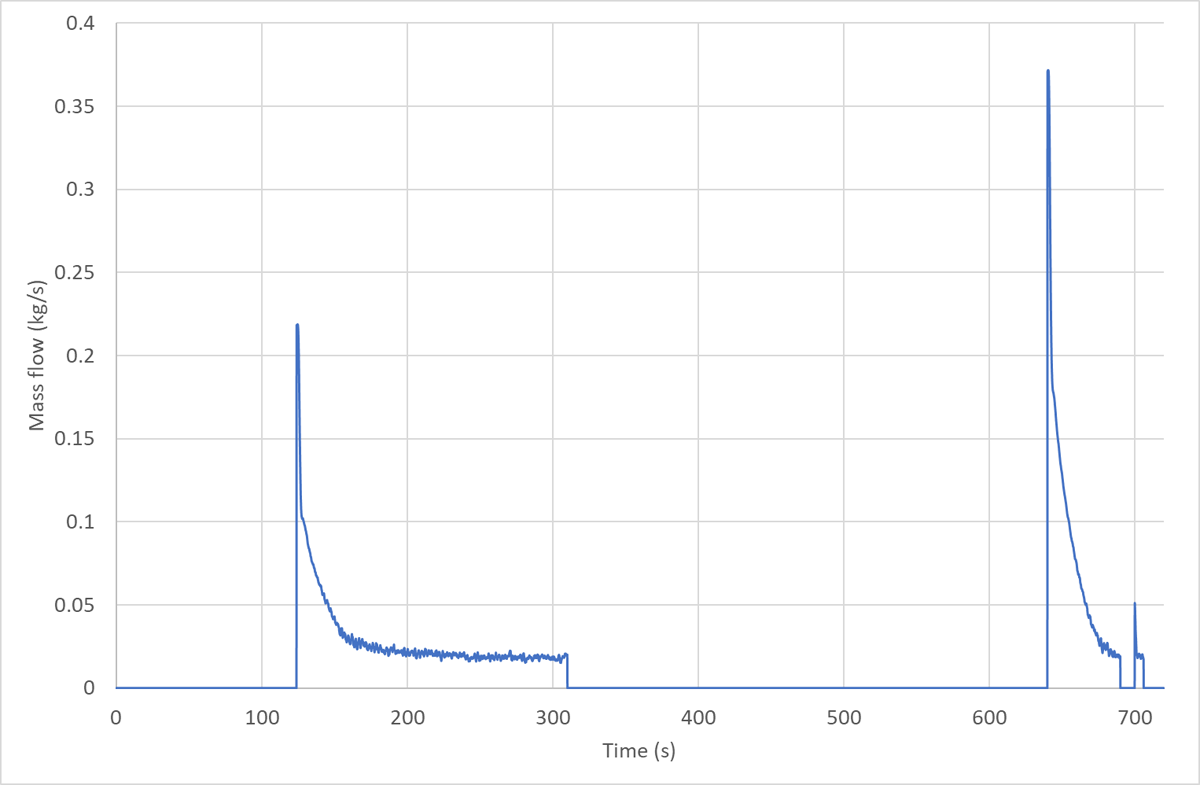
Figure 13
The calculated mass flow out of the experimental vent. This was from a model derived by fitting commissioning data.
To fully evaluate the mass flow and the errors in its calculation, the errors in the temperature and pressure measurements are required. The uncertainty in the pressure measurement was ±0.016 barg from a calibration at low pressure. The error in temperature is ±6°C from the LH2 temperature after the initial depressurisation of the tank, and this is taken as the error in the temperature for the calculations. It is likely that the errors in the temperature measurement decrease with increasing temperature as T type thermocouples have an uncertainty of ±1°C or 0.75% above –200°C (which is ±1.5°C at –200°C) (Thermocoupleinfo, 2011).
An upper estimate of the mass flow was calculated as 0.026 kg/s, assuming a temperature of –236°C and a pressure of 0.031 barg. As a comparison, BS EN ISO 21013-3:2016 gives a boil-off rate of 0.068 kg/s and a heat flux of 30 kW. This gives a safety factor of 3.6 for the calculated mass flow and 2.6 for the upper estimate. The model was also used to calculate that a pressure of 0.200 barg is required to drive a flow of 0.068 kg/s.
The pressure gauge on the inner tank was reading a value that was smaller than its accuracy, as the pressure was lower than the expected value when specifying the equipment. However, the pressure calculated to generate the expected flow from BS EN ISO 21013-3:2016 is substantially higher than the highest possible pressure (0.031 barg) consistent with the measured value (0.015 barg).
An estimate of the boil-off rate from this region can also be derived from the slope of the capacitance level gauge between 155 and 300 s in Figure 9. It should be noted that the capacitance level gauge has an accuracy of 1% of the height of the tank. From fitting the slope, a boil-off rate of 0.013 kg/s is expected, with upper and lower estimates based upon extreme slopes of 0.024 and 0.008 kg/s.
Using the N2 flow rates from the Bronkhorst flow controller, it is possible to calculate the heat transferred from the nitrogen to the tank. There are multiple parts to this calculation:
The heat transferred from cooling the gaseous N2 down from room temperature to the temperature of the boiling point or tank (whichever is higher) using an average value of the gaseous heat capacity constant Cp (taken from NIST, 2023).
If the tank is cold enough (at or below –196°C), the heat transferred from condensing of the N2, using the latent heat of evaporation (taken from Engineering Toolbox, 2008).
The heat transferred from cooling the liquid N2 down from the boiling point to the temperature of the freezing point or tank (whichever is higher) using an average value of the liquid heat capacity constant Cp (taken from NIST, 2023).
If the tank is cold enough (at or below –210°C), the heat transferred from freezing of the N2, using the latent heat of fusion (taken from Engineering Toolbox, 2008).
The heat transferred from cooling the solid N2 down from the freezing point to the temperature of the tank using an average value of the solid heat capacity constant Cp (taken from Kudryavtsev and Nemchenko, 2001).
The starting temperature of the gas was assumed to be 17°C, which was the outside temperature of the tank (there was no temperature measurement in the gas flow).
When the outer tank was open (between 200 and 310 s), a steady-state gas flow was not achieved where the outer tank remained at atmospheric pressure, but a minimum and maximum flow for steady state can be determined (see section on N2 Gas Flows). The minimum and maximum flows were 871 and 1346 L/min. The assumed final temperature for the gas was –240°C if it condensed on the bottom of the tank (including a –6°C offset to give the maximum possible heat transfer). The heat transfer calculated was used to calculate the maximum possible boil-off rate if all heat was transferred to the evaporation process using the latent heat of vapourisation of H2. This assumes all energy is transferred to the bottom of the tank, which is conservative and will lead to the largest possible energy transfer and boil-off rate.
The results of these calculations for gas flows (if all of the steady-state flow condenses in the interspace at the bottom of the outer tank) are shown in Tables 2 and 3. Almost half of the heat transfer comes from the change of state of the N2. These calculations put upper and lower bounds on the boil-off rate of the LH2 of 0.021 and 0.033 kg/s. This is in good agreement with the 0.019 kg/s calculated above. The uncertainty in mass flow measurement is ±80 L/min, which corresponds to an uncertainty of ±5% for the maximum N2 flow rate and ±9% for the minimum flow rate.
Table 2
The minimum heat flows from the gaseous nitrogen flow with the inner tank open if all condenses at the bottom of the outer tank, and the corresponding LH2 boil-off rate.
| Min. heat flow from cooling GN2 to boiling point (kW) | 4.139 |
| Min. heat flow from liquifying LN2 (kW) | 3.611 |
| Min. heat flow from cooling LN2 to freezing point (kW) | 0.510 |
| Min. heat flow from freezing LN2 (kW) | 0.468 |
| Min. heat flow from cooling solid N2 (kW) | 0.772 |
| Total min. heat flow (kW) | 9.501 |
| Min. evaporation rate if all heat is transferred to LH2 (kg/s) | 0.021 |
Table 3
The maximum heat flows from the gaseous nitrogen flow with the inner tank open if all condenses at the bottom of the outer tank, and the corresponding LH2 boil-off rate.
| Max. heat flow from cooling GN2 to boiling point (kW) | 6.396 |
| Max. heat flow from liquifying LN2 (kW) | 5.580 |
| Max. heat flow from cooling LN2 to freezing point (kW) | 0.789 |
| Max. heat flow from freezing LN2 (kW) | 0.723 |
| Max. heat flow from cooling solid N2 (kW) | 1.193 |
| Total max. heat flow (kW) | 14.682 |
| Max. evaporation rate if all heat is transferred to LH2 (kg/s) | 0.033 |
The calculations were repeated for the case of gaseous nitrogen transferring its heat to the top of the tank, where the finishing temperature of the gas after heat transfer was taken to be –177°C. The results of the calculations are shown in Tables 4 and 5. The calculated boil-off rates for this scenario are in the range 0.008–0.013 kg/s, which is substantially below that for condensation on the bottom of the tank. It is also below the 0.019 kg/s calculated above, so N2 must have been condensing on the lower part of the tank to drive the boil-off rates observed.
Table 4
The minimum heat flows from the gaseous nitrogen flow with the inner tank open if all heat is transferred to the top of the outer tank, and the corresponding LH2 boil-off rate.
| Min. heat flow from cooling GN2 to temperature of the top of the tank (kW) | 3.770 |
| Min. evaporation rate if all heat is transferred to LH2 (kg/s) | 0.008 |
Table 5
The maximum heat flows from the gaseous nitrogen flow with the inner tank open if all heat is transferred to the top of the outer tank, and the corresponding LH2 boil-off rate.
| Max. heat flow from cooling GN2 to the temperature of the top of the tank (kW) | 5.826 |
| Max. evaporation rate if all heat is transferred to LH2 (kg/s) | 0.013 |
The heat transfer and therefore evaporation rate solely due to thermal transfer from the outer tank can be estimated using the thermal conductivity from Funke and Haberstroh (2015). An upper value of 0.1 W/mK was chosen from Funke and Haberstroh (2015) to give the highest possible heat transfer. It is worth noting the experiments quoted in this paper use a fluid to break the vacuum that will not condense. This calculation results in a heat transfer rate of 2.67 kW and a boil-off rate of 0.006 kg/s. It is clear that condensing of the nitrogen is required to drive the boil-off rates observed.
The heat transfer was also calculated when the inner tank was pressurised to 3 barg. Calculating the corresponding boil-off rate for a closed tank requires further modelling that was beyond the scope of the current analysis. The N2 flow rate was 400 L/min, which is substantially lower than when the inner tank was open, showing that the closed system reduced the uptake of energy from the outer tank, therefore reducing the condensation rate of nitrogen and flow of nitrogen into the outer tank. An alternative explanation is that solid N2 accumulation reduced the heat transfer and condensation of N2. The tank temperatures of –240°C at the bottom and –177°C at the top from the previous calculations were used. The results are given in Tables 6 and 7.
Table 6
The heat flows from the gaseous nitrogen flow with the inner tank closed if all condenses at the bottom of the outer tank.
| Heat flow from cooling GN2 to boiling point (kW) | 1.901 |
| Heat flow from liquifying LN2 (kW) | 1.658 |
| Heat flow from cooling LN2 to freezing point (kW) | 0.234 |
| Heat flow from freezing LN2 (kW) | 0.214 |
| Heat flow from cooling solid N2 (kW) | 0.355 |
| Total heat flow (kW) | 4.361 |
MLI damage
After the observation of glass fibre tissue in the valve to the vacuum pump, a borescope was used to observe damage to the MLI in the outer tank. Access was achieved by cutting through some of the penetrations into the outer tank. Some examples of the damage are shown in Figures 14 and 15. Figure 16 has a schematic showing where damage occurred on the MLI.
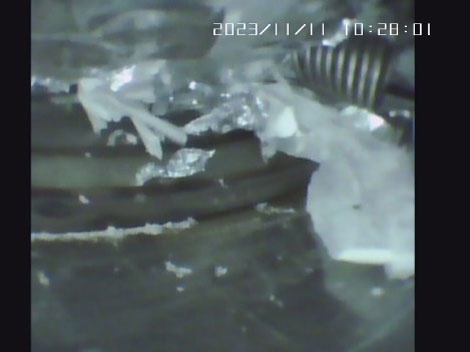
Figure 14
Torn MLI accumulated around a coil in the outer tank. Abbreviation: MLI, multi-layer insulation.
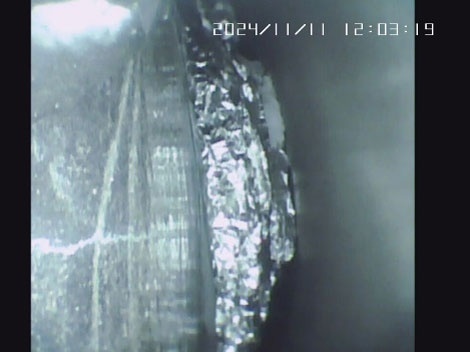
Figure 15
Layer(s) of MLI peeled back along the cylindrical section of the tank. Abbreviation: MLI, multi-layer insulation.
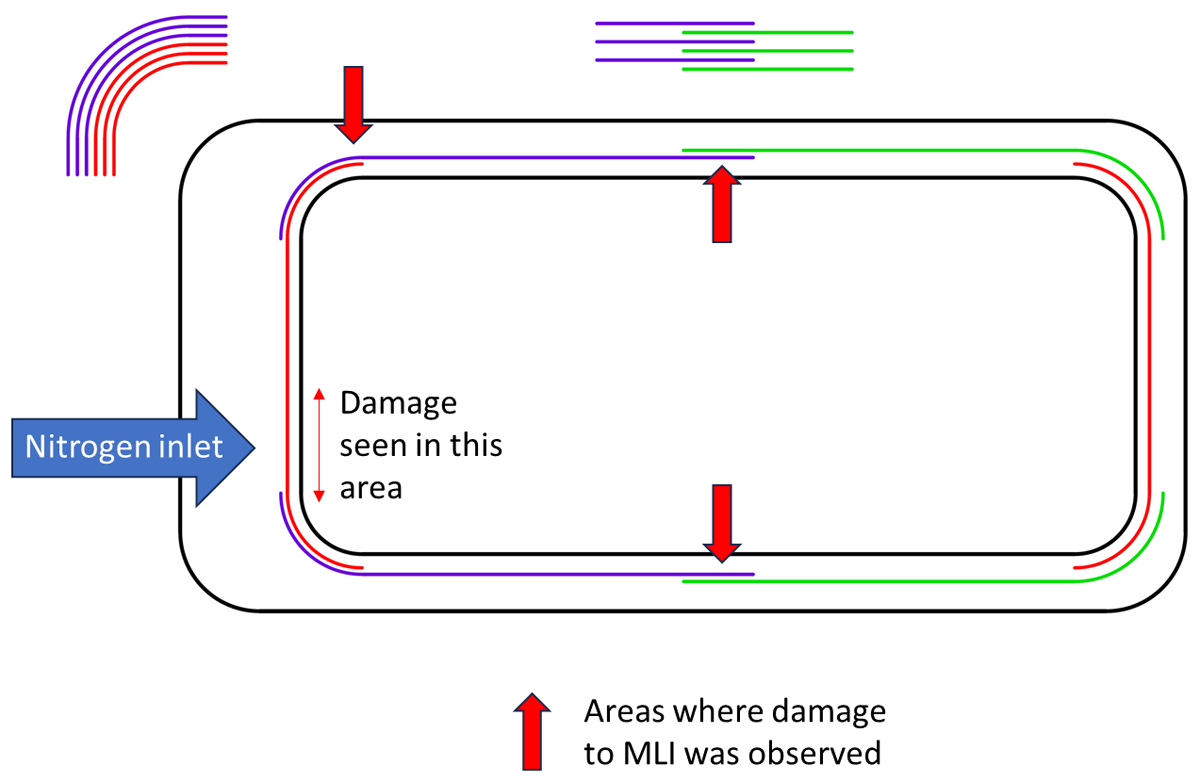
Figure 16
A diagram showing where damage to the MLI was observed; the different colours are different MLI blankets. Abbreviation: MLI, multi-layer insulation.
At the location of the primary impact of the nitrogen, the thick outer foil installed to protect the MLI was observed to be unbroken. There was some broken foil and tissue seen around this; it was difficult to know how many layers of MLI were still intact, partly due to the thick layer of foil remaining unbroken. At the top of that domed end no damage was seen to the blanket of MLI covering the end. However, the blanket was seen to be frilly at the edge where it meets the cylindrical section.
Along the cylindrical section, damage was observed at the joins in the blankets halfway along and at overlaps with domed ends. Some layers of MLI had peeled back. Damage was also observed near penetrations.
At the vacuum pump connection end, little damage to the MLI was seen, bar a few frayed edges. The debris seen was likely transported from damage at the other end by force of nitrogen ingress and/or use of the vacuum pump after the experiment.
The insulation near AV4 felt “squidgy” (this is how the tank manufacturer described how MLI felt when at its optimum layer density), less than at the top of the domed end or along the cylindrical section, suggesting some loss of layer density where the nitrogen impacted. The insulation at the vacuum pump end was closer in feeling to that near AV4.
The foil layers in the MLI are to limit radiative transfer of heat from the outside wall of the tank, and the glass fibre spacers are to limit conduction of heat between the foil layers. The heat transfer rate is approximately inversely proportional to the number of layers. Given that in all locations observed, MLI was found to be in place with no holes, even if the number of layers were likely reduced in a few locations, it is predicted that the reduction in performance of the MLI will be small. However, the significance of this damage to the MLI on the normal function of the tank requires further investigation.
Conclusions
This paper describes a series of tests where the vacuum of an LH2 tank of 1.5 m3 capacity with a pressure rating of 10 barg was intentionally failed.
When the vacuum in the outer tank was failed with ambient gaseous nitrogen, the mass flow out of the inner tank when 25% full (27 kg) was calculated as 0.019 kg/s from the data recorded, with an upper error bound of 0.026 kg/s. This compares with an expected value of 0.068 kg/s from BS EN ISO 21013-3:2016.
From the temperatures and pressures measured, vapour above the saturation temperature entered the vent line under all conditions tested. During depressurisations in this work (from a maximum of 3 barg), saturation conditions were not achieved on entry to the vent line, but the behaviour observed suggested that saturation conditions could be achieved if the depressurisation was fast enough from a high enough pressure. This could mean that vapour condenses out in the vent line for a short period of time during depressurisation. BS EN ISO 21013-3:2016 makes an assumption that the vapour in the vent line is at saturation conditions.
It was not possible to determine if level swell occurred during the rapid depressurisations when the simulated safety device opened as the level probe appeared to act as a nucleation point for the rapid boiling that occurred.
Nitrogen gas was metered into the vacuum space during the vacuum break experiment. Initially after breaking the vacuum, there was a large inrush of nitrogen and 1 bara was achieved in the outer tank within 20 s. When the outer tank was left open a steady state was achieved, where the rate of condensing of the nitrogen was balanced by the amount of nitrogen that replaced it; from this it was possible to calculate the heat transfer from the inrush of nitrogen and its condensation/freezing on the inner tank. This heat transfer was calculated to be between 9.5 and 14.7 kW, and this was used to put an upper limit on the boil-off rate of the LH2 of 0.033 kg/s if all heat is transferred into boiling the LH2. Almost half of the energy transferred from the nitrogen came from its condensation and freezing.
After the experiments, damage was observed to the paint on the bottom of the tank, potentially indicating cryogens pooled there while the tank was warming up, with the solid N2 turning to liquid. This damage did not occur until at least three hours after the breaking of the vacuum. This paint loss is indicative that cold temperatures could be occurring at the base of the tank following vacuum failure and is potentially a topic for further investigation.
During the vacuum break experiments, the MLI sustained damage, leaving debris in the outer tank, meaning further experiments were not possible on safety grounds. The damage to the MLI was assessed by cutting through some of the penetrations into the outer tank and using a borescope to view inside. It was concluded that the damage was sustained to the edges of the MLI blankets and around penetrations through the MLI.
The foil layers in the MLI are to stop radiative transfer of heat from the outside wall of the tank, and the glass fibre spacers are to stop conduction of heat between the foil layers. The heat transfer rate is approximately inversely proportional to the number of layers. Given that in all locations observed, MLI was found to be in place with no holes, even if the number of layers was likely reduced in a few locations, it is predicted that the reduction in performance of the MLI will be small. The significance of this damage on the normal function of the tank is unclear and is another topic for further investigation. Most cryogenic tanks in service use the vacuum plug in the outer tank as the pressure relief, so this would be less prone to blocking than safety relief valves. The relief capacity for the outer tank is sized to relieve a leak of cold H2 from the inner tank and has not been tested in this work.
Future work to assess the results of vacuum leaks with nitrogen/air for different fill levels of the tank and for hydrogen leaks into the vacuum is also planned.
Disclaimer
This report and the work it describes were undertaken by the Health and Safety Executive (HSE) under contract to the Aviation Technologies Institute through the ZEST programme. Its contents, including any opinions and/or conclusions expressed or recommendations made, do not supersede current HSE policy or guidance.
Ethics and Consent
Ethics approval was not required for this work.
© Crown Copyright 2025.