
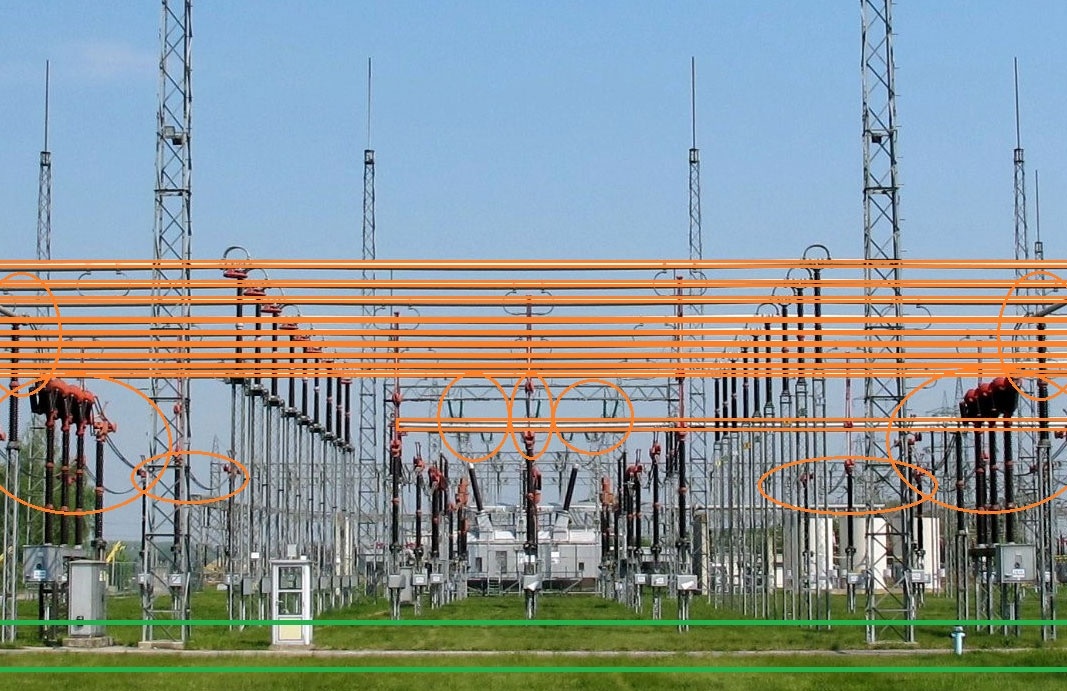
Figure 1
German outdoor 400 kV substation showing the location of cable trenching (green) beneath exposed 400 kV conducting assets (orange). Source: wdwd, CC BY 3.0 via Wikimedia Commons with orange and green indications added by the authors.
Table 1
Characteristics of transmission substation ignition sources.
| IGNITION SOURCE | HEIGHT(s) ABOVE GROUND (m) | TWO-DIMENSIONAL SPATIAL PREVALENCE (SURFACE AREA OF SUBSTATION OVER WHICH THE HAZARD MIGHT EXIST) | DURATION FOR WHICH THE IGNITION HAZARD IS PRESENT |
|---|---|---|---|
| 1) Disconnector switching | 5.5–12.5 | Single point sources, typically two per circuit or per primary plant item, three-phase so a six-circuit substation might have 36 single points. | Less than two instances per day, or less if used solely for maintenance outages, duration less than a second (IEC62271-102:2018). |
| 2) Insulator discharge | 5.5–12.5 | Single point sources on every primary plant item. 8–14 per circuit, three-phase, so a six-circuit substation might have 80 single points. | Varies with air quality, more research needed to quantify. |
| 3) Corona discharge | 5.5–12.5 | Every exposed conductor. Some areas have a mesh of conductors separated by minimum phase-to-phase safety distance of roughly 4 m. | Permanent for all energised exposed conductors. |
| 4) ROEP | Less than 2.5 | Every metallic structure could see this effect, a large set of single points throughout the substation. | Only from fault currents so rare and less than a second (IEC62271-102:2018). |
| 5) Spark gaps | 1.5–12.5 | Single point sources throughout the substation, on many supporting structures. | Only from fault currents so rare and less than a second (IEC62271-102:2018). |
| 6) Induced voltages | 0–12.5 | Vehicles or unearthed metallic structures, small surface area and likely away from conductors. | During site works or other human activities on site so rare but duration in order of hours is possible. |
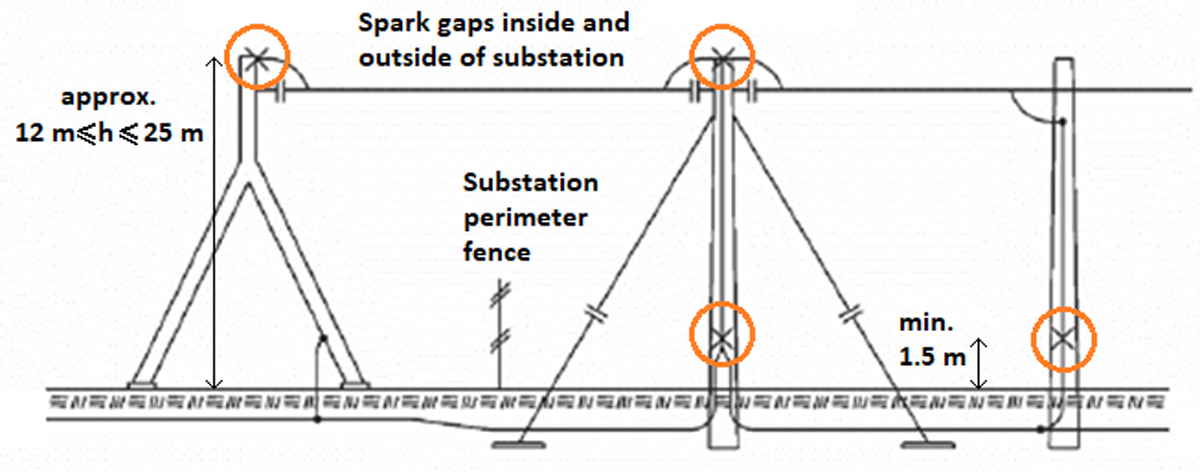
Figure 2
A gantry and tower earthing configuration, annotations added to SvK (2015), showing the locations of spark gaps in the earthing scheme of a 400 kV overhead line in proximity to a substation perimeter fence.
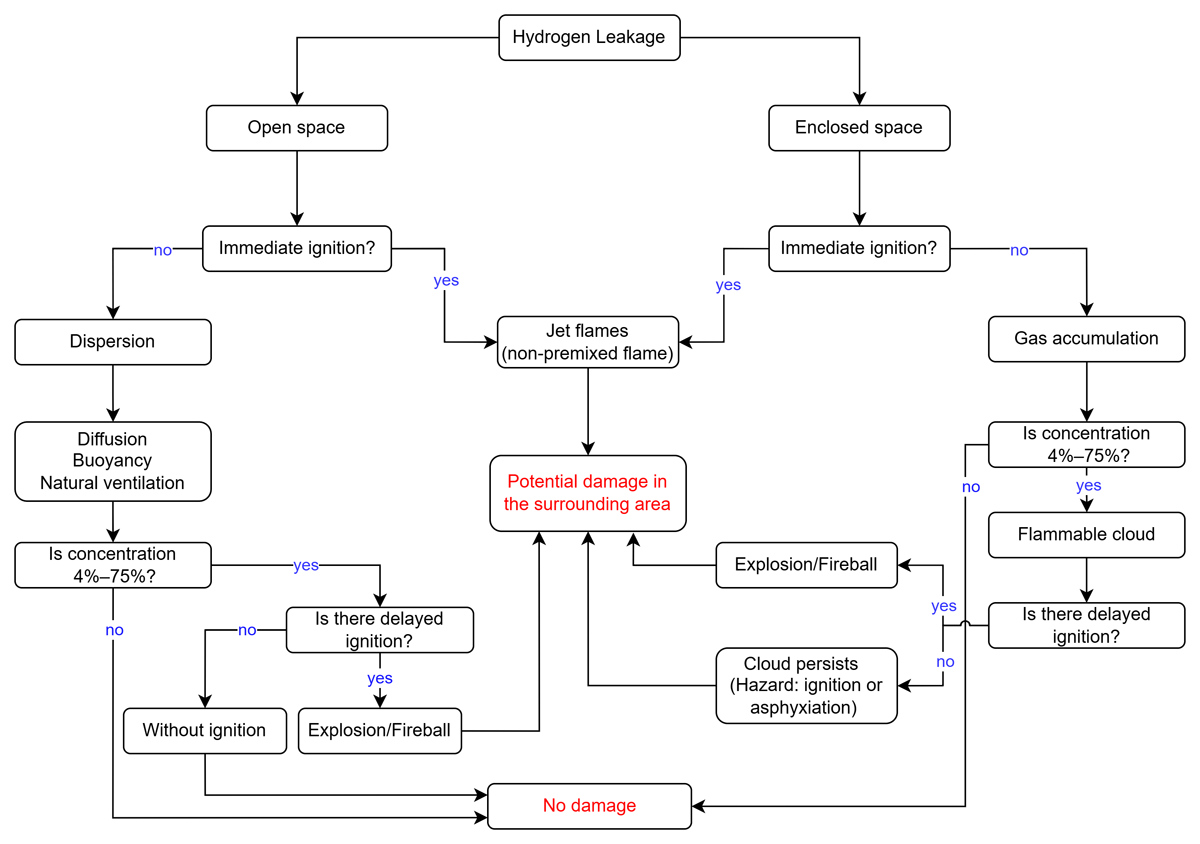
Figure 3
Event tree illustrating the hazards and consequences arising from hydrogen leakage (Molkov, 2012; El-Harbawi, 2022).
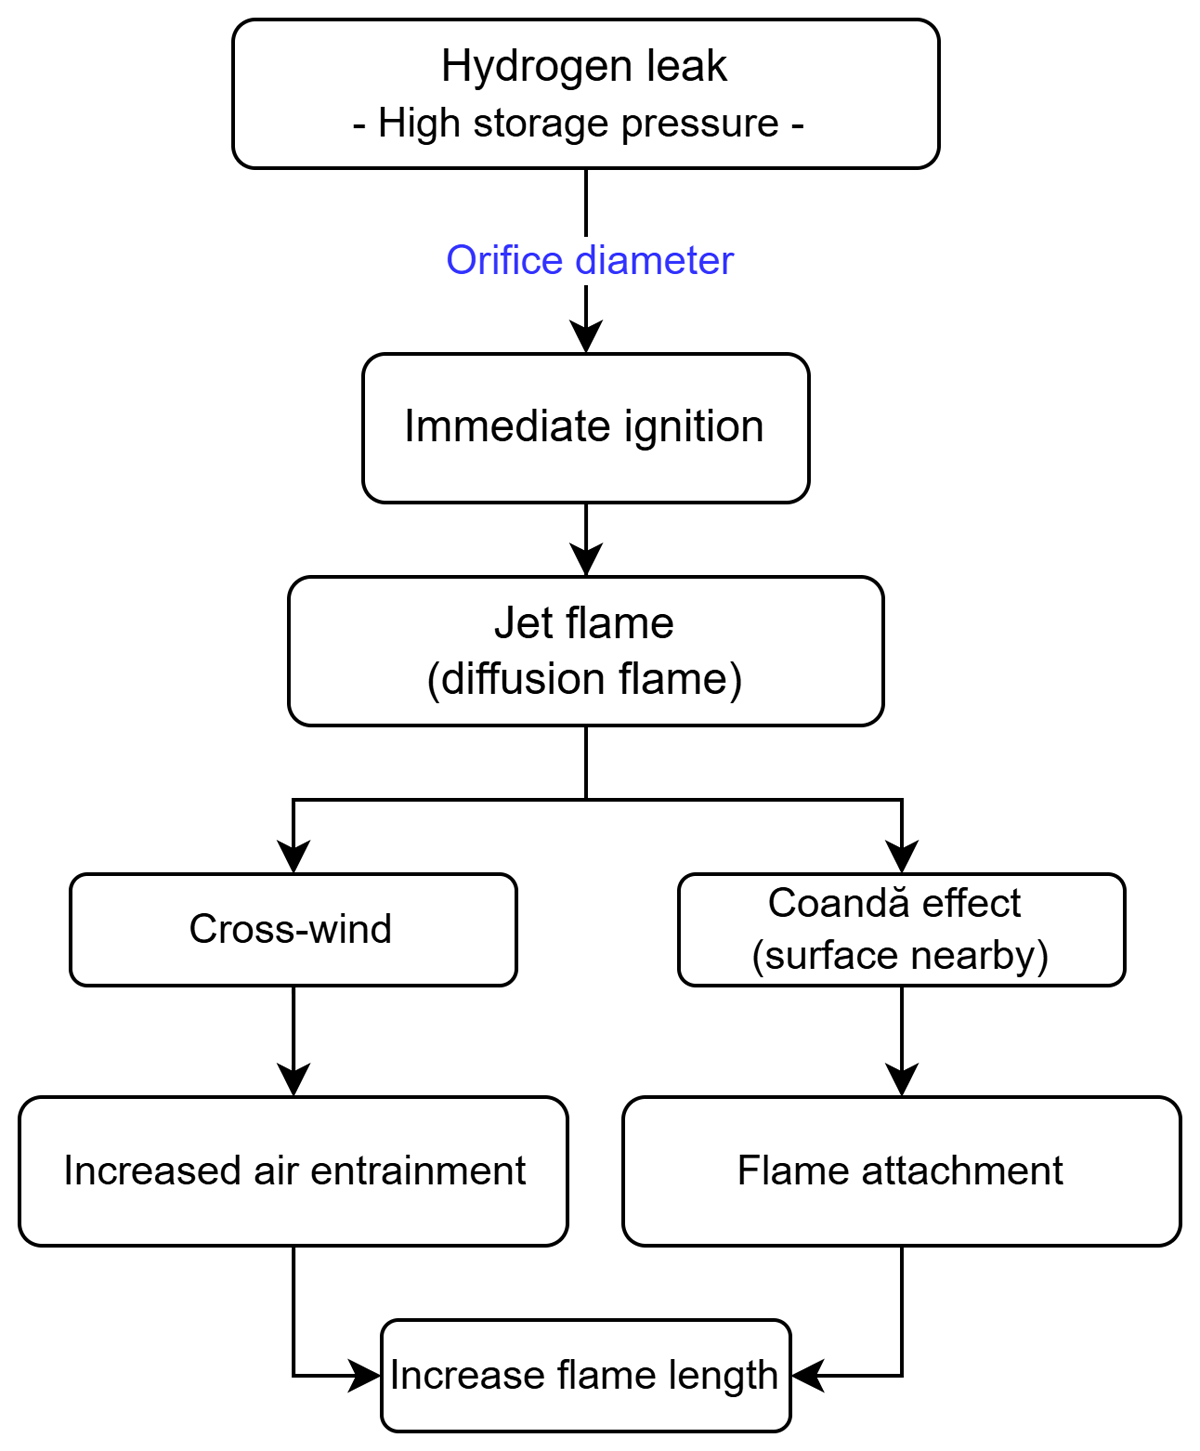
Figure 4
Jet flame development from high-pressure hydrogen leakage, influenced by wind and nearby surfaces.
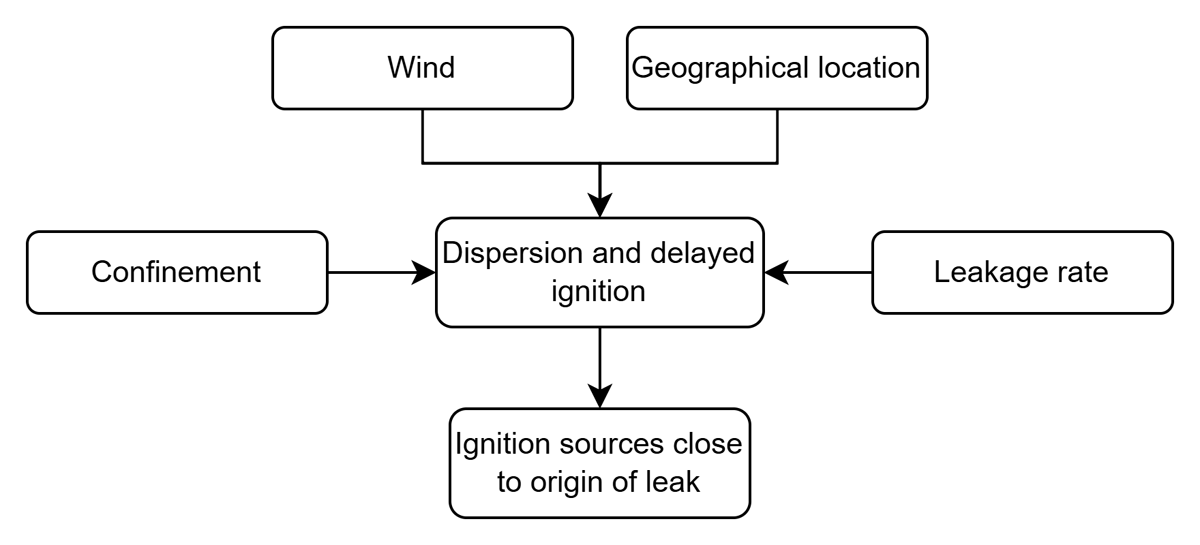
Figure 5
Identified factors that affect the outcome of the partial event related to dispersion and delayed ignition.

Figure 6
Identified features of the partial event related to delayed ignition of a flammable cloud.
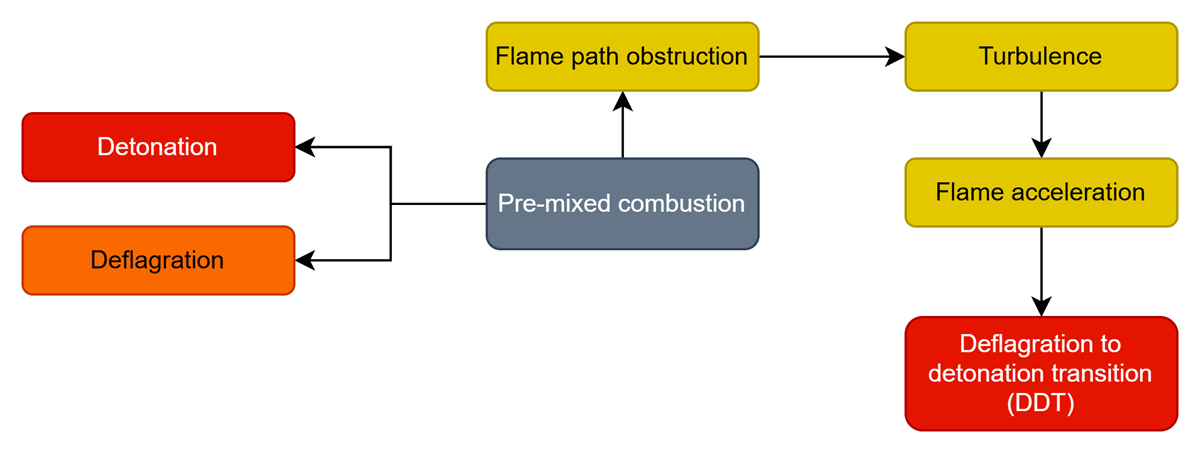
Figure 7
Aspects affecting pre-mixed combustion. Danger potential from yellow to red, where yellow indicates low consequences, orange midrange consequences and red high consequences.
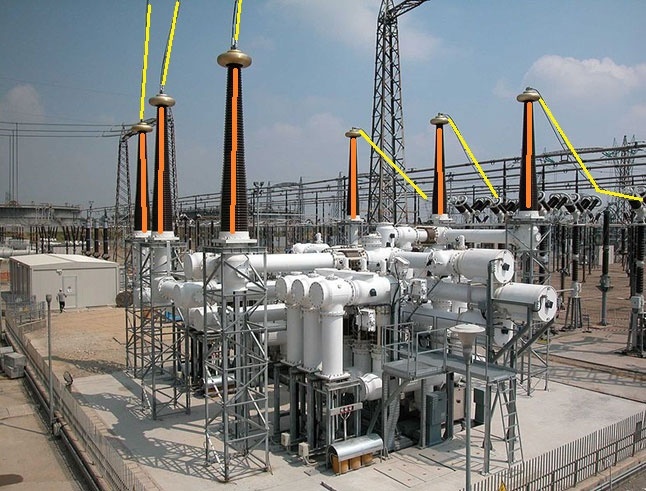
Figure 8
400 kV gas-insulated switchgear (foreground) with six (vertical) GIS–AIS transition bays. Ignition sources from tracking (orange) and corona discharge (yellow) are highlighted. Notable is the lack of sources at lower levels. Source Dingy, CC BY 4.0 via Wikimedia Commons.