
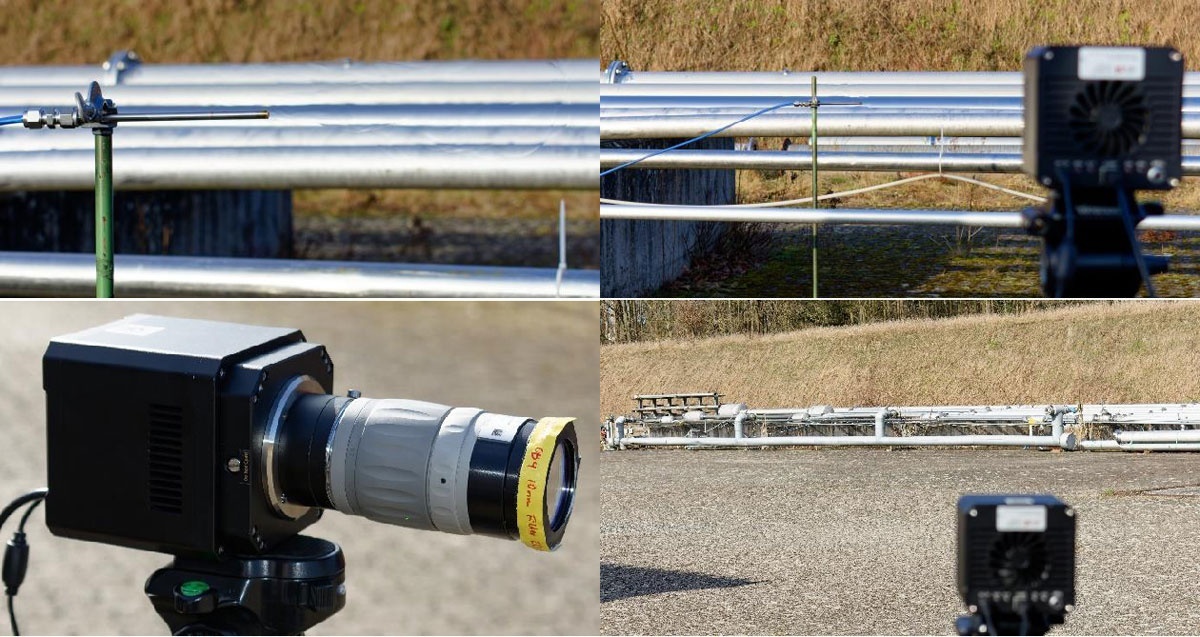
Figure 1
Top row: 50 l/min hydrogen flame (left) and UV camera setup @ 2.5 m distance (right). Bottom row: Camera system with UV filter (left) and experimental setup @ 40 m distance (right).
Table 1
Type, distance, date and sun altitude of flame measurements.
| MEASUREMENT | DISTANCE | DATE | TIME (CET) | SUN ALTITUDE | SKY |
|---|---|---|---|---|---|
| Flame length | 2.5 m | 2025-01-21 | 13:52…14:02 | 15.5°above horizon | Clear |
| Flame detection | 40 m | 2025-03-07 | 11:13…11:43 | 31.2°above horizon | Clear |
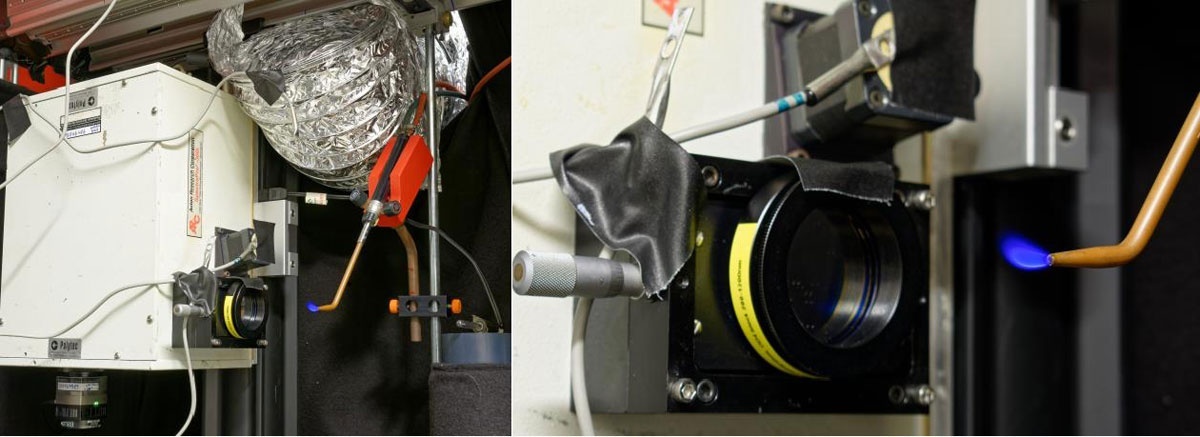
Figure 2
Spectroscopic setup with spectrometer, camera, filter, methane flame, and Hg-pencil wavelength calibration lamp. The large suction hose for the hot exhaust gases is visible above the flame. Four temperature sensors monitor the temperature at critical points; it should not exceed 50°C.
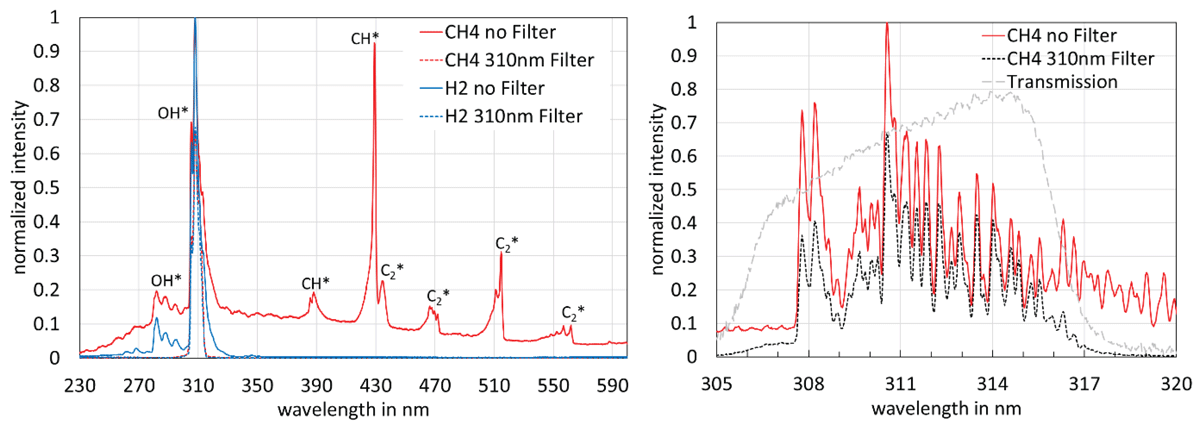
Figure 3
Measured spectrum of a methane flame (red) and a hydrogen flame (blue) without any filter (solid line) and behind the 310 nm filter (dotted line). Left: overall spectrum (150 l/mm grating), Right: detailed view (1200 l/mm grating). Dashed line: calculated filter transmission.
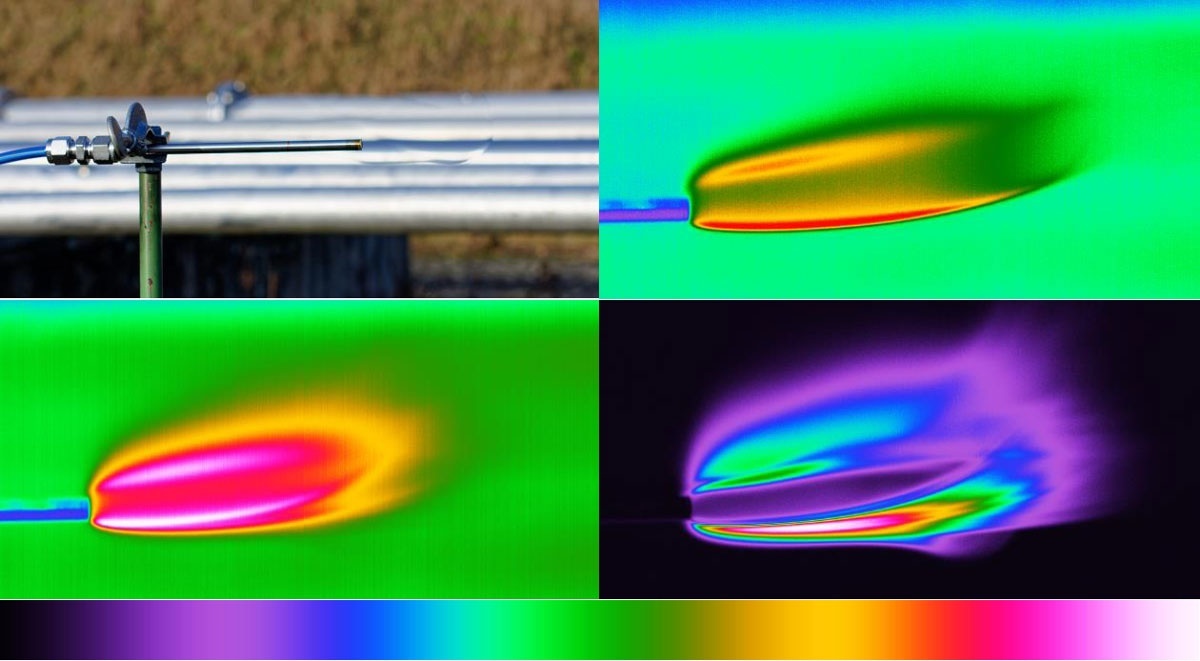
Figure 4
8 l/min hydrogen flame @ 2.5 m distance. Top: Visual image (left) and color-encoded UV image (right). Bottom: color-encoded average (left) and standard deviation (right) of 100 UV-images. Below the images, the custom look-up table for the conversion of intensities into colors is provided.
Table 2
Hydrogen flow rate and resulting flame dimensions.
| HYDROGEN FLOW RATE IN L/MIN | FLAME LENGTH IN CM | MAX. FLAME WIDTH IN CM | ANGULAR DIMENSIONS @ 40 M DISTANCE |
|---|---|---|---|
| 2 | 1.7 | 1.8 | 0.024° × 0.026° |
| 4 | 3.5 | 3.1 | 0.050° × 0.044° |
| 8 | 7.9 | 3.3 | 0.11° × 0.047° |
| 15 | 16.9 | 2.8 | 0.24° × 0.040° |
| 30 | 16.3 | 4.6 | 0.23° × 0.067° |
| 50 | 24.7 | 7.0 | 0.35° × 0.10° |
| 100 | 26.5 | 7.5 | 0.38° × 0.11° |
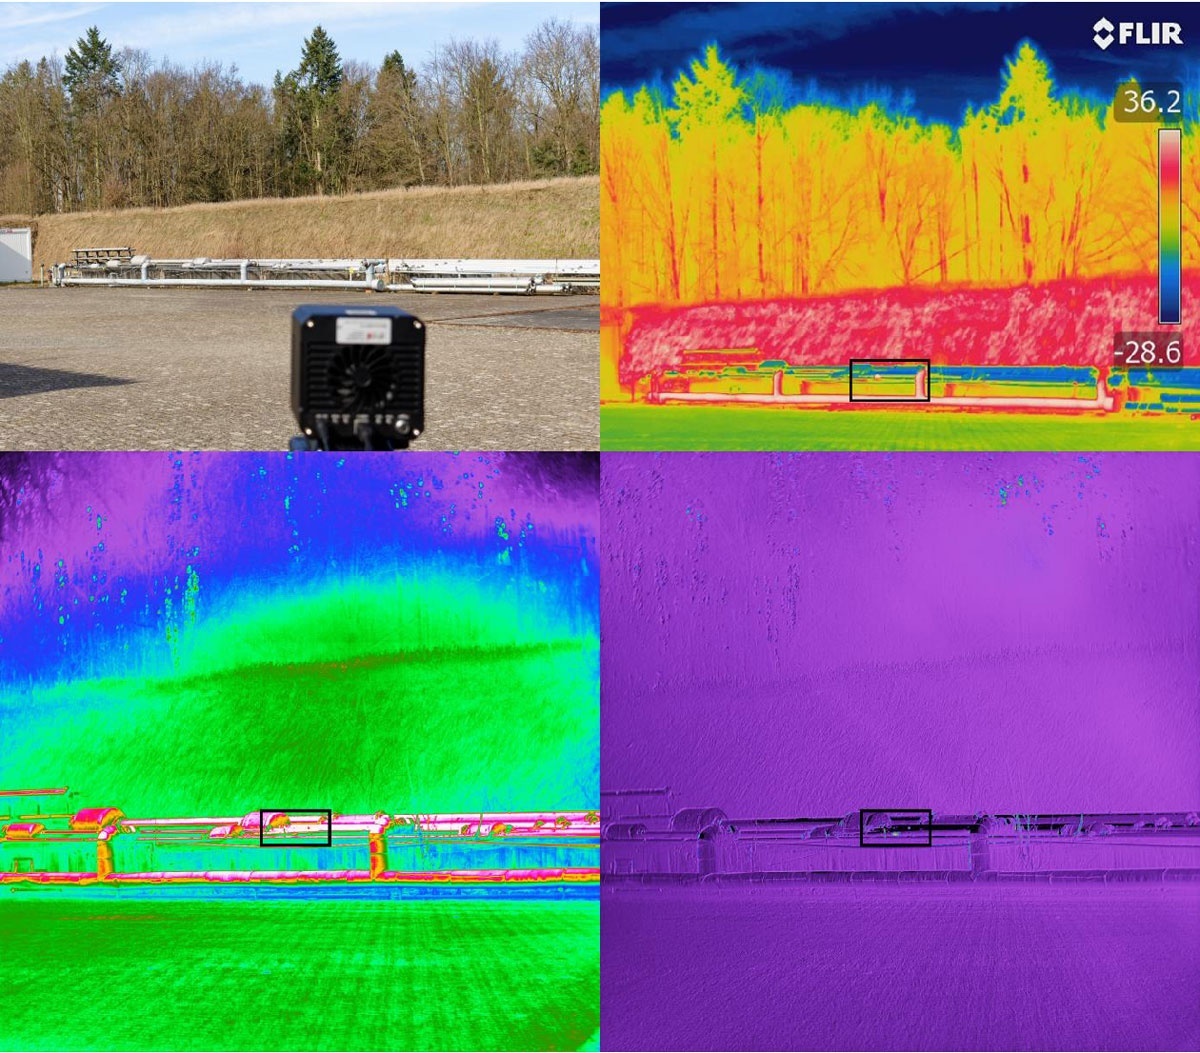
Figure 5
8 l/min hydrogen flame @ 40 m distance. Top: Visual view from observation point (left), MIR image (right) with indication of flame (black box). Bottom: color-encoded average image (left) and standard deviation image (right) of 100 UV-images with indication of flame (black boxes). Enlarged views of the black sections are shown in Figure 6.
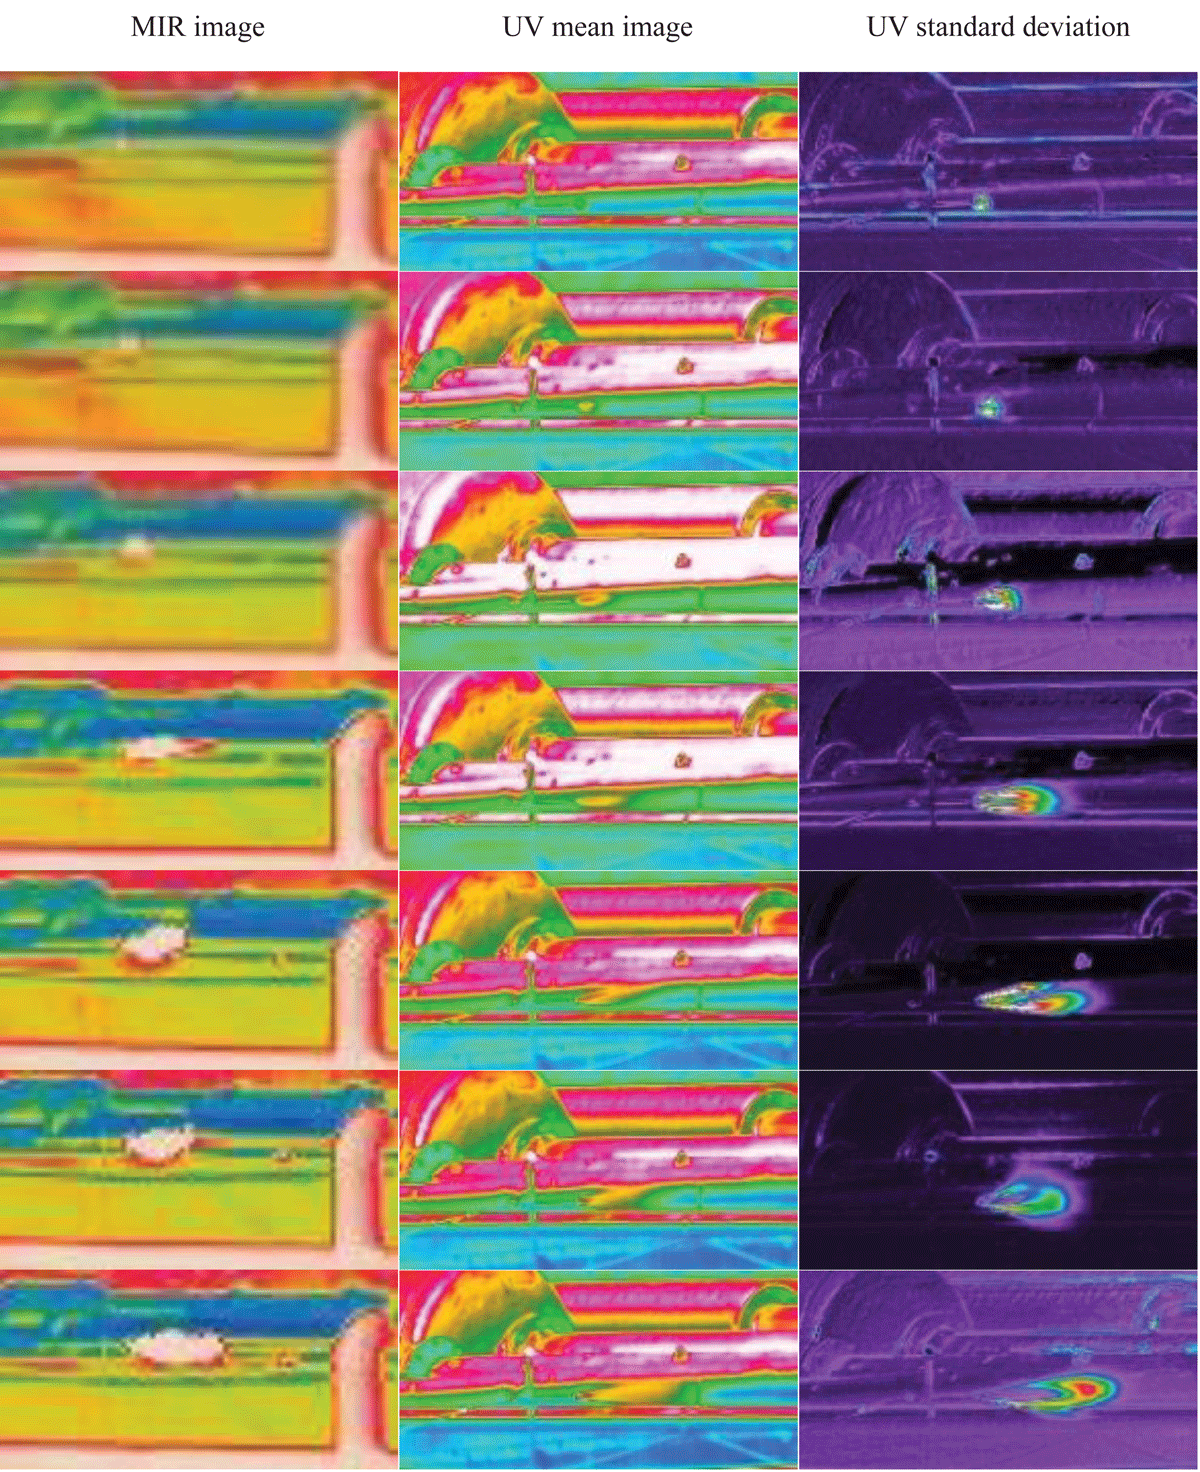
Figure 6
Enlarged views of the flames (black box sections in Figure 5). Top to Bottom: H2 flame 2/4/8/15/30/50/100 l/min. Left to right: MIR image, mean UV image, UV standard deviation.