
1. Introduction
Hydrogen is increasingly recognized as a cornerstone of sustainable energy systems, playing a pivotal role in the global transition toward decarbonization. However, its unique physical and chemical properties pose significant safety challenges: Hydrogen, being the lightest element, is highly diffusive and can easily escape through minute openings. These small leaks, while often overlooked, can lead to serious consequences due to hydrogen’s unique properties: Hydrogen has an extremely wide flammability range in air (4% to 77% by volume), one of the lowest minimum ignition energies (0.017 mJ) and the lowest quenching distance (maximum experimental safe gap) of all gases (pressure-dependent down to 0.17 mm) (chemsafe data base, 2025). This combination makes hydrogen particularly prone to ignition, even from small sparks or hot surfaces. Small burning hydrogen leaks at industrial installations pose significant safety hazards.
Unlike conventional fuels, hydrogen flames emit very little infrared (IR) or visible radiation because there are no carbon dioxide and soot radiation bands, and the IR emissions are strongly absorbed by water vapor in the atmosphere. This results in the flames being almost invisible, making them difficult to detect and fight effectively in the event of an accident, although it should be emphasized that hydrogen flames are not absolutely invisible (Schefer et al., 2009).
Industrial installations face additional risks due to the high pressures and cryogenic temperatures often involved in hydrogen production and storage. These conditions can lead to material embrittlement and increase the likelihood of leaks over time. For hydrogen stored at 690 bar, a pinhole leak as small as 0.4 µm could support a stable flame (Butler et al., 2009).
The difficulty in detecting hydrogen leaks using human senses (as it is colorless, odorless, and tasteless) necessitates specialized detection systems and rigorous safety protocols. One of the most common and effective methods for detecting small hydrogen leaks is using hydrogen sensors. These sensors are strategically placed throughout industrial facilities and can detect minute amounts of hydrogen in the air. However, such sensors can only detect hydrogen in direct contact, not remotely. Burnt hydrogen is not detected. Temperature sensors can detect nearby flames, but the range of thermal emission to heat up a thermocouple significantly is very limited and is hampered by wind and rain. A comprehensive overview of the current state of the art in hydrogen leak detection can be found in the recent review articles by Qanbar and Hong (2024) and by Connor et al. (2025).
The most sensitive commercial leak detection systems are ultrasonic camera systems. Cameras such as the Distran Ultra Pro advertise a detection limit of only 0.15 l/h. However, this high sensitivity requires a quiet environment, a short distance of only 30 cm, and a large pressure difference of at least 1.5 bar (https://distran.swiss/en/ultra-pro/). Such systems are used in environments such as the International Space Station to locate small leaks (https://distran.swiss/en/nasa-ultra-pro-iss/). In typical industrial environments, the minimum detectable leak rate is much higher (50 l/min at a distance of 20 m is advertised, https://distran.swiss/en/sonicview-acoustic-gas-leak-detection-system/).
Remote sensing of small hydrogen flames over distances of many tens of meters requires optical methods. However, hydrogen flames are the least luminous of all fuels, as neither hydrogen nor hot water vapor nor the radicals produced during combustion have significant emission lines in the visible range (Gordon et al., 2022). Therefore, there are two possibilities: detection at longer wavelengths (IR emissions) or detection at shorter wavelengths (especially OH* chemiluminescence in the ultraviolet (UV) range).
Thermographic cameras (also known as thermal imaging cameras or IR cameras) are a proven technique for detecting hot spots and flames using their IR signals. However, industrial plants often have hot spots or light sources such as incandescent lamps, which are bright IR emitters. In addition, open-air installations can reflect the strong IR sunlight. All these emissions can outshine the IR signature of small hydrogen flames, making their detection difficult and unreliable.
The most prominent emission of a hydrogen flame occurs in the UV range at 305–325 nm with a peak around 310 nm, caused by OH* chemiluminescence (Gordon et al., 2022). In this wavelength range, the extraterrestrial solar spectral irradiance is more than an order of magnitude lower than in the visible range (Fontenla et al., 2011). High UV absorption in the atmosphere further reduces solar spectral irradiance (Dirnbacher, 2015). Strong UV emissions of the hydrogen flame around 310 nm, on the one hand, and low solar irradiance as well as no interfering emissions from incandescent lamps and heat sources, on the other hand, considerably simplify the detection of hydrogen flames via OH* chemiluminescence.
In this work, the detectability of small hydrogen flames under realistic outdoor conditions is investigated using both mid-infrared (MIR) and UV detection methods. Professional state-of-the-art UV and MIR cameras are operated side by side in direct sunlight, and the resulting UV and MIR images are compared. While cameras are commercially available for heat detection in the IR range, there is no such camera for UV flame detection using OH* chemiluminescence. A suitable setup was developed in this study, including the selection and experimental verification of an appropriate UV filter. The flames in the UV images can be detected using automated image recognition. Both camera systems are lightweight and mobile and are therefore—at least in general—suitable for autonomous monitoring of industrial plants using commercially available drones on which the cameras could be mounted.
2. Experimental Setup and Measurements
The measurements in this study were carried out in an outdoor area with a series of pipelines typical of industrial plants belonging to our institute. A small hydrogen flame was installed between these pipes (Figure 1). For this purpose, a 6 mm Swagelok tube (4 mm inner diameter) was supplied with pure hydrogen gas via a hose system. The hydrogen flow rate is set successively to 2/4/8/15/30/50/100 liters per minute (l/min) according to the measuring plan, and the resulting flame is photographed. The flame was lit with a lighter. The UV and IR images were taken perpendicular to the flame.
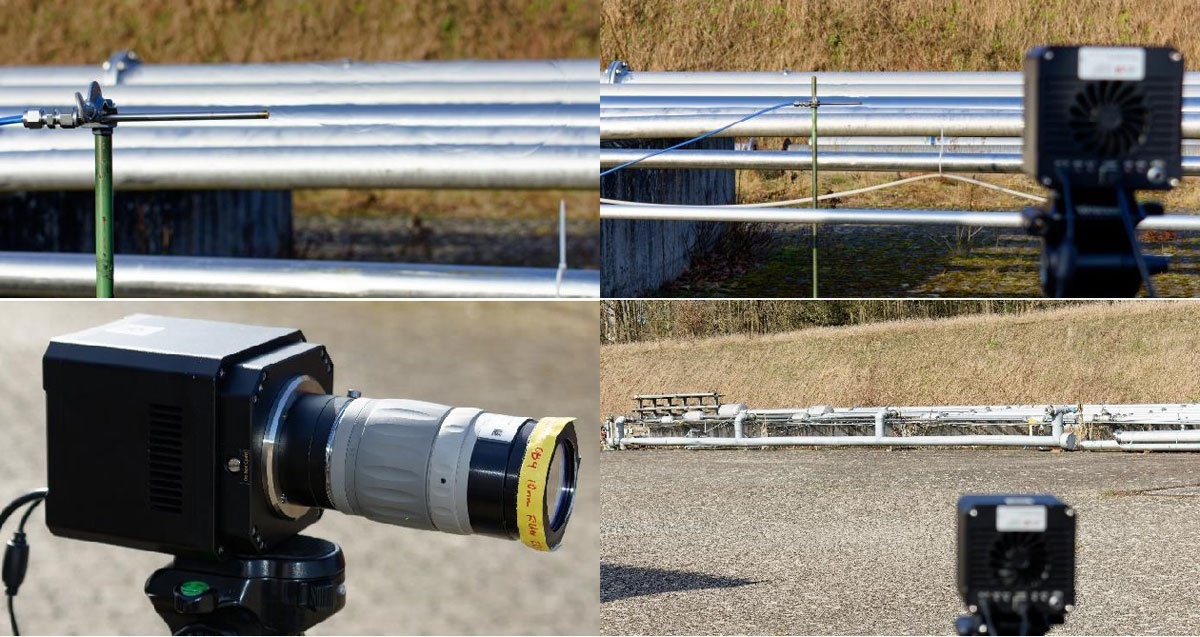
Figure 1
Top row: 50 l/min hydrogen flame (left) and UV camera setup @ 2.5 m distance (right). Bottom row: Camera system with UV filter (left) and experimental setup @ 40 m distance (right).
2.1 Camera systems
Three camera systems were used in total:
Visual range: Standard Nikon camera D3400 with APS-C CMOS-sensor 24.8 Megapixel and Kit zoom lens 18–55 mm. This system is used to document the experimental setup and the hydrogen flame as seen by the human eye.
MIR range: Camera FLIR T640 with a 640 × 480 pixels sensor, 17 µm pixel size and sensitive in the MIR (7.5–14 µm). Temperature range: –40°C–2000°C. Lens: 24.6 mm FLIR IR lens. The field of view of this camera–sensor–lens combination is 25° × 19° and the spatial resolution is 0.68 mrad (0.039°).
UV range: This system was set up for this study and was optimized for OH* chemiluminescence imaging near 310 nm. Camera: EHD MaxCam-400UV-TE with an sCMOS-Sensor of type GSENSE 400BSI with 2048 × 2048 pixels of 11 × 11 µm² pixel size, thermoelectrically cooled down to –20°C. Quantum efficiency @310 nm greater than 45%. Max. quantum efficiency 95%. Frame rate @ full resolution max. 37 fps. Lens: LaVision UV-lens with 100 mm focal length and an aperture of 2.8. UV-Filter: 10 nm bandpass OD 4.0 UV filter with a central wavelength of 310 nm and 50 mm diameter (Edmund Optics #34-980). Note that two of these filters were placed in consecutive order to further suppress unwanted non-OH* signals from other wavelength ranges by effectively increasing the optical density from 4.0 to 8.0. Integration time: 100 ms (10 fps), camera gain: 300. The field of view of this camera–sensor–lens combination is 13° × 13° and the spatial resolution is 0.11 mrad (0.006°).
Both the MIR camera system and the UV system are not exactly cheap at 30 k€ each. However, it was important for this study to compare professional cameras with a similar price level. Of course, there are cheaper alternatives, but they are less suitable in terms of resolution (MIR) or signal-to-noise ratio (UV).
The dimensions of the hydrogen flame were measured with the UV camera system from a distance of 2.5 m (Figure 1, top right image). The detection tests of the hydrogen flame were carried out from a distance of 40 m with both the UV camera system and the IR camera system from the same location (Figure 1, bottom right image). On all measurement days, the sky was clear, and the sunlight fell directly on the pipes and the experimental setup.
The measurements were carried out in Braunschweig, Germany (52.3° North, 10.5° East). The outside temperature was +10°C. The exact date, time, and corresponding altitude of the sun are given in Table 1.
2.2 UV filter
Prior to the field measurements, various UV filters were considered for their suitability based on their data sheets. The requirements were: narrow bandpass width, which ideally should coincide with the OH* emission maximum around 310 nm, high transmission in this bandpass range, and strong suppression of the remaining wavelength range in which the camera is sensitive (200–1000 nm). Semrock does not offer suitable standard filters; the best filter has a bandwidth of 40 nm, which is too wide. Lavision has three OH filters in its range: standard, advanced, and chemiluminescence. The standard filter has a maximum transmission that is too low (20%), while the other two filters are much too wide (40 nm and 80 nm bandpass width). Edmund Optics offers two filters with a bandwidth of only 10 nm FWHM (full width at half maximum) and a center wavelength of 310 nm and 313 nm, respectively, with an optical density OD of more than 4.0 in the remaining wavelength range of 200–1200 nm. Based on the data sheet, the 310 nm filter from Edmund Optics (#34-980) appears to be the most suitable. This filter was picked for further testing.
The 310 nm filter was subjected to a spectroscopic test by measuring the flame spectrum of a hydrogen flame and a methane flame, both with and without the filter. Figure 2 shows the measurement setup. The spectrograph used was an Acton Research SpectraPro-300i in combination with a XIMEA prototype camera with a GSENSE400BSI sensor. Measurements were taken with both a 150 lines/mm grating and a 1200 lines/mm grating; the blaze wavelength of the grating was always 300 nm.
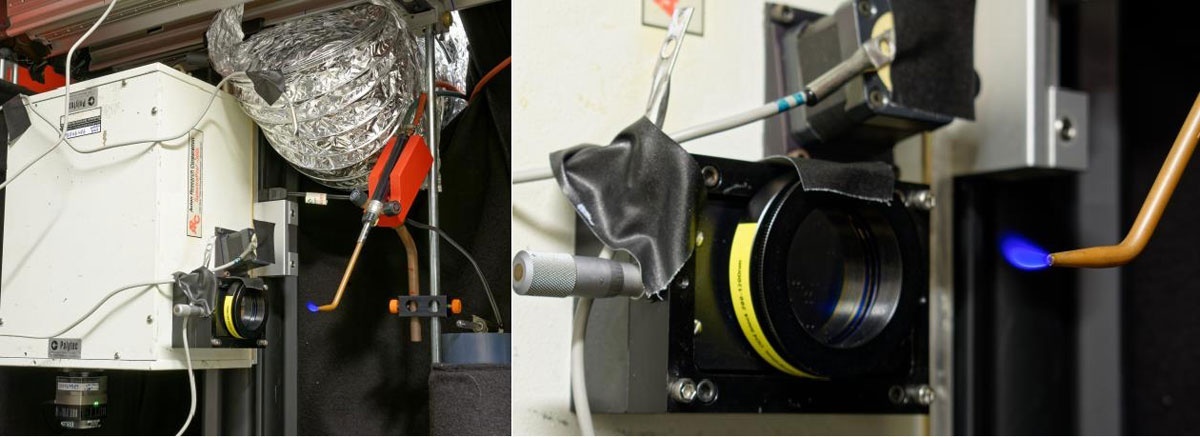
Figure 2
Spectroscopic setup with spectrometer, camera, filter, methane flame, and Hg-pencil wavelength calibration lamp. The large suction hose for the hot exhaust gases is visible above the flame. Four temperature sensors monitor the temperature at critical points; it should not exceed 50°C.
3. Data Reduction
The data reduction is based on the professional program ESO-MIDAS (2025), which is provided by the European Southern Observatory (ESO), the pre-eminent intergovernmental science and technology organization in astronomy. The ESO-MIDAS system comprises tools for professional image processing and data reduction, including imaging and spectroscopy reduction packages (Warmels, 1992).
3.1 Spectroscopy of UV filter
The data reduction of the spectroscopic measurements is already published (Brunzendorf, Höltkemeier-Horstmann and Markus, 2024), including the traceable intensity and wavelength calibration of the spectrometer. In brief: The spectrometer is calibrated in intensity using calibrated tungsten and deuterium calibration lamps and in wavelength using the mercury lines generated by the Newport Hg pencil. Dark frames (images taken with the same settings but without flame) are subtracted from the light frames.
3.2 Flame imaging
The data reduction of the UV images of the hydrogen flames was limited to the calculation of the mean and standard deviation images of up to 100 individual raw images, which were recorded consecutively one after the other for the respective flame. No dark frames were subtracted. Both the mean and standard deviation images were color-encoded by applying the ‘convert’ tool of the ImageMagick software package and a custom look-up-table optimized for our setup (Figure 4).
The MIR images in the IR camera were processed within the camera; there is no access to the raw data, only the color-encoded grayscale IR images are available. Therefore, no further image processing, like the UV image processing pipeline, was possible.
4. Results
4.1 UV filter
The filter effect of the 310 nm filter in relation to the spectra of hydrogen and methane flames is shown in Figure 3. Without the filter, the methane flame clearly shows the known individual emission bands of OH*, CH*, and C2* as well as the broad continuum. With a 310 nm filter, only the light in the OH* emission band is transmitted; all other spectral regions are blocked. The hydrogen flame only shows the OH* emission. The filter lets most of the emission through and only cuts off the edges. This is exactly the behavior expected of a narrowband filter of suitable central wavelength and half-width. Figure 3 (right) shows the filter effect in more detail. Note that the fine structure of the spectrum is real, not noise.
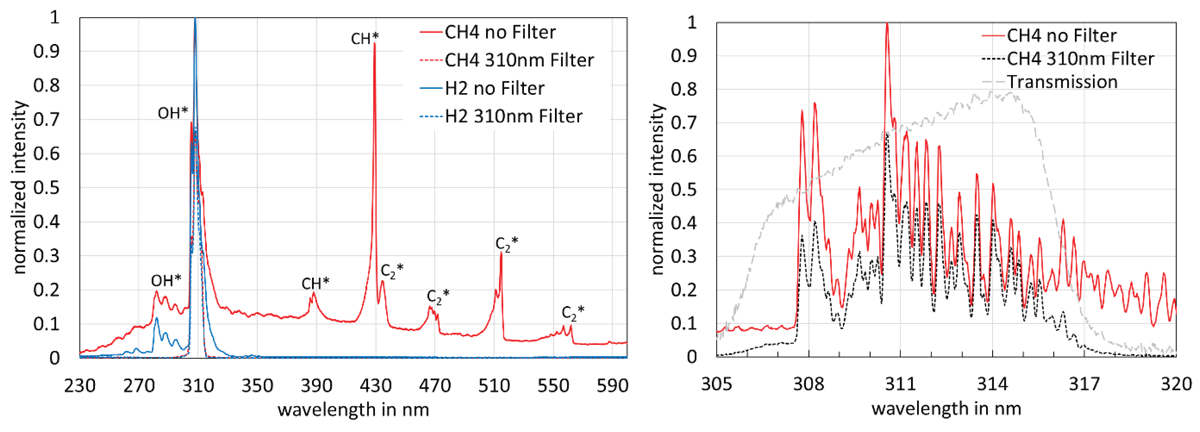
Figure 3
Measured spectrum of a methane flame (red) and a hydrogen flame (blue) without any filter (solid line) and behind the 310 nm filter (dotted line). Left: overall spectrum (150 l/mm grating), Right: detailed view (1200 l/mm grating). Dashed line: calculated filter transmission.
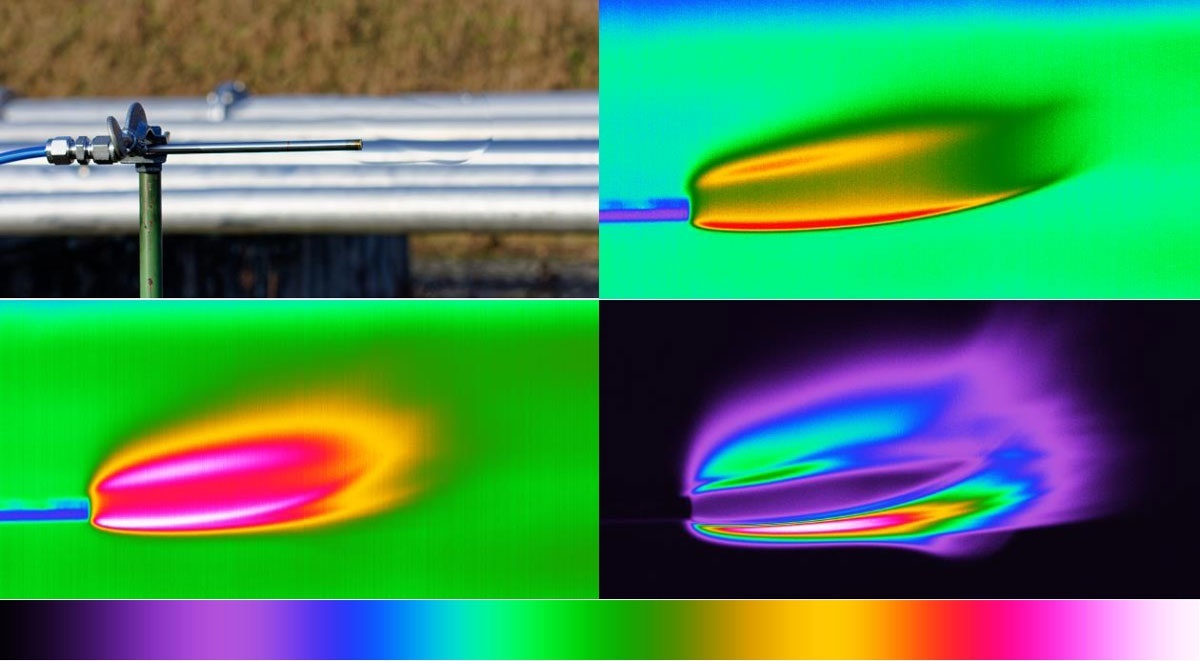
Figure 4
8 l/min hydrogen flame @ 2.5 m distance. Top: Visual image (left) and color-encoded UV image (right). Bottom: color-encoded average (left) and standard deviation (right) of 100 UV-images. Below the images, the custom look-up table for the conversion of intensities into colors is provided.
The spectral transmission of the filter can be calculated directly from the ratio of the measured intensities with and without the filter. In the passband of the filter, it is between 60% and 80%, which are very good values for a narrowband filter. In summary, it can be stated that the 310 nm Edmund Optics filter is very well suited for OH* emission measurements, both in terms of the position of the central wavelength as well as the width of the passband and transmission in the passband. The filter was therefore selected for the measurements in this study.
The transmission in the blocking wavelength range of the filter could not be measured precisely. The manufacturer specifies an optical density OD ≥ 4 in the blocking wavelength range of 200–1200 nm, i.e., only 1/10,000 of the intensity outside the pass band is transmitted. In view of the wide sensitivity range of the sCMOS sensor (200–1000 nm), its high quantum efficiency in the visible range, and the high intensity of solar radiation in the visible range, this value could be too low, at least for flame detection measurements in broad sunlight. For this reason, it was decided to carry out the 40 m flame-detection measurements with two identical 310 nm filters in series, so that the light must pass through both filters. This increases the blocking factor from OD 4 to OD 8 (only 1/108 of the intensity outside the pass band is transmitted), while approx. 50% of the light inside the pass band is still transmitted. As there was no suitable filter holder that could accommodate both filters, they were provisionally combined with adhesive tape (Figure 1, bottom left).
4.2 Flames
Figure 4 shows sample images of the flame length measurements for an 8 l/min hydrogen flame captured at 2.5 m distance. The visual impression can be seen in the top left image, which was taken with a Nikon camera: The flame causes schlieren, which are the main indicator of the burning hydrogen flame. The flame itself is invisible. The UV images (the remaining three images) were captured through one 310 nm filter. The image at the top right displays a single raw image of the 8 l/min flame; the images in the bottom row show the average image (left) and the standard deviation (right) of 100 raw images. All UV images (which are grayscale images) are color-encoded for better visualization using a custom look-up table, which is given in Figure 4 below the images (colors from left to right encode intensities from minimum to maximum). The flame lengths for a given hydrogen flow rate are determined by visual inspection of the mean and standard deviation images. This length directly determines the respective angular dimension of the flame, i.e., the angle at which the flame is seen from a distance of 40 m. The results are listed in Table 2. The uncertainties are estimated to be a few millimetres due to the blurred flame edges. However, the measured flame dimensions are mainly intended to give a more accurate idea of the flame sizes when observed from a distance of 40 m. In essence, at this distance, the angular size of the flames is the same as the angular size of the major craters and mare on the moon.
Table 2
Hydrogen flow rate and resulting flame dimensions.
| HYDROGEN FLOW RATE IN L/MIN | FLAME LENGTH IN CM | MAX. FLAME WIDTH IN CM | ANGULAR DIMENSIONS @ 40 M DISTANCE |
|---|---|---|---|
| 2 | 1.7 | 1.8 | 0.024° × 0.026° |
| 4 | 3.5 | 3.1 | 0.050° × 0.044° |
| 8 | 7.9 | 3.3 | 0.11° × 0.047° |
| 15 | 16.9 | 2.8 | 0.24° × 0.040° |
| 30 | 16.3 | 4.6 | 0.23° × 0.067° |
| 50 | 24.7 | 7.0 | 0.35° × 0.10° |
| 100 | 26.5 | 7.5 | 0.38° × 0.11° |
The main measurements of the present work are the flame detection measurements from a distance of 40 m, which were carried out with both the UV camera and the MIR camera from the same observation point. Figure 5 shows examples of typical images in the visual, MIR, and UV taken from this point for the hydrogen flame at a flow rate of 8 l/min. The position of the flame is indicated by a black box. Both the MIR image and the UV images are displayed as a full image without cropping, i.e., the resolution is 640 × 480 pixels in the MIR and 2048 × 2048 pixels in the UV. The 8 l/min hydrogen flame is clearly visible in the MIR (white spot in the top right image), but barely visible in the mean UV image (bottom left image)—here the various UV reflections on the pipes from direct sunlight almost outshine the OH* flame signal despite the twin 310 nm filters. However, the flame is very clearly recognizable on the UV standard deviation image (bottom right image). Note that the ambient conditions are favorable for MIR measurements: cool outside temperature (+10°C), no heat sources, no incandescent lights, whereas direct sunlight is unfavorable for UV measurements. The results are similar for the other flames.
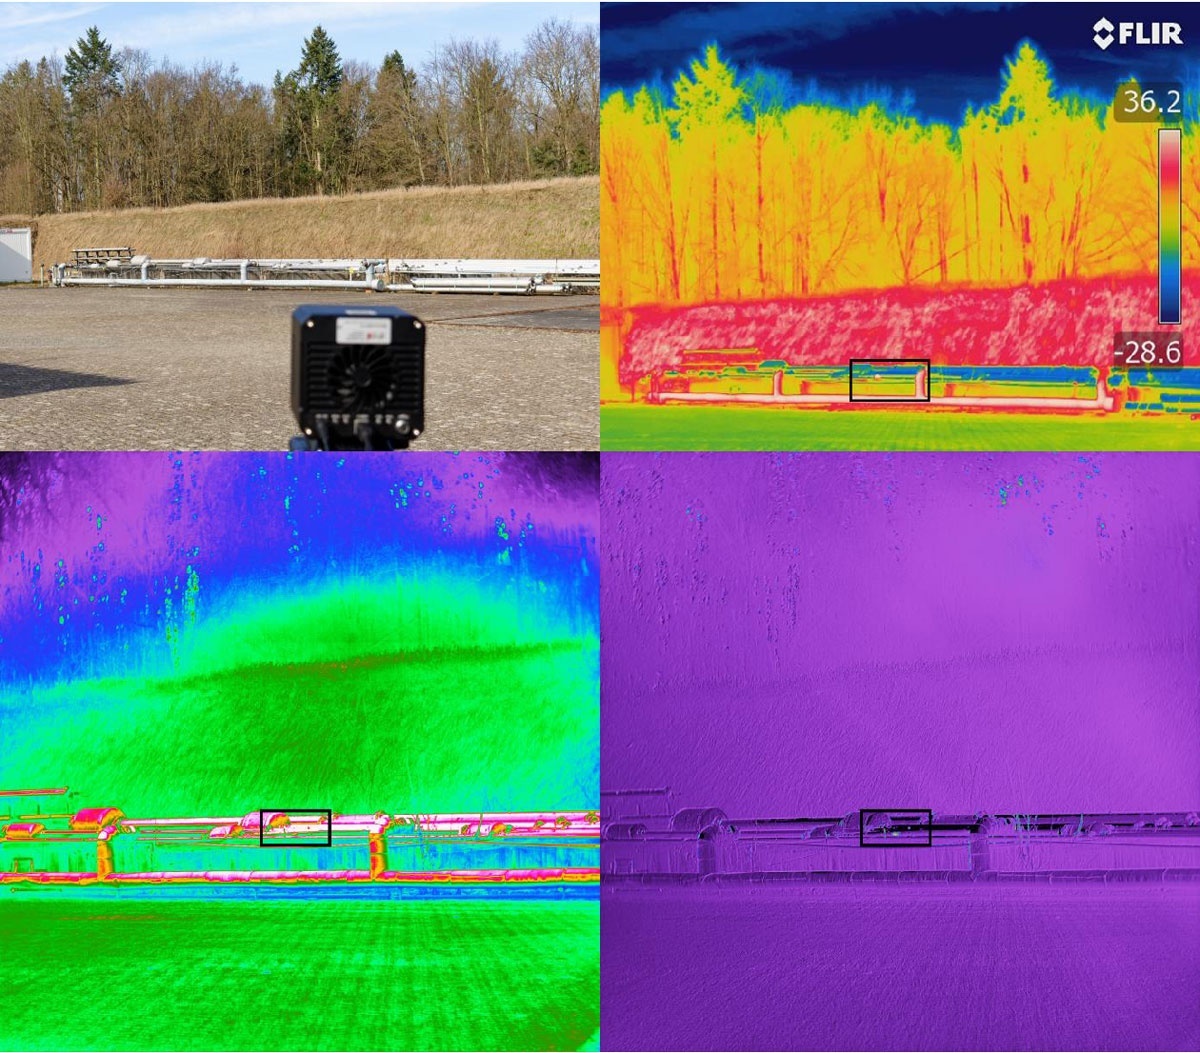
Figure 5
8 l/min hydrogen flame @ 40 m distance. Top: Visual view from observation point (left), MIR image (right) with indication of flame (black box). Bottom: color-encoded average image (left) and standard deviation image (right) of 100 UV-images with indication of flame (black boxes). Enlarged views of the black sections are shown in Figure 6.
The MIR and UV images of the various hydrogen flames (2/4/8/15/30/50/100 l/min hydrogen) are discussed in more detail in Figure 6. Only the image sections in the black boxes in Figure 5 are shown here for further discussion. The other image areas do not change significantly when the flame changes. However, the entire image was always evaluated. The flames can be recognized in all pictures, although the examination of the UV standard deviation images appears to be a more promising detection method than that of the averaged UV image. The flames can also be seen on the MIR images, despite the rather limited resolution of the camera.
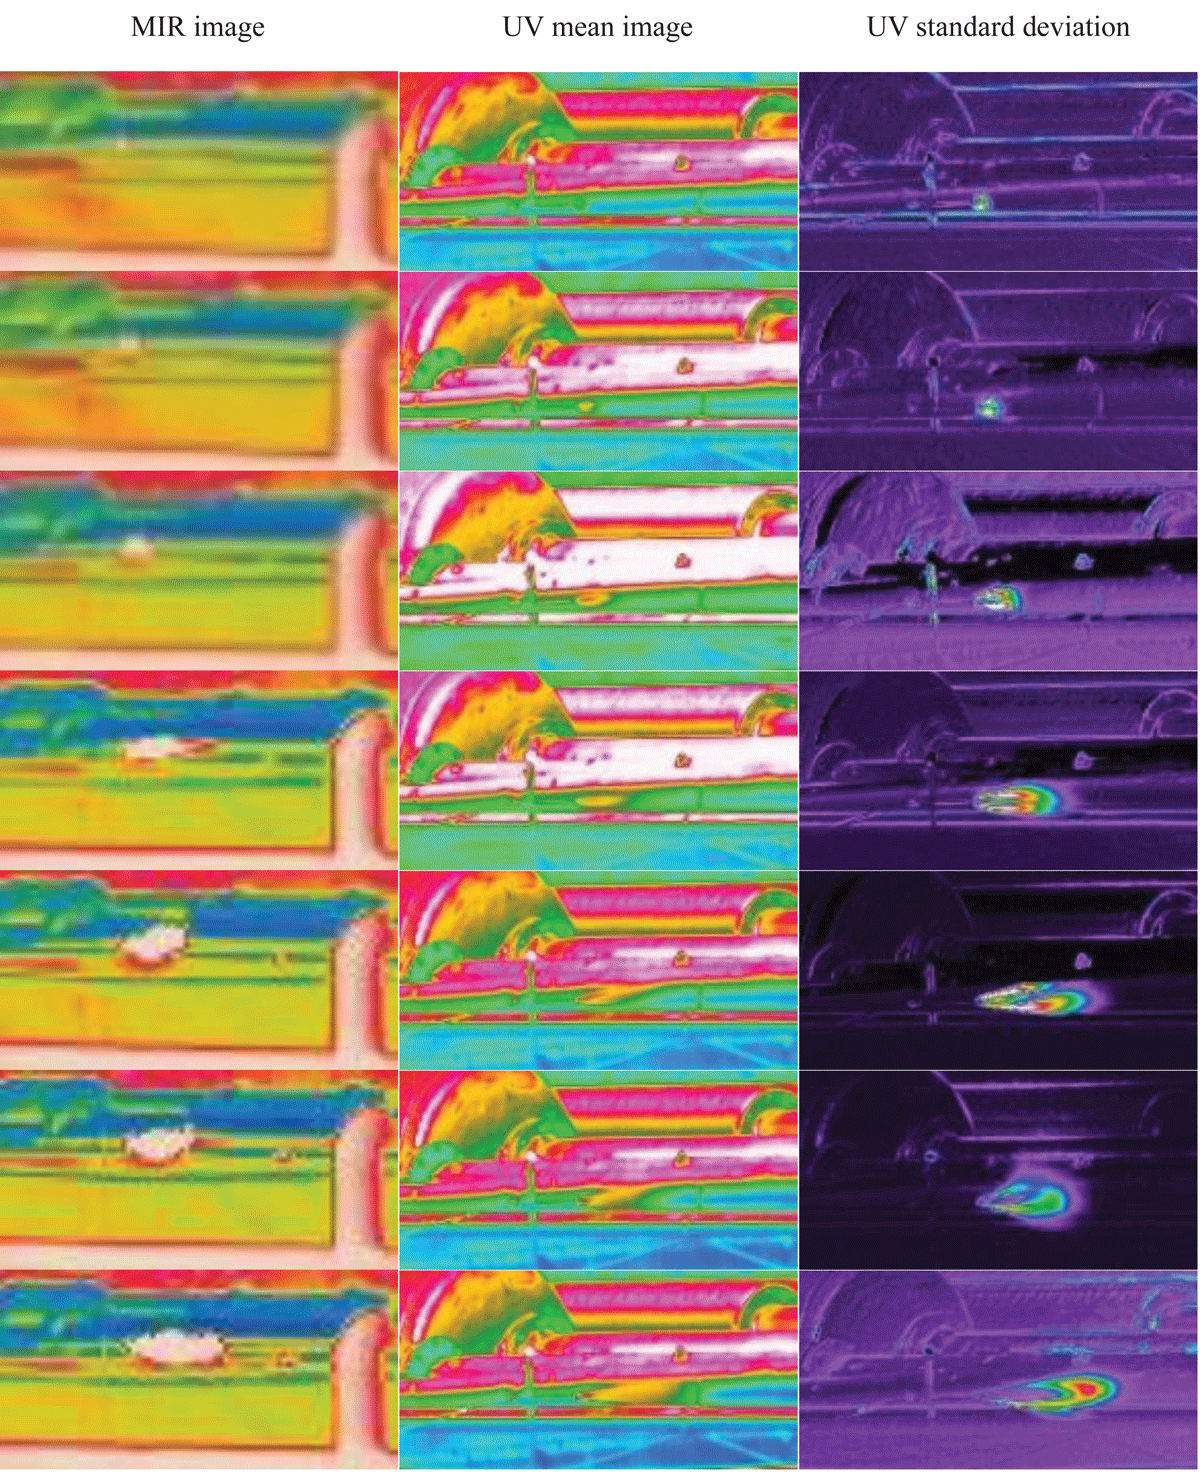
Figure 6
Enlarged views of the flames (black box sections in Figure 5). Top to Bottom: H2 flame 2/4/8/15/30/50/100 l/min. Left to right: MIR image, mean UV image, UV standard deviation.
The grayscale UV images of the mean value and standard deviation were also analyzed with regard to the possibility of automatic flame detection. For this purpose, the images were evaluated using automatic detection software. The software SExtractor (Bertin and Arnouts, 1996) was used, which was originally developed for the detection of galaxies, but can also recognize other objects with nonsymmetrical structures and diffuse boundaries. All flames could be detected on both the mean value image and the standard deviation image, with the standard deviation image providing much more significant evidence and fewer other objects.
In summary, both MIR and UV detection methods can reliably identify small hydrogen flames. The UV measurements provide the best results in the absence of bright sunlight, while MIR detection works best in the absence of heat sources and incandescent lamps. Consequently, both methods have their advantages and justification depending on the position of the sun and the nature of the plant installations to be inspected.
5. Conclusions
Small hydrogen flames can be detected from a great distance in the UV and MIR. In this study, hydrogen flames with a diameter of less than 2 cm could be reliably detected under realistic outdoor conditions in direct sunlight from a distance of 40 m in both MIR and UV light. The MIR measurements are based on the heat emission of the flame, while the UV measurements are based on the OH* chemiluminescence emission of the flame at 310 nm. A FLIR T640 camera was used for the MIR and a separate camera system with a 310 nm filter for the UV. The correct choice of filter was verified by spectroscopic OH* chemiluminescence measurements. Depending on the ambient conditions, one or the other method may be more sensitive (direct sunlight affects the UV measurement, while heat sources and incandescent lamps hamper the MIR measurement). Looking at the standard deviation of several images can further increase sensitivity. Both systems can be mounted on commercial drones for regular automated inspections. Its implementation would be a separate project that is not the subject of this paper.
Data Accessibility Statement
All data can be obtained from the author upon request.
Competing Interests
The author has no competing interests to declare.