
1.0 Introduction
Predicting the size, velocity, and flying distance of fragments generated by a hydrogen tank burst is crucial for safe use and handling of hydrogen for several reasons. First, hydrogen tanks can burst due to excessive pressure, structural failure, or impacts. The resulting fragments can pose significant hazards. Understanding the potential size, velocity, and flying distance of these fragments is essential for assessing the overall hazard and risk. Second, by predicting the distance that fragments might travel, you can establish safe exclusion zones around hydrogen storage and handling areas. This ensures that people and critical infrastructure are not within the potential impact zone. Third, knowing the size and velocity of potential fragments helps in designing appropriate protections. While the effects of fragments have been extensively studied in military defense and pressure vessels in industry, the specific application to hydrogen infrastructure and safety has received relatively less attention.
In the early 2000s, in the experiments performed during the SecutecH2 project (López et al., 2015), a small nine litre type III tank was used for burst tests with a circumferential cutting charge. However, only the velocity of fragments was reported. Later, Zalosh and Weyandt (2005, 2007) reported two tests on type III and IV tanks engulfed in a fire. These tests as well as the ones performed by Tamura et al. (2006) have been extensively used and discussed in different publications of Ulster University (Makarov et al., 2021). Detailed information is also provided regarding the characteristics of fragments and their flying distance.
In their publication, Shen et al. (2018) pointed out that most of the tests related to catastrophic rupture of hydrogen high-pressure tanks focused on blast waves and thermal radiation while only few of them investigated flying debris. For their debris analysis following rupture of type III tanks in a fire, they assumed a simplified trajectory model solving these two equations for the horizontal and vertical distance (x,y) with drag and gravity forces:
with t time, g gravity, n = 2 ascending phase and n = 1 descending phase, kv = ρ∞.CD.AD/2M with AD cross-section area of the tank, M the mass of the fragment, r∞ the density of the surrounding air and the drag coefficient CD~0.8–1.4. They concluded that theoretical models agreed quite well with their experimental data. Makarov et al. (2021) mentioned that these experimental results are affected by partial release of hydrogen from one end-cap during tank failure.
Recently, Wang et al. (2023) have conducted two fire-bursting tests of small type III 6.8 litre CGH2 tanks. They provide information on fragment mass and flying distance and state that the wind shield installed for the tests has probably affected the flying distances. Park and Kim (2023) reported on type IV bursting tests in fires affecting one tank of a vehicle. They reported some details of fragments including mass and flying distance. In this test, a protective wall was installed close to the vehicle. Finally, SANDIA national labs have performed two catastrophic ruptures of CGH2 tanks (Brooks and Glover, 2022) but no information was provided regarding fragments.
Regarding LH2 tanks, in the late 90s, Pehr (1996) reported an important testing activity regarding liquid hydrogen tanks for light vehicle mobility. Some tests were dedicated to the burst of LH2 tanks with a circumferential cutting charge. Only limited information was reported about the fragments. If the initial pressure was below the critical pressure (12.96 bar), two main fragments resulting from the cutting charge were observed. However, initial pressure above the critical pressure led to a large number of fragments, with some of them flying more than 15 meters away. Recently, additional tests were performed with liquid hydrogen tanks in a fire resulting in BLEVE phenomena at BAM during the SH2IFT project. Collina et al. (2023) reported some analysis of the fragments behaviour during these tests. They also provide two methodologies to compute the flying distance of fragments knowing their initial velocity Vi. Neglecting the air resistance, this distance R is simply related to the inclination angle q and initial velocity Vi by:
Considering the drag and lift forces acting on the fragments results in more complicated equations. Baker (1983) used a computational model and produced parametric curves based on the lift-to-drag ratio, expressed with abscissas and ordinates using non-dimensional velocity and distance based on a fragment’s mass, shape and dimensions.
The initial velocity depends on the energy involved in the explosion and the amount of this energy that is transferred into kinetic energy of the fragment’s Ec:
Consequently, this velocity depends on the part of the internal energy Ei contained initially in the tank that is transferred to each fragment. Molkov (Molkov and Kashkarov, 2015) has mentioned several times that non-ideal equations of state are required to accurately estimate Ei for CGH2 tanks. Estimating Ec is then a challenging issue because the energy balance entails different terms:
where ERT corresponds to the energy consumed by the rupture of the tank and ESW the energy transmitted to pressure waves. In our cases, the cutting charge or the fire gives the former and Ec is often considered as a certain amount of Ei. Baum (1995) considered that this amount is 20% for a cylindrical pressure vessel bursting filled with gas. Shen et al. (2018) adopted 5% based on previous review of accidents. This last value is also considered the most probable in Hauptmanns’ (2001) studies, for example. These large differences demonstrate that some additional measurements relevant for our situations may enhance our predictive capabilities.
Finally, in the paper of Collina et al. (2023), the comparison between experimental results and theory was not provided. The different tests in which bursting of hydrogen storage tanks were conducted are reported in Table 1 and the information related to fragments are outlined in Table 2.
Table 1
Experiments available about hydrogen tank bursts in the open literature.
| N° | H2 STATE | TANK TYPE | TANK VOLUME (Liter) | TANK POSITION | TANK SIZE L/D (m) | TANK INITIAL PRESSURE (MPa) | TANK BURST PRESSURE (MPa) | TANK BURST TEMPERATURE (K) | BURSTING METHOD | REF. |
|---|---|---|---|---|---|---|---|---|---|---|
| 1 | LH2 | LH2 | 120 | H | 0.722/0.46 | 0.5 to 1.48 | 0.5 to 1.48 | 20 | Cutting charge | (Pehr, 1996) |
| 2 | GH2 | IV III | 72.4 88 | H under a SUV | 0.84/0.41 | 34.3 31.8 | 35.7 | 312.15 | Fire | (Weyandt, 2005); (Weyandt, 2007) |
| 3 | GH2 | IV | 35 | H | N.P.* | 70 | 94.54 | 379.8 | Fire | (Molkov et al., 2021) |
| 3–1 | GH2 | III | 36 | H | N.P. | 70 | 99.47 | 394.2 | Fire | (Molkov et al., 2021) |
| 4 | GH2 | III | 9 | H | N.P. | 70 | 70 | N.P. | Cutting charge | (López et al., 2015) |
| 5 | GH2 | IV | V corresponding to 2.1 kg of CGH2 | In a vehicle | N.P. | 70 | N.P. | N.P. | Fire | (Park and Kim, 2023) |
| 6 | GH2 | III | 165 | N.P. | 1.775/0.37 | 35 | 43.8 to 44 | N.P. | Fire | (Shen et al., 2018) |
| 7 | GH2 | III | 6.8 | V | 0.52/0.157 | 30.6/31.0 | 49.7 ± 3.3 | N.P. | Fire | (Wang et al., 2023) |
| 8 | LH2 | LH2 (MLI) | 1000 (filling 35–40% – 27 kg of LH2) | H | N.P. | 0.4 | 5 | 26.2–32.4 (estimated) | Fire | (van Wingerden et al., 2022) |
| 9 | GH2 | IV | 580 | H | 2.06/0.686 | 25 | 25 | 288.15 | projectile | (Brooks and Glover, 2022) |
[i] *N.P. not provided.
Table 2
Characteristics of fragments collected after hydrogen tank bursts in the open literature.
| N° | NUMBER OF FRAGMENTS | MASS (kg) /VELOCITY (m/s) | MAXIMUM FLYING DISTANCE (m) | REF. |
|---|---|---|---|---|
| 1 | From 2 to a large number | N.P.* | 15 in case of large number of fragments | (Pehr, 1996) |
| 2 | 4 main (61% of 32 kg) At least 2 (Test2) | 14, 2, 2, 1.6/N.P. Large tank SUV parts | 82, 49, 33.6, 41 107 | (Weyandt, 2005); (Weyandt, 2007) |
| 4 | 2 | N.P./100 | N.P. | (López et al., 2015) |
| 5 | At least 1 | 2.1 | 74 | (Park and Kim, 2023) |
| 6 | At least 3 (test1) | 79 (Test1)/N.P. | Test 1: 32.5 (hitting a truck) Test 2: 200 | (Shen et al., 2018) |
| 7 | 9 (test1), 7 (test2) | 0.214 to 0.013 (test1), 2.9 to 0.92 (test2)/N.P. | 19.5 (0.214 kg) to 46 (test1) 15.4 (2.9 kg) to 41.7 (0.304 kg) | (Wang et al., 2023) |
| 8 | 53 (6 > 60 kg) | 261, 124, 76, 72, 65, 61/N.P. | 30, 6, 67, 167, 124, 10 after collision with a wall | (Collina et al., 2023) |
[i] *N.P. not provided.
When a CGH2 tank bursts, two types of fragments are distinguished: primary fragments, which originate directly from the tank and are characterized by their number, mass, shape, speed, and trajectory, and secondary fragments, which are propelled by the pressure wave. This article focuses solely on primary fragments. The effects of these fragments on humans and structures are assessed in terms of shock, which can cause skull fractures and structural deformations as well as penetration. For smaller fragments (with a mass below 1 kg), kinetic energy is typically used as a reference metric. In contrast, for heavier fragments, impact velocity is a more relevant characteristic for estimating potential effects.
The availability of experimental results on fragments generated by hydrogen tank bursts is somewhat limited compared to other fields like military and defense research. Existing data often comes from small-scale tests and historical incidents, which may not fully capture real-world conditions. Much of the current understanding is extrapolated from other fields, highlighting the need for hydrogen-specific research. SID-EPN and CEA have recently performed tests regarding catastrophic rupture of CGH2 tanks in different projects covering confined and unconfined situations. These tests can provide additional results to strengthen the definition of exclusion zones. Consequently, the objectives of this article are twofold: first, to describe the new experimental results, and second, to compare them with theoretical values and previous results from the literature . Conclusions follow.
2.0 Test Conditions
2.1 Velocity of fragments in tunnel tests
During the Hytunnel-CS project in 2020 and 2021, CEA conducted full-scale tests simulating the catastrophic rupture of CGH2 tanks. In these tests, the reservoir was ruptured using a cutting charge to create highly reproducible rupture conditions. Within the tunnel, blast wave sensors (PCB 137B24 and 137B26) and a high-speed camera (Phantom VEO 370) were employed to monitor the attenuation of pressure waves, the development of fireballs, and the trajectory of fragments from the ruptured tank. The first two aspects have been detailed by Kudriakov et al. (2022) while this article focuses on the trajectory of the fragments. The test conditions and the position of the cutting charge are outlined in Table 3. Three types of tanks were tested with internal pressure varying from 4.1 to 61.0 MPa.
Table 3
Test conditions for the fragments analysis in Hytunnel-CS tests.
| TEST N° | Pg(MPa) GAS | TYPE | V (liter) | WEIGHT (kg) | L/D (M) | CUTTING CHARGE LOCATION (m) FROM LEFT END | PHOTO |
|---|---|---|---|---|---|---|---|
| 31 | 4.1 (0.5 He, 3.6 H2) | III | 150 | 70 | 1.53/0.41 | 0.765 | 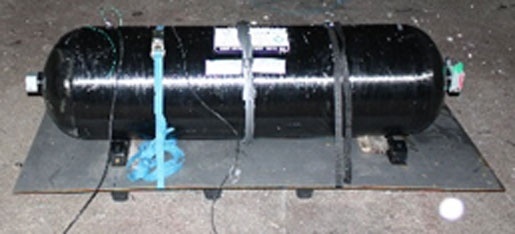 |
| 32 | 9.0 H2 | IV | 78 | 64.6 | 0.96/0.44 | 0.48 | 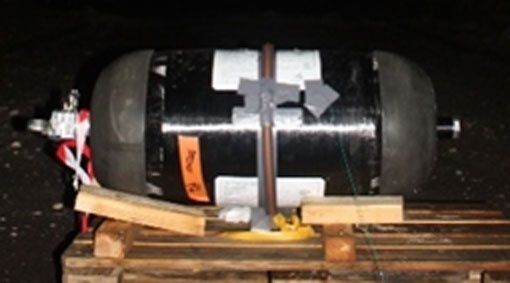 |
| 36 | 33.2 H2 | III | 150 | 73.6 | 1.53/0.41 | 0.3 | 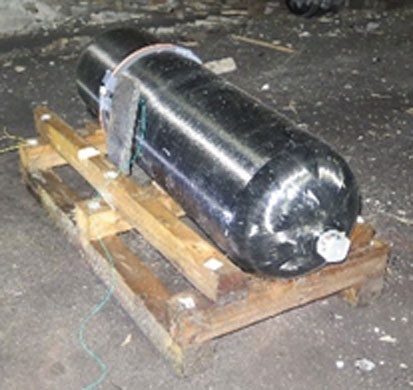 |
| 37 | 52.0 H2 | IV | 78 | 64.6 | 0.96/0.44 | 0.32 | Same as test 32 |
| 38 | 61.0 H2 | IV | 78 | 64.6 | 0.96/0.44 | 0.32 | Same as test 32 |
| 42 | 19.4 H2 | I | 50 | 60.5 | 1.45/0.25 | 0.5 | 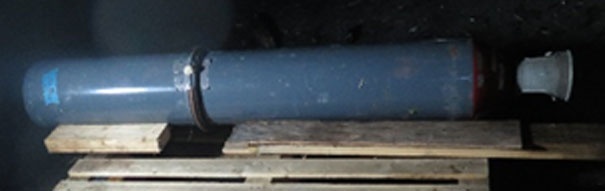 |
The images captured by the high-speed camera were post-processed to track the position of the fragments over time, using the position of the cutting charge as the origin. Initially, the rapidly developing fireball often obscures fragments, but they become visible after some time, as illustrated in Figure 1. This data allows us to determine the speed of the fragments as a function of distance assuming no parallax error. However, these tests do not provide additional information beyond this point, as the tunnel’s sidewalls stopped or deviated the fragments.
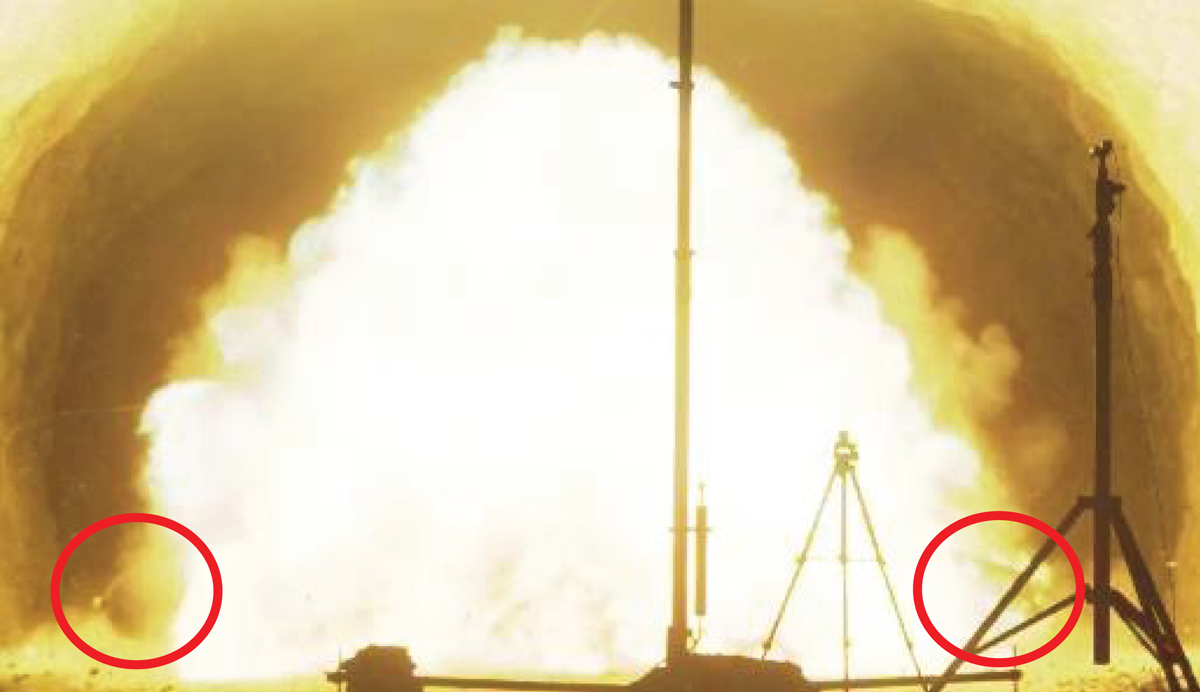
Figure 1
Test 31 – Fragments emerging from the fireball.
2.2 Behaviour of fragments during tests in open atmosphere
In 2024, SID-EPN and CEA have jointly participated in field tests dealing with catastrophic rupture of type IV hydrogen tanks. Two tests were performed: test6 with a single type IV tank and test4 with a group of six interconnected type IV tanks arranged in a rack (Table 4). For the tank alone, the rupture is initiated with a high-explosive charge located in the center. For the rack, an 81 mm mortar ammunition is located at the center in the lower part and a high-explosive charge is added between two tanks in the upper part. Only the high-explosive charge has initiated a full-rupture of two neighboring upper tanks. The tanks were filled with hydrogen at a pressure close to 53 MPa. Concrete blocks were installed to reduce the shrapnel effect of mortar fragments in the direction opposite to the tanks.
Table 4
Test conditions for the fragments analysis in open atmosphere.
| TEST N° | Pg(MPa) | TYPE | V (liter) | WEIGHT EMPTY (kg) | L/D (m) | CUTTING CHARGE LOCATION | PHOTO |
|---|---|---|---|---|---|---|---|
| 4 | 52 to 54 | IV | 240 | 219 | 2.575/0.48 | Between two tanks | 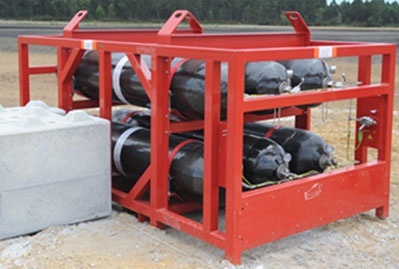 |
| 6 | 53 | IV | 240 | 219 | 2.575/0.48 | Centered | 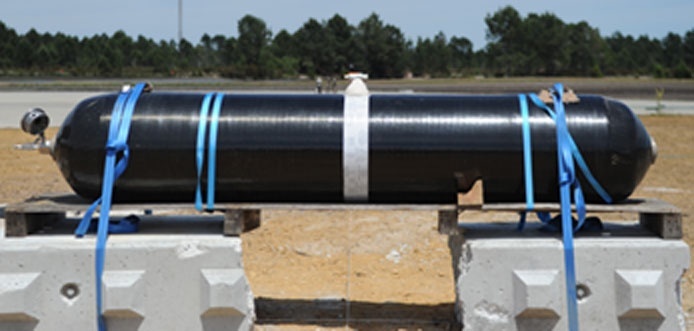 |
In addition to blast wave sensors and radiometers, five high-speed cameras and six video surveillance cameras were deployed to monitor the main phenomena (fireballs, fragments, etc.). The locations of those cameras are reported in Figure 2.
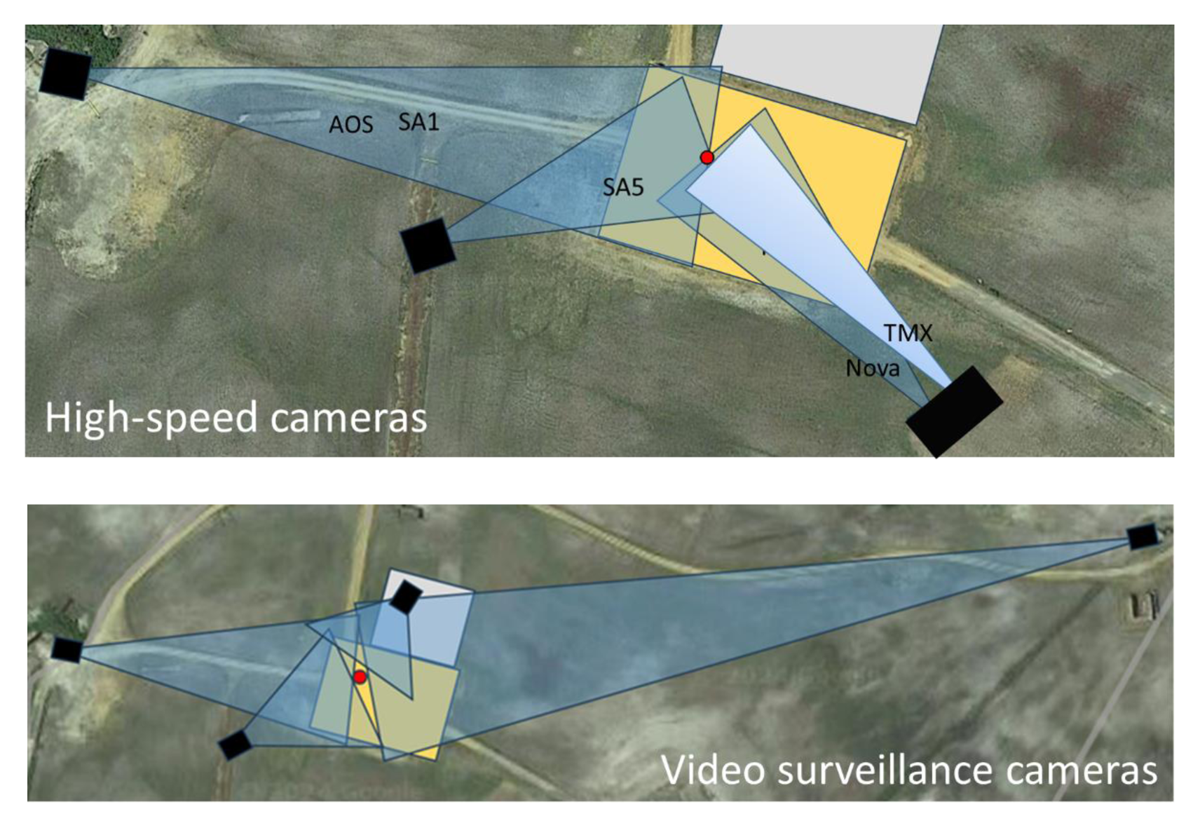
Figure 2
Arrangement of cameras in the test site.
The catastrophic rupture of the tanks produced a wide array of fragments varying in size and shape. These fragments included complete tanks, large and small tank parts, steel rack components, thermal pressure relief devices (TPRDs), valves, pressure gauges, gas circuit parts, and carbon fibers. Following the two tests, the most significant fragments were catalogued along with their distances from the point of origin.
3.0 Results
3.1 Velocity of fragments in tunnel geometry
We have studied the velocity of the two fragments of the tank during the different tests. This velocity is almost constant during the recorded periods because the field-of-view was very close to the center of the cutting charge (e.g. less than about 5 meters) and the fragments were hidden by the fireball at the early phase of their flight. The reported uncertainty has been estimated by calculating the 95% confidence interval on the slope estimate of the distance versus time. The mass m of compressed gas is computed according to the Abel-Noble equation-of-state by:
with V the volume of the tank, b the co-volume of the compressed gas, R the gas constant, Tg the gas temperature inside the tank and Mg the associated molecular mass.
Internal energy contained in the tank before rupture is computed based on the same real gas equation-of-state according to the equation (8) proposed by Molkov and Kashkarov (2015):
with γg the isentropic coefficient of the compressed gas and P∞ the ambient pressure.
Estimation of initial velocity (labelled ‘Vi1’ in Table 5) of each fragment is first given based on 5% of the internal energy converted into kinetic energy of each fragment (the most probable value in probabilistic analyses). When the two fragments are identical, the kinetic energy is distributed equally between them. When the masses differ, Hauptmanns (2001) distributes this energy by a weighting according to the masses power 3/2 based on momentum balance originally proposed by Baum (1995). We have adopted the same strategy in our estimation of Vi1. Baker (1983) has also proposed a method to compute the initial velocity (‘Vi2’ in Table 5) of bursting of a cylindrical vessel into two unequal fragments. Baker (1975) mentions that his diagrams are only valid for cylindrical tanks with L/D aspect ratios of the order of 10. In our tests, this was 2.2 for Type IV, 3.7 for Type III and 5.8 for Type I. Consequently, these estimates should be treated with caution.
Table 5
Results for the fragments velocity in tunnel geometry.
| TEST N° | MASS OF GAS M (kg) | Ei (MJ) | Estimated mass of fragment M (kg) | F | Θ | MEASURED INITIAL VELOCITY Vi (m/s) | EXP. FRACTION OF THE INTERNAL ENERGY (%) | THEORETICAL VELOCITY Vi (m/s) | ||
|---|---|---|---|---|---|---|---|---|---|---|
| VI1 | VI2 | VI3 | ||||||||
| 31 | 0.452 (H2) 0.127 (He) | 1.40 | Left: 35.0 | 0.014 | 1.14 | 31.9 ± 0.1 | 1.3 | 45 | 24 | 48 |
| Right: 35.0 | 29.0 ± 0.5 | 1.0 | 45 | 24 | 48 | |||||
| 32 | 0.568 (H2) | 1.67 | Left: 32.3 | 0.041 | 1.13 | 71.2 ± 1.8 | 4.9 | 51 | 28 | 63 |
| Right: 32.3 | 93.5 ± 6.0 | 8.5 | 51 | 28 | 63 | |||||
| 36 | 3.500 (H2) | 10.42 | Right: 59.2 | 0.107 | 0.41 | 102.2 ± 0.4 | 3.0 | 122 | 158 | 136 |
| 37 | 2.587 (H2) | 7.72 | Left: 21.5 | 0.237 | 0.47 | 179.1 ± 9.9 | 4.5 | 97 | 82 | 173 |
| Right: 43.1 | 127.6 ± 0.5 | 4.5 | 115 | 123 | 152 | |||||
| 38 | 2.907 (H2) | 8.68 | Left: 21.5 | 0.278 | 0.44 | 261.3 ± 17.4 | 8.5 | 103 | 102 | 186 |
| Right: 43.1 | 124.2 ± 0.2 | 3.8 | 122 | 153 | 164 | |||||
| 42 | 0.737 (H2) | 2.19 | Right: 38.9 | 0.017 | 0.66 | 28.1 ± 5.1 | 0.7 | 63 | 46 | 45 |
Our case concerns a tank cut into two fragments by a circumferential explosive charge which may be of unequal mass. In this case, as Baum (1991) explains, there are several situations. If the breach develops rapidly, a rarefaction wave will travel from the breach to the closed ends, then reflect and weaken the pressure. This is the case when the initial acceleration is low. If the initial acceleration is high, another rarefaction wave travels from the closed end towards the breach, canceling out the effect of the previous wave. If the breach develops slowly, and the acceleration is low, the pressure remains virtually uniform as the vessel speeds up. Baum (1995) separates the constant pressure and wave-driven pressure regimes by a dimensionless parameter Q involving a dimensionless acceleration F (cg refers to the sound speed in the vessel).
The threshold values are Q < 2 for the wave-driven regime and Q > 6.5 for the constant-pressure regime, with a transition between the two. This analysis is similar to that carried out previously by Gel’fand et al. (1988) where the constant pressure domain was identified for Q > 4.
To conclude on the issue, Baker (1978) fully described the model with two fragments of unequal masses, assuming a perfect gas equation of state. This model (‘Vi3’ in Table 5) has been programmed and validated on the Cain (1996) and Herzog (1981) rupture tests of air pressurized cylindrical vessels. With the original model, only cases with fragments of similar size could be reproduced. We therefore added the suggestions of Manning et al. (2017) to the model, mainly the fact that the fragments are subjected to a pressure difference attenuated by a compression wave on the outer side and an expansion wave on the inner side. With this addition, the model correctly reproduces most of the simulated tests (Figure 3 ±15%) except for the two Herzog tests at lower initial pressure (2.5 MPa and constrained movement of part of the vessel) and one Cain test, which already showed an overestimation of the predicted velocity in the original publication.
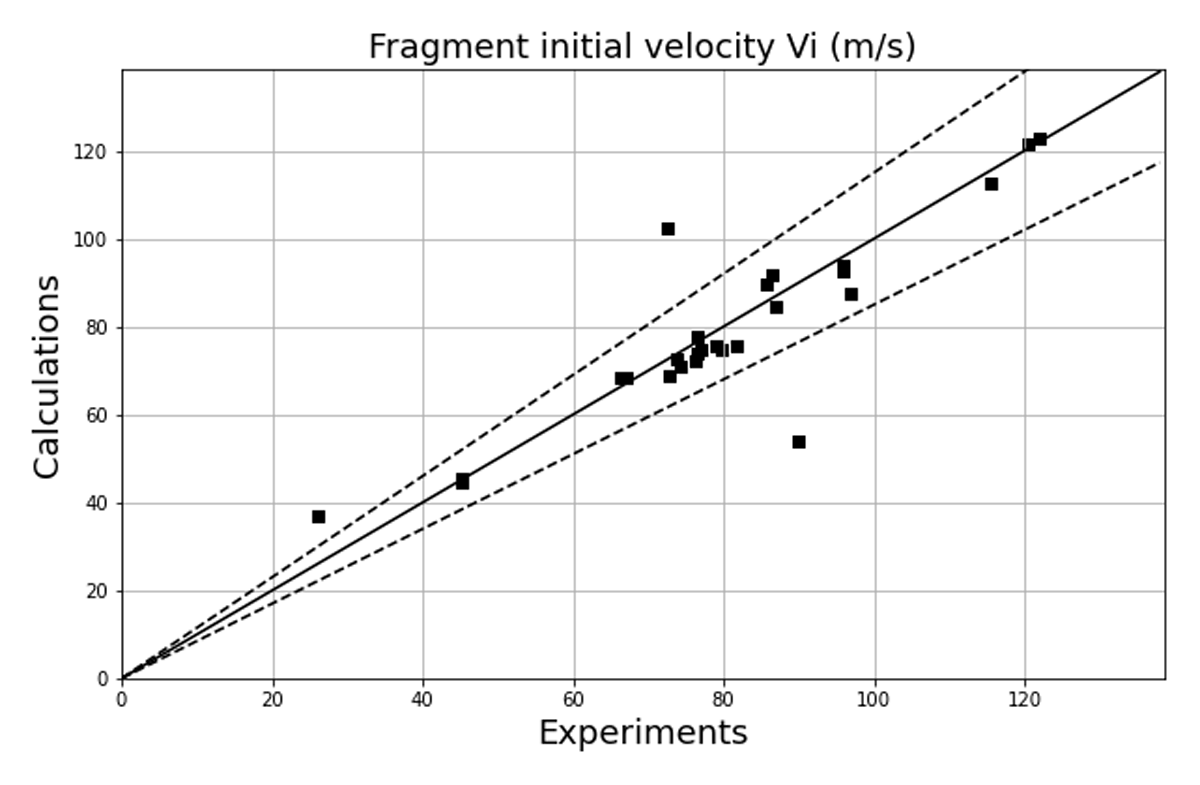
Figure 3
Computed versus measured initial velocities of air pressure vessel burst fragments.
Comparison of our experimental results and the different theoretical estimations of the initial velocity of fragments is outlined in Table 5. In our case, the Q values indicate that wave propagation in the expanding gas mixture plays an important role. Experimental results show that the fractions of internal energy transformed into kinetic energy for the fragments are highly variable, i.e. from 0.7 to 8.5%, which makes the use of a 5% value not very predictive for obtaining fragment velocity (‘Vi1’). Predictions from Baker’s curves are not very predictive either (‘Vi2’), but as we already pointed out, the L/D~10 hypothesis is not valid in our case. Moreover, they do not account for the higher velocity of smaller fragments. Baker’s model for unequal fragments with Manning’s additions gives initial velocities (‘Vi3’) of ±30%, with better agreement compared to the others when fragments are of distinct masses.
Finally, for test 42, the difference between experiment and theory in fragment velocity can be explained by the fact that the fragment is strongly off-axis when it emerges from the fireball (partly vertical).
3.2 Fragments in open atmosphere
Examples of fragments emitted during test 4 are shown in Figure 4. The end-cap of one of the two tanks on which the explosive charge had been placed can be seen, as well as a piece of the rack frame and even an undamaged tank, which is thrown off.
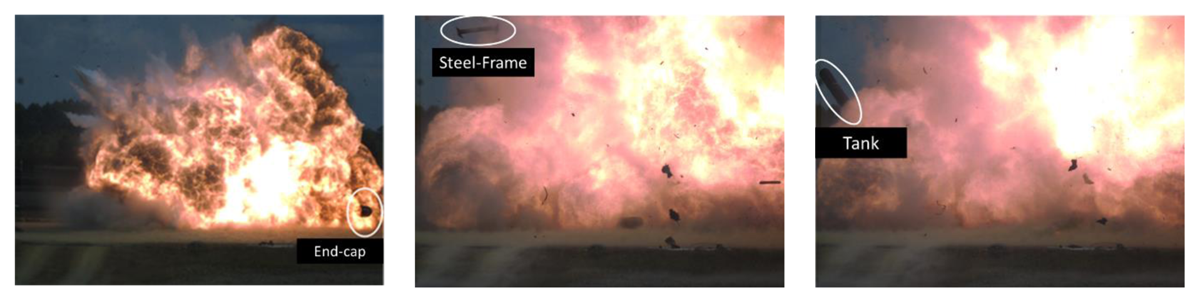
Figure 4
Test 4 – Fragments emerging from the fireball.
Pictures of the test pad after the ruptures are provided in Figure 5. The spreading of large fragments is clearly higher in test 4 than in test 6. Eleven main fragments were identified in test 4 compared to two for test 6. However, in test 4, one of the end-caps (F4–11) of a blown tank was not recovered.
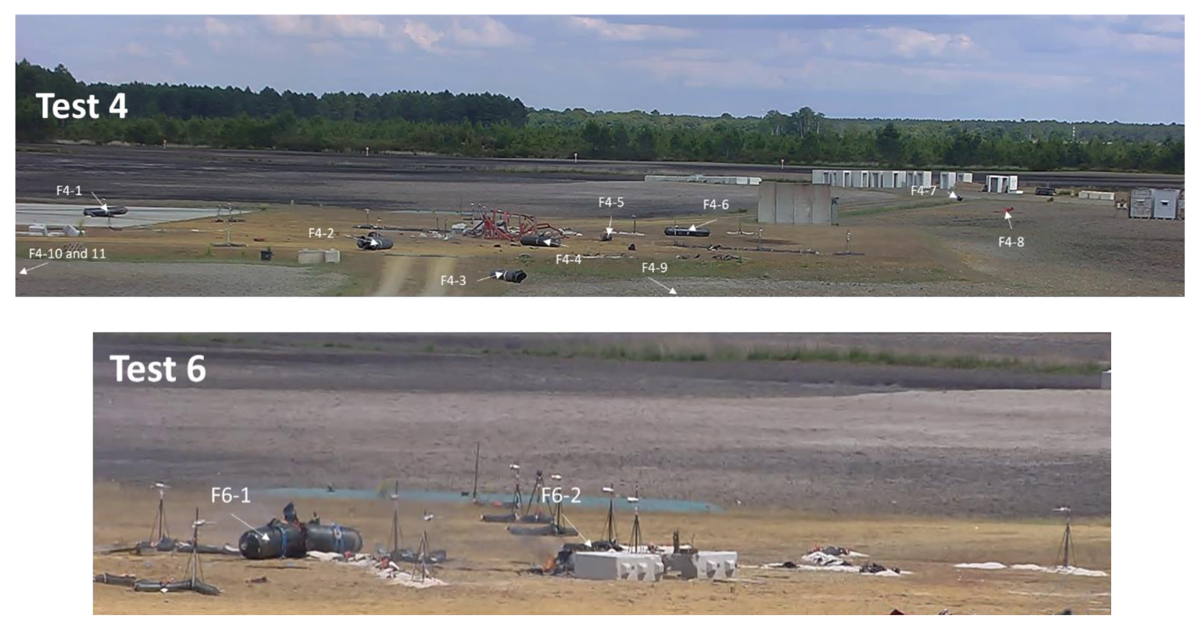
Figure 5
Tests 4 and 6 – Pictures of the experimental test site after the rupture of the tanks with the main fragments.
The characteristics associated with each fragment of these two tests are reported in Table 6. Although a large number of cameras were installed for these tests, the values for speeds and angles are the best results we were able to obtain accounting for view distortion and the time the fragments emerged from the fireballs.
Table 6
Results for the fragments analysis in open atmosphere.
| N° | MASS M (kg) | VI (m/m)at x,y m | INCLINATION ANGLE θ (°) | FLYING DISTANCE (m) | ESTIMATED CD | ESTIMATED AD (m2) | PHOTO |
|---|---|---|---|---|---|---|---|
| F4–1 | 227 | 23.51(at 5,5 m | 45 | 30 | 1.2 | 0.74 | 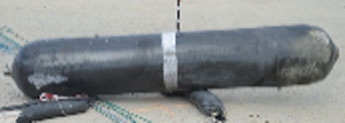 |
| F4–2 | 179 | 123 at10, 2, m | 20 | 16 | 1.2 | 0.67 | 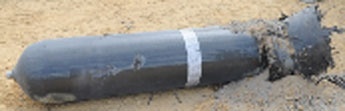 |
| F4–3 | 154 | 153 at 10,0.3 m | 0 | 27 | 1.2 | 0.65 | 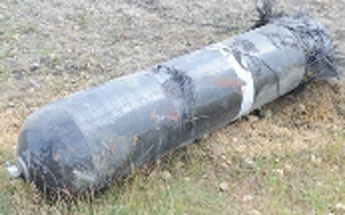 |
| F4–4 | 227 | Engulfed in the fireball | 8 | Engulfed in the fireball | 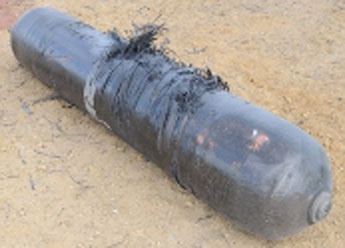 | ||
| F4–5 | 227 | 5 | 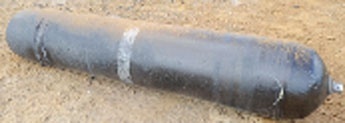 | ||||
| F4–6 | 227 | 12 | 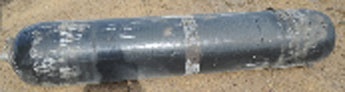 | ||||
| F4–7 | 46 | 48.53 at 14,2 m | 11 | 112 | 0.8 | 0.18 | 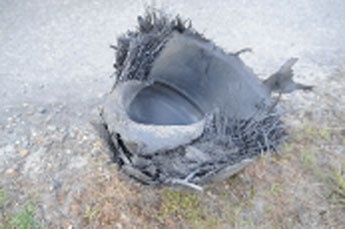 |
| F4–7 bis | 73* | 1912 at 4.7,1.3 m | 2 | Not recovered | 1.17 | 0.18 | 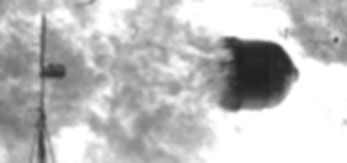 |
| F4–8 | 9.4 | 1143 at 12,1.5 m | 7 | 80 | 1.17 | 0.30 | 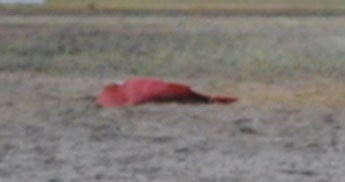 |
| F4–9 | 4.2 | 503 at 8, 0.5 m | 22 | 52 | 1.7 | 0.15 | 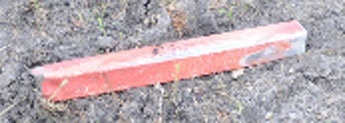 |
| F4–10 | 12 | 573 at 2, 8.5 m | 83 | 63 | 1.7 | 0.25 | 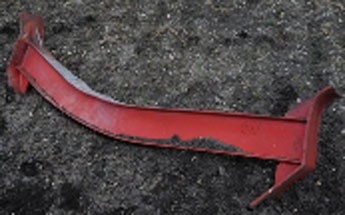 |
| F4–11 | 12 | 223 at 3, 8.3 m | 64 | 40 | 1.7 | 0.25 |  |
| F6–1 | 220 | 7.51 at 2,2 m | 30 | 6.8 | 1.2 | 0.74 | 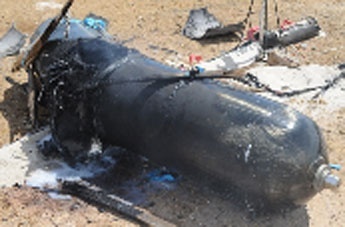 |
| F6–2 | 3 | Not analyzed | 1 | Not analyzed | 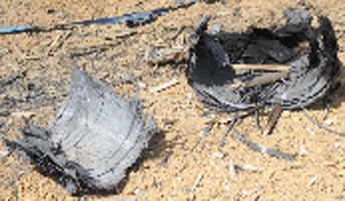 | ||
[i] 1Nova, 2SA5, 3video *estimated from the video.
The F4–3 fragment is on the ground when it emerges from the fireball. It probably hit the metal frame of the rack on its way down, which may explain its low speed. Fragment F6–2 is not included in the analysis due to its low mass and short projection distance.
Finally, it would be valuable to construct the (, ) diagram (Figure 6) using the definitions from equation 4 for the fragments of the tanks (F4–1, F4–2, F4–3, F4–7, F6–1). The initial velocity deduced from the images when the fragment exits the fireball (third column of Table 6) is used, and the estimated distance R is therefore deduced from the experimental flying distance (fifth column of Table 6). We have also added the results of explosion tests on pressurized gas tanks used to validate the model (Cain, 1996; Herzog, Pradhan and Jager, 1981). For these tests, the chosen CD is 1.17 (Baker et al., 1975, p. 364) and the AD area corresponds to the cross-section area of the tank. Our results are consistent with those obtained for tanks under air pressure. The diagram allows us to provide a conservative correlation linking the scaled distance to the scaled velocity:
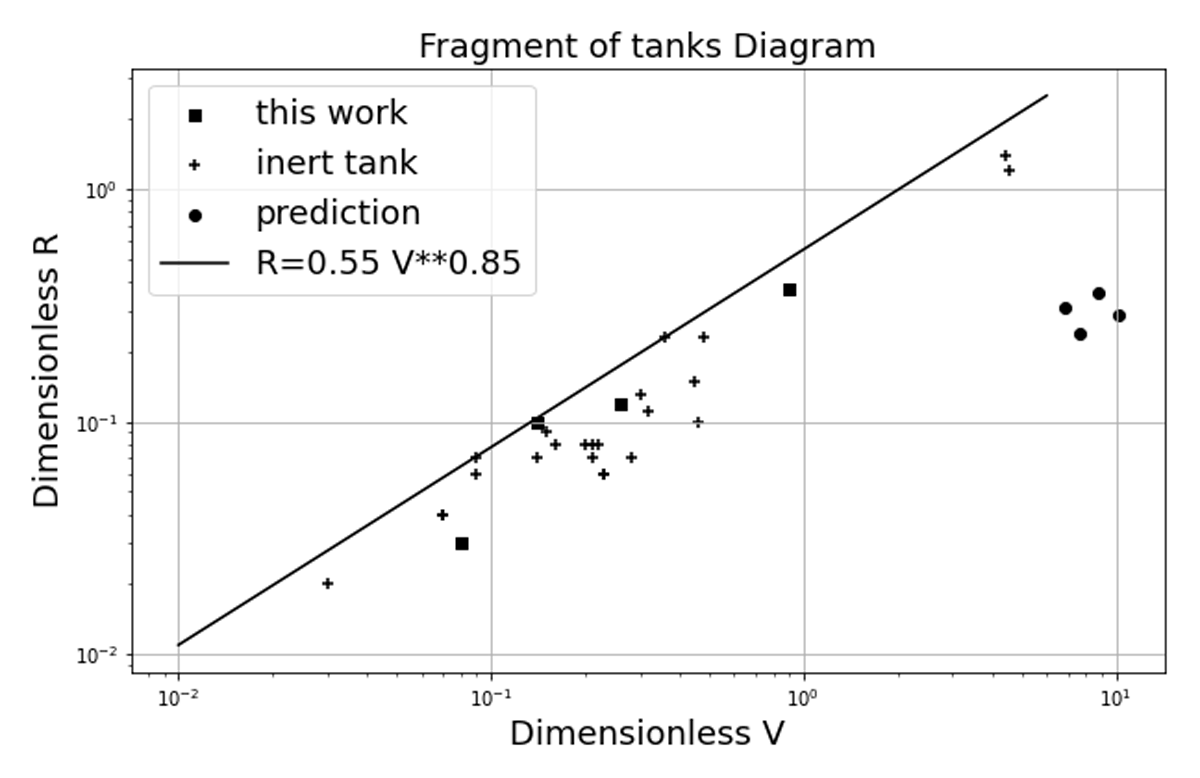
Figure 6
Dimensionless diagram for fragments assuming zero inclination angle initially.
Finally, we tested the conservatism of all this work on the two tanks that were burst during test 4. The initial velocity of the fragments is estimated by Baker’s model with Manning’s additions. Then, the flying distance is calculated with the simplified model of Shen et al. (2018), considering only the drag force. The initial angle is set to 0°, the initial elevation above the ground corresponds to the experimental value and ground friction or ricochets are not taken into account. We have added these results for the 4 fragments to the diagram in Figure 6 (labelled ‘prediction’). The correlation shows significant conservatism, and further data would help to consolidate the approach. We recall that the correlation in equation 10 corresponds to an ideal situation where the tank is in a horizontal position above the ground and ruptured by a circumferential explosive charge. It does not take into account the initial angle of inclination, which is generally set at 45° in safety studies to maximize the flying distance.
4.0 Conclusions
Experimental results on fragments generated by hydrogen tank bursts are somewhat limited compared to other fields like military and defense research. In literature experiments, only masses and flying distances are mentioned, with no information on initial speeds and angles. The tests carried out and reported in this article have attempted to overcome this shortcoming using numerous cameras and involving large quantities of hydrogen stored in type III or IV tanks.
Results show that to predict initial fragment velocity, Baker’s model for unequal fragments with Manning’s additions yields interesting results. It would be beneficial to enhance this model internally by considering the effects of real gas expansion at high initial pressures. For the external part, the model proposed by Manning assumes one-dimensional compression along the normal angle to the fragment’s surface, which maximizes the pressure on this face. In reality, this compression is likely hemispherical and results in lower pressure. Incorporating this effect could also be useful for improving the model.
Secondly, tank fragments projected during open environment tests with battlefield-type aggression follow laws similar to those for air-filled pressure tanks in terms of dimensionless flying distance as a function of dimensionless initial velocity. Finally, it’s important to note that in a tank rack, an attack on two out of six cylinders does not cause the other four to explode, but only to be projected. In these tests, the exclusion distances associated with fragment projection are greater than those associated with blast wave pressure or fireball thermal effects.
Competing Interests
Etienne Studer is a board member of the journal.