
1.0 Introduction
Hydrogen is an important element in the decarbonization of the modern economy, offering versatile and clean applications across transportation, industry, and power generation. However, its high flammability and potential for explosions necessitate careful management to ensure safe use and handling. This involves predictive modelling, robust infrastructure design, and relevant safety protocols. In France, the Ministry of the Armed Forces is exploring the feasibility of deploying hydrogen storage technologies in overseas operations. This unique context introduces different types of threat compared to conventional industrial uses, where hydrogen risks are well-studied. Therefore, it is crucial to conduct specific test campaigns that simulate the most likely types of attack to estimate effect distances for pressure waves, thermal radiation from fireballs, and any fragments emitted during an attack. Ballistic tests are reported in a companion paper (Studer, et al., 2025a), while this paper focuses on attacks involving explosive charges and primary fragments produced by mortar ammunitions, which present distinct challenges and risks that must be thoroughly understood and mitigated.
Compressed hydrogen storage (CGH2) tank bursts have been extensively studied, particularly in scenarios involving fires engulfing the tank after a road accident with a gasoline-fuelled car. The pioneering work of Zalosh, et al. (Zalosh & Weyandt, 2005; Zalosh & Wellesley, 2007; Weyandt, 2007) conducted rupture tests on Type III (88 liters, 31.8 MPa) and Type IV tanks (72.4 liters, 34.3 MPa) in fire conditions. The Type IV tank was tested in an open atmosphere, while the Type III tank was positioned below an SUV. These tests quantified overpressures, fireball characteristics, fragment sizes, and flying distances.
In the Secutech2 project, a small nine-liter Type IV tank at 70 MPa was tested using a circumferential cutting charge (López, et al., 2015). Additionally, Molkov (Molkov, et al., 2021) reported two fire tests performed by a Japanese institute on approximately 70 MPa Type III and IV tanks. These tests validated a detailed CFD model, revealing that the tank’s opening mode was not circumferential but directed towards the blast pressure measurements, increasing the mechanical energy transferred to the blast waves. Recently, Wang et al. (Wang, et al., 2023) conducted fire-bursting tests on small 6.8-liter Type III CGH2 tanks, providing data on blast pressure and fireball dimensions. Park, et al. (Park & Kim, 2023) reported on Type IV tank bursting tests in a fire, with a protective wall installed near the vehicle, offering insights into overpressures. Finally, Sandia National Labs performed catastrophic rupture tests on CGH2 tanks using high-velocity projectiles (Brooks & Glover, 2022). They detailed the distribution of blast overpressure around the tank and highlighted the angular heterogeneities of these overpressures.
Liquid hydrogen (LH2) storage tanks have also been tested under similar conditions. In 1996, Pehr (Pehr, 1996) reported test results of bursting LH2 tanks using a circumferential cutting charge. The recorded blast pressures varied significantly, showing either a single pressure peak or up to three distinct peaks. Information on the fireballs was also provided: at short time scales, the maximum diameter ranged from 5 to 15 meters, and as buoyancy effects emerged, the diameter reached up to 20 meters with a maximum height of 16 to 20 meters four seconds after ignition. However, limited details were available about the tanks used in the tests, except that the initial pressure and filling levels varied. The tanks had an internal volume of 120 liters and a total mass of 60 kg. Recently, additional tests involving liquid hydrogen tanks in fire conditions, resulting in BLEVE phenomena, were conducted at BAM during the SH2IFT project (van Wingerden, et al., 2022). These tests reported on the catastrophic rupture of an MLI-insulated LH2 tank, providing data on overpressure, fireball size, fragment flying distance, and radiated heat flux (Giannini, et al., 2023). Two catastrophic explosion accidents were reported in (Shen, et al., 2018), both caused by the failure of thermally activated pressure relief devices to activate in time. The incidents involved tanks with a volume of 165 L and an operating pressure of 44 MPa, which were subjected to fire testing. Unfortunately, the overpressure levels during these events were not measured. All these tests for both tank types are summarized in Table 1.
Table 1
Experiments available in the open literature dealing with hydrogen storage tank bursts.
| N° | H2 STATE | TANK TYPE | TANK V. (L) | TANK POSITION | TANK SIZE L/D (M) | TANK INITIAL P. (MPa) | TANK BURST P. (MPa) | TANK BURST TEMP. (K) | BURSTING METHOD | REF. |
|---|---|---|---|---|---|---|---|---|---|---|
| 1 | LH2 | LH2 | 120 | H | 0.722/0.46 | 0.5 to 1.48 | 0.5 to 1.48 | 20 | Cutting charge | (Pehr, 1996) |
| 2 | GH2 | 1: IV 2: III | 1: 72.4 2: 88 | 1: H 2: under a SUV | 0.84/0.41 | 1: 34.3 2: 31.8 | 1: 35.7 | 1: 312.15 | Fire | (Zalosh & Weyandt, 2005), (Zalosh & Wellesley, 2007) |
| 3 | GH2 | 1: IV 2: III | 1: 35 2: 36 | H | N.P.* | 1: 70.23 2: 70.69 | 1: 94.54 2: 99.47 | 1: 379.8 2: 394.2 | Fire | Cited in (Molkov, et al., 2021) |
| 4 | GH2 | III | 9 | H | N.P. | 70 | 70 | N.P. | Cutting charge | (López, et al., 2015) |
| 5 | GH2 | IV | V corresponding to 2.1 kg of CGH2 | In a vehicle | N.P. | 70 | N.P. | N.P. | Fire | (Park & Kim, 2023) |
| 6 | GH2 | III | 165 | N.P. | 1.775/0.37 | 35 | 43.8 to 44 | N.P. | Fire | (Shen, et al., 2018) |
| 7 | GH2 | III | 6.8 | V | 0.52/0.157 | 30.6/31.0 | 49.7±3.3 | N.P. | Fire | (Wang, et al., 2023) |
| 8 | LH2 | LH2 (MLI) | 1000 (filling 35–40%, 27 kg of LH2) | H | N.P. | 0.4 | 5 | 26.2–32.4 (estimated) | Fire | (van Wingerden, et al., 2022) |
| 9 | GH2 | IV | 580 | H | 2.06/0.686 | 25 | 25 | 288.15 | projectile | (Brooks & Glover, 2022) |
[i] *N.P. Not Provided.
When analysing CGH2 tanks, the first step is to determine the mass of hydrogen stored and the initial energy stored in the tanks. The mass of fuel must be calculated using a real gas equation of state (EOS), such as the Abel–Noble EOS, due to the high pressures involved (Molkov & Kashkarov, 2015). The initial energy in the tank consists of mechanical energy from pressure and chemical energy from the combustible gas. While estimating chemical energy (mass of fuel multiplied by the lower heat of reaction mH2ΔHr) is straightforward, calculating mechanical energy is more complex. Various formulas involve different transformations between the initial and final states of the ruptured tank. Molkov, et al. (Molkov & Kashkarov, 2015) analysed these transformations and proposed using Brode’s expansion model with a real gas EOS for the following reasons: i) only gas expansion has a characteristic time comparable to blast wave propagation time, contributing to its strength, and both isothermal and thermodynamic availability models are excluded because they assume energy extraction from the surroundings to maintain constant temperature after gas expansion; ii) the isentropic model assumes an adiabatic process, which is an idealization of the real process; iii) Brode’s model for mechanical energy is close to the isentropic model and is considered the most realistic with fewer restrictive assumptions.
The consequences of a catastrophic rupture of a CGH2 tank can be categorized into three main types: overpressure threats from blast wave formation and propagation, thermal threats from the radiated heat flux of the resulting fireball, and impact threats from flying debris. The issue of flying debris is addressed in a companion paper (Studer, et al., 2025b). This article focuses on the first two threats: overpressure and thermal impacts.
For blast wave analyses, Molkov, et al. (Molkov & Kashkarov, 2015) proposed a methodology based on Baker’s pressurized vessel burst curves to quantify the energies involved in blast wave formation. This approach was also employed by Kudriakov, et al. (Kudriakov, et al., 2022) to analyse blast waves following a tank rupture in a tunnel geometry. The methodology introduces two factors, α and β, to determine the total energy E involved in the blast wave formation:
where P is the pressure, Vtank the volume of the tank, γ the isentropic coefficient, and b the co-volume of the Abel–Noble EOS. Index 0 is used for the tank and ∞ for the surrounding air.
Kashkarov, et al. (Kashkarov, et al., 2020) summarized the proposed values of the two coefficients based on analyses of the Weyandt, Tamura, and Shen tests (Table 2). A value of α = 1 is typically used for tanks above ground, while α = 1.8 is used for tanks on the ground. The latter corresponds to the ideal value of 2 based on symmetry, considering that 10% of the energy is lost due to partial reflection and cratering in practical applications. The value α = 4 corresponds to a scenario where the tank opens with a jet directed towards the blast pressure sensors. In these tests, the chemical contribution to the total energy involved in the blast wave accounts for between 4.2% and 9%.
Table 2
Proposed values of energy contribution in blast wave formation.
| N° | α | β | REFERENCE |
|---|---|---|---|
| 2 | 1.8 (tank only) 0.12 (under vehicle) | 0.042 0.09 (under vehicle) | (Weyandt, 2007) |
| 3 | 4 | 0.052 | Cited in (Molkov, et al., 2021) |
| 6 | 1.8 | 0.052 | (Shen, et al., 2018) |
For fireballs, Makarov, et al. (Makarov, et al., 2021) reviewed the behaviour of fireballs resulting from the catastrophic rupture of hydrogen tanks in fire to derive correlations suitable for engineering tools to assess hazard distances. They primarily used experimental results from Weyandt, Tamura, and Shen for CGH2, and Zabetakis for LH2 spills. The information on fireballs from the experiments listed in Table 1 has been compiled in Table 3, detailing diameter (D) and duration. Makarov et al. proposed two different correlations for gas and liquid storage, with theoretical (t) and conservative (c) versions assuming hemispherical (hms) or spherical (sph) shapes of fireballs. The latter results in a geometric reduction factor of ∛2 compared to the former. For CGH2 tanks, the proposed correlations for the diameter of hemispherical shape fireballs are as follows:
Table 3
Experiments available in the open literature dealing with fireballs after CGH2 storage tank bursts.
| N° | FIREBALL DIAMETER (M) | FIREBALL DURATION (S) | REF |
|---|---|---|---|
| 2 | 7.7 (momentum driven 45 ms after rupture), 16.5 (CFD simulation of [5]) 24 (no time provided) | Lift-off at 1 s Visible 2s, IR 4.5 s | (Zalosh & Weyandt, 2005), (Zalosh & Wellesley, 2007) |
| 3 | 20 | Cited in (Molkov, et al., 2021) | |
| 6 | 7 to 8 | 1.2 | (Shen, et al., 2018) |
| 7 | 4.48 (Test 1) 4.62 (Test 2) | 0.127 (momentum) 2 (buoyancy) | (Wang, et al., 2023) |
However, the hydrogen inventory in these analyses is less than 4 kg, which is relevant for light mobility applications but not for the larger storage quantities required in overseas military operations. Consequently, SID-EPN and CEA have conducted specific tests representative of these conditions for Type I and Type IV storage tanks. These tests aim to assess the extrapolation of the above methodologies to higher hydrogen masses. Despite the recent development of sophisticated models for compressed hydrogen gas tank explosions and the resulting overpressures, it is insightful to compare experimental data with established correlations for solid explosives. This comparison serves two primary purposes. First, it allows us to explore the feasibility of such comparisons, particularly in the far field. Second, these correlations are widely utilized by engineers in military applications, making this analysis practically relevant. For these reasons, we will compare our data with the correlations presented in (Swisdak, 1994), which are based on experiments involving hemispherical TNT charge explosions.
This article is organized as follows: the first part describes the test conditions and the measuring equipment used. The results for Type IV tanks are then detailed and compared to the two methodologies discussed earlier. Conclusions follow.
2.0 Test Conditions
SID-EPN and CEA have jointly conducted field tests to investigate the catastrophic rupture of Type IV hydrogen tanks under two conditions: Test 6 involved a single Type IV tank, while Test 4 featured a group of six interconnected Type IV tanks arranged in a rack (Table 4). For the single tank, the rupture was initiated using a high-explosive charge placed at the centre. In the rack configuration, an 81 mm unit of mortar ammunition was positioned at the centre of the lower part, and an additional high-explosive charge was placed between two tanks in the upper part. Only the high-explosive charge caused a full rupture of two neighbouring upper tanks, while the other tanks were projected around with leakages through connecting pipes. The mortar ammunition damaged the neighbouring tank due to shrapnel, but only leakage was observed. Initially, the tanks were filled with hydrogen at a pressure close to 53 MPa, with each tank storing approximately 7.8 kg of hydrogen. There were two additional tests (Tests 2 and 3) where only solid explosive was used (mortar ammunition). The mortar ammunition was specified by the manufacturer as containing 800 g of TNT. However, it was used in our tests under specific conditions: vertical position and confinement to limit shrapnel propagation. Both tests were therefore used to obtain the TNT equivalent of the mortar ammunition from overpressure measurements. A mass of 1.3 kg was used to obtain the theoretical decrease in overpressure as a function of distance. This mass was used in all tests involving a mortar ammunition.
Table 4
Test conditions for catastrophic rupture of CGH2 tanks in open atmosphere.
| TEST N° | P(MPA) T (K) | TYPE | V (L) | WEIGHT (KG) | L/D (M) | CUTTING CHARGE LOCATION | PHOTO |
|---|---|---|---|---|---|---|---|
| 4 | 52 to 54 296 | IV | 6 × 240 | 6 × 219 + Frame | 2.575/0.48 | Between two tanks | 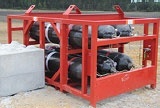 |
| 6 | 53 298 | IV | 240 | 219 | 2.575/0.48 | Centred | 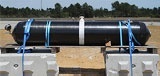 |
An array of blast sensors (Kistler 025Q01, 050Q01, 250Q01, and PCB 137B24, 137B26) was installed around the tanks to accurately measure the overpressure field generated. Concrete blocks were positioned to mitigate the shrapnel effect from mortar fragments in the direction opposite the tanks. Additionally, five radiometers (Captec) were employed to monitor the radiated heat flux from the fireballs. The sensor locations are detailed in Figure 1.
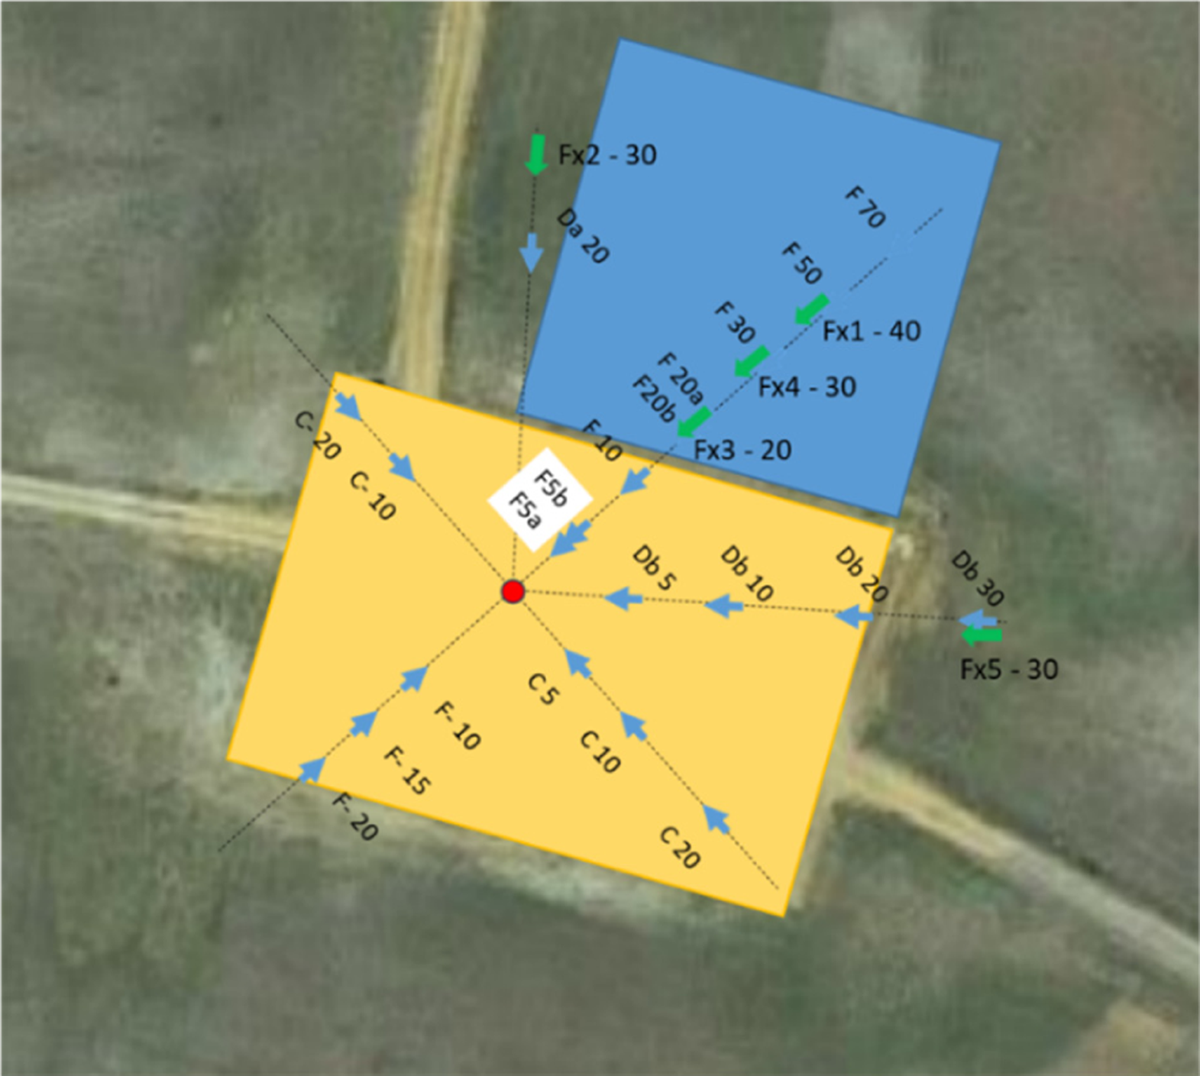
Figure 1
Arrangement of blast sensors (C, F, Db and Da) and radiometers (Fx) at the test site.
Five high-speed cameras (Photron SA1, SA5, Nova S20, Phantom TMX 7510, and AOS-JPRI) and six video surveillance cameras were deployed to observe key phenomena such as fireballs and fragments. Only three of the six video surveillance cameras were utilized. The camera locations are indicated in Figure 2.
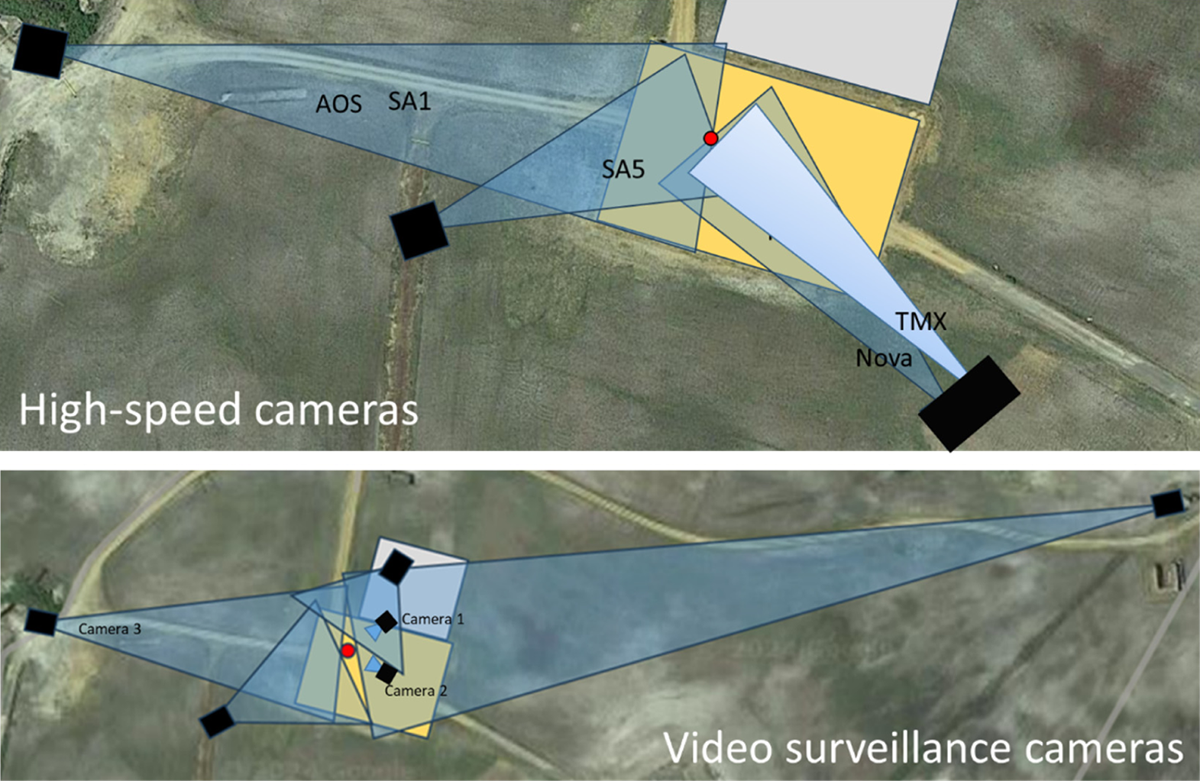
Figure 2
Arrangement of cameras at the test site.
3.0 Results
3.1 Blast waves analysis
In this section we analyse the results corresponding to Tests 2 and 3 (Figure 3, a unit of mortar ammunition with 1.3 kg TNT for both tests), Test 4 (Figure 4, High-Explosive charge of 2.1 kg TNT and two hydrogen tanks exploded), and Test 6 (Figure 5, High-Explosive charge of 0.625 kg TNT and one hydrogen tank exploded). For each of these tests we present (a) the pressure evolution with time for the pressure sensors of the line F located at 5 m, 10 m, 20 m, 30 m, 50 m, and 70 m from the explosion; (b) the maximum overpressure; (c) blast wave time of arrival; and (d) positive impulse as functions of distance from explosion for all lines. The experimental results of subfigures (b), (c) and (d) are compared with the curve fits of (Swisdak, 1994), developed using the experimental data of hemispherical TNT surface burst detonations. Cube root scaling of distance, time of arrival, and positive impulse is applied.
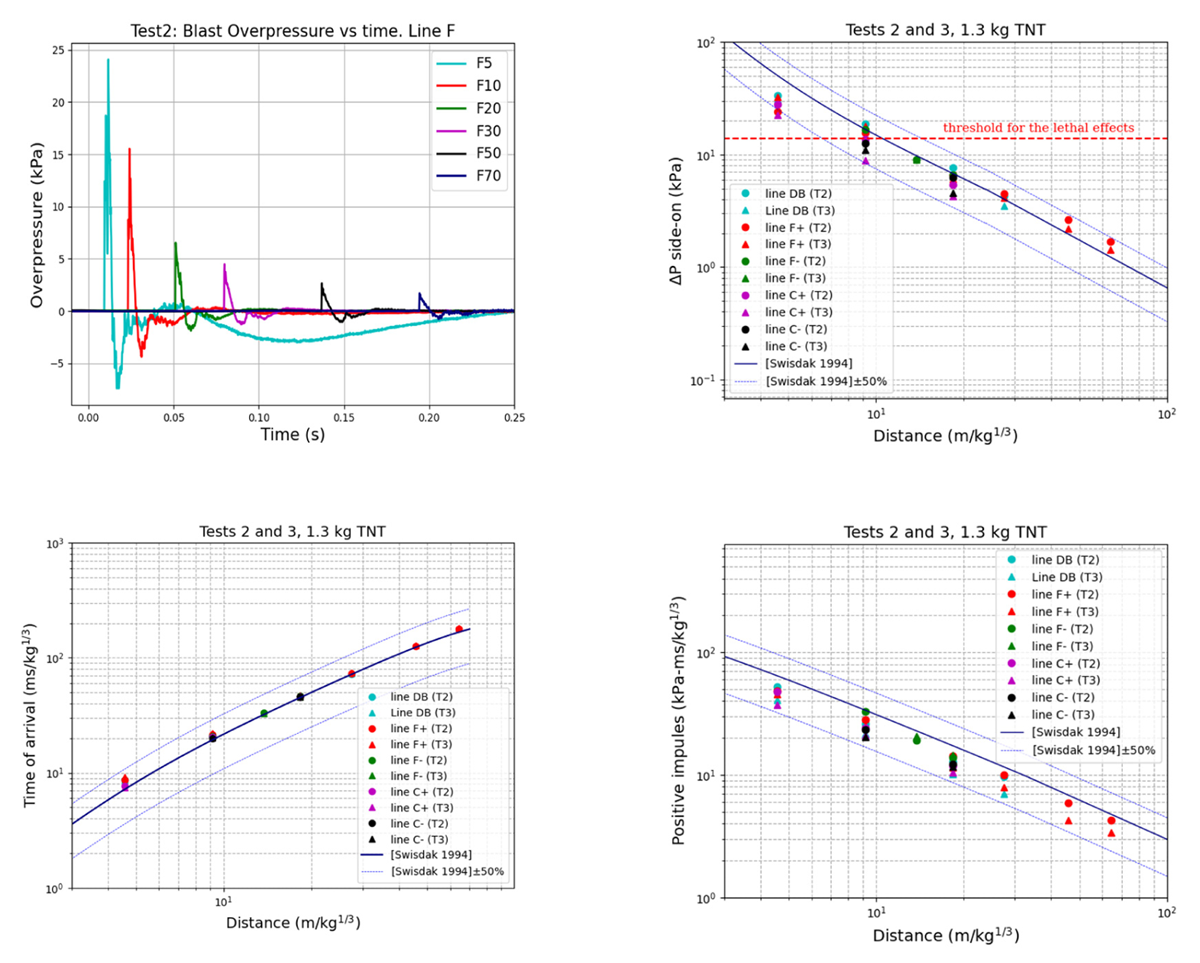
Figure 3
Tests 2 and 3 (1.3 kg of TNT). Overpressure evolution with time along the line F (Test 2) (top left), maximum overpressure (top right), blast wave time of arrival (bottom left), and positive impulse (bottom right) along different lines.
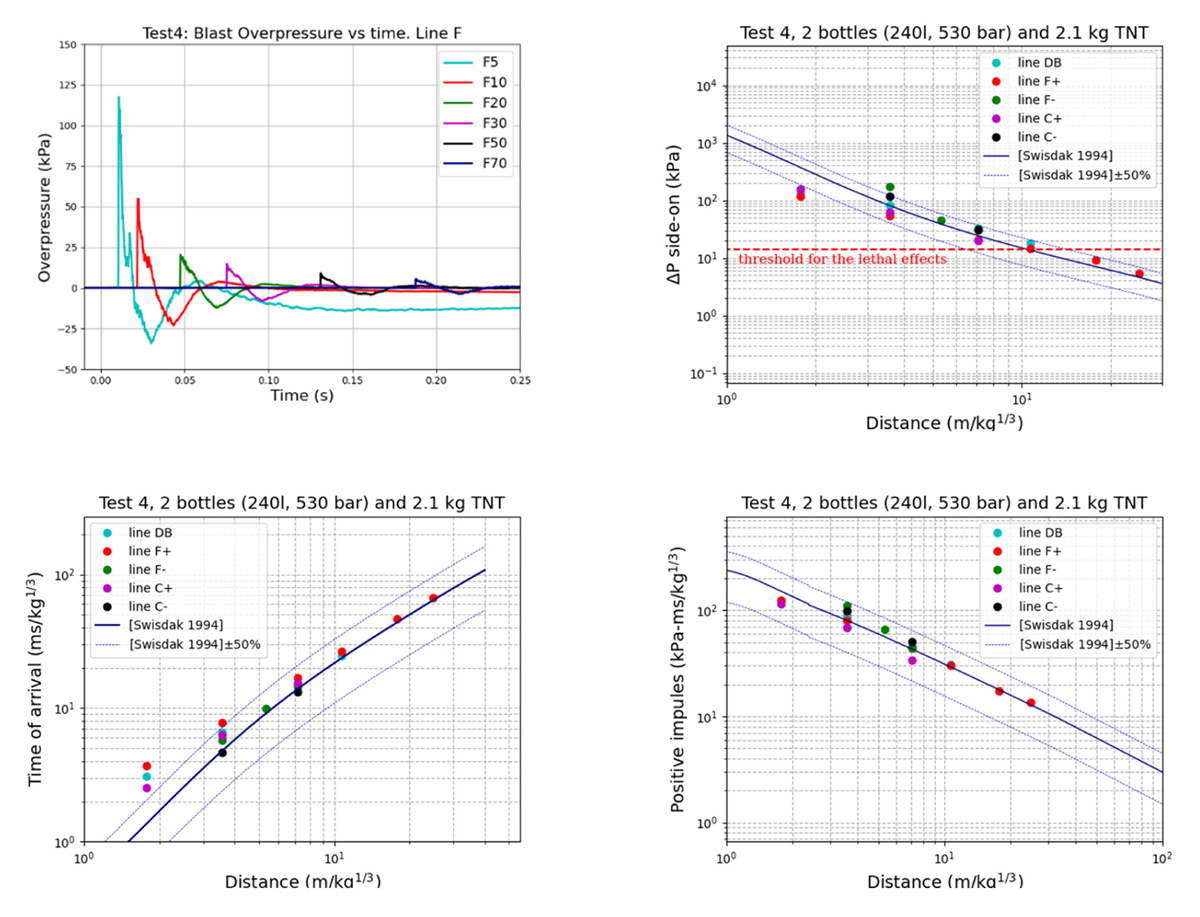
Figure 4
Test 4. Overpressure evolution with time along the line F (top left), maximum overpressure (top right), blast wave time of arrival (bottom left), and positive impulse (bottom right) along different lines.
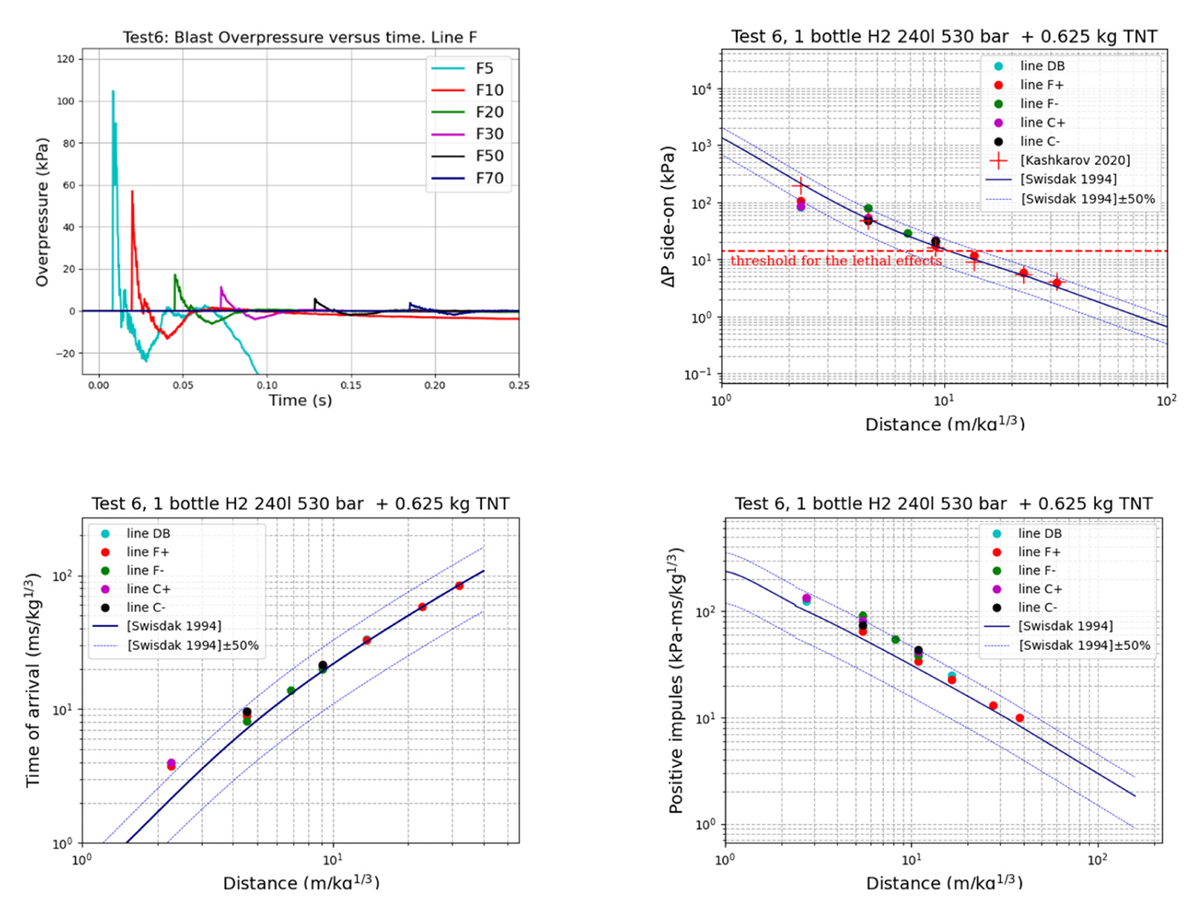
Figure 5
Test 6. Overpressure evolution with time along the line F (top left), maximum overpressure (top right), blast wave time of arrival (bottom left), and positive impulse (bottom right) along different lines.
In Tests 2 and 3, the experimental data for blast wave time of arrival and positive impulse align closely with the curve fits of (Swisdak, 1994) for most data points. However, the maximum overpressure values deviate slightly: they are lower than expected at short distances from the explosion and higher at larger distances. This discrepancy can potentially be attributed to the absorption of some explosive energy by the concrete structures and high-pressure gas bottles.
In Tests 4 and 6, we deal not only with solid explosive energy, but also with the mechanical and chemical energy contained inside the compressed hydrogen gas bottles (Table 5). Take the configuration of Test 4, as an example. The mechanical energy contained inside two exploded bottles is equivalent to 11.1 kg of TNT (we use 4.184MJ for 1 kg TNT equivalent), while the chemical energy is equivalent to 448 kg of TNT. The results of investigations in (Molkov, et al., 2021) and (Molkov & Kashkarov, 2015) reveal that some portion of chemical energy corresponding to the partially premixed fireball has to be taken into account in order to better predict the experimental blast wave decay.
Table 5
Mass and energy values in kg TNT corresponding to the Test 4 and 6. SE, Solid Explosive; mech, Mechanical; chem, Chemical. 1kg TNT = 4.184 MJ.
| TEST N° | MSE, KG TNT | MH2, KG | EMECH, KG TNT | ECHEM, KG TNT |
|---|---|---|---|---|
| 4 | 2.1 | 15.6 | 11.1 | 448 |
| 6 | 0.625 | 7.78 | 5.55 | 224 |
By considering 100% of the mechanical energy and 2% of the chemical energy, the data points align closely with the curve fits for both tests (Figures 4 and 5 top right, bottom left and right). The only exception is the behaviour in the near field, specifically at 5 m from the explosion location. In this region, the maximum overpressure exceeds the value defined by the curve fit reduced by 50%, while the blast wave time of arrival is higher than the curve fit value increased by 50%. This can be explained by the fact that the mechanical energy release rate in a tank explosion is slower compared to the energy release rate in a solid material explosion. This is confirmed by the experimental data of (Baker, et al., 1983) and explained in (Molkov & Kashkarov, 2015). It is shown in Figure 15 of (Molkov & Kashkarov, 2015) that in the near field the overpressure due to a tank explosion is lower than that obtained due to solid material explosion. In the case of a hydrogen tank explosion, the release of chemical energy must be taken into account. The combustion energy, which contributes to the blast wave overpressure, is released over a period in the order of 10 ms, during the relatively rapid growth of the fireball.
For all described tests, the maximum overpressure levels exceed the threshold value for the first lethal effects, generally taken as 14 kPa (Légifrance, 2005). The relatively ‘safe distance’ starts at 11 m (Tests 2 and 3), at 28 m (Test 4), and at 22 m (Test 6) from the explosion. We conducted a comparative analysis between our experimental data for Test 6—which involved a relatively small charge of 0.625 kg of TNT—and the hazard distance nomograms provided in (Kashkarov, et al., 2020). The outcomes of this comparison are depicted in Figure 5 (top right), wherein the overpressure levels derived from (Kashkarov, et al., 2020) are indicated by red crosses. It is noteworthy that the latter results align closely with the correlation curve presented in (Swisdak, 1994).
We compared the evolution of blast wave velocity with distance for the two tests against the velocity evolution of a blast wave due to solid material explosion (Figure 6). It is observed that in the near field, the velocity due to tank explosion is lower. However, at greater distances (10 m–15 m), it becomes higher than the values predicted by curve fits. At later times, the blast wave propagation velocity approaches the curve fit values.
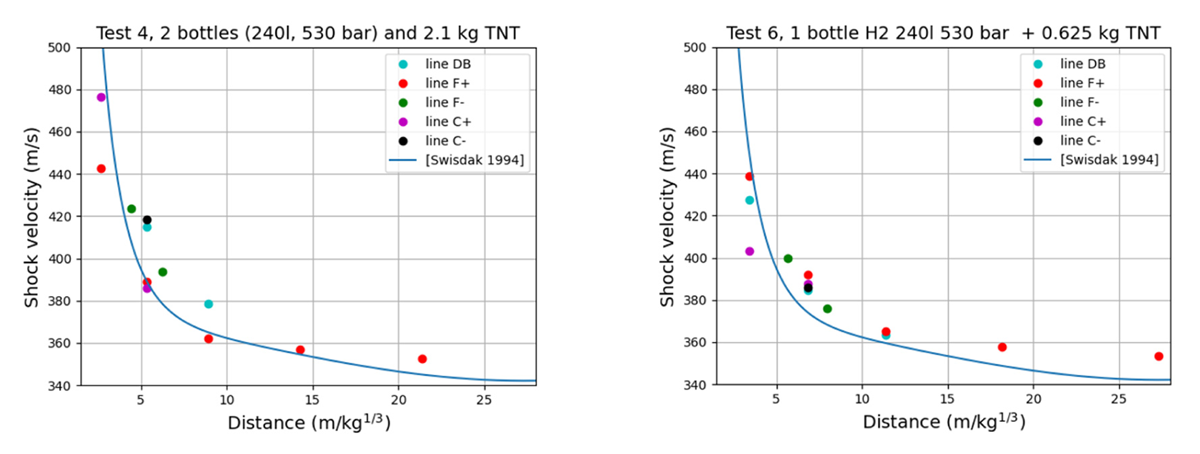
Figure 6
The blast wave velocity evolution with distance for Test 4 (left) and Test 6 (right).
3.2 Fireball analysis
Thermal exclusion zones result from the formation of a fireball following the catastrophic rupture of a tank and the ignition of released hydrogen through a partially premixed combustion process. Identifying the dimensions of these fireballs is crucial for defining zones engulfed in combustion. Results for both tests are shown in Figure 7. The fireball develops rapidly, within 10 to 20 milliseconds, as observed in tunnel tests (Kudriakov, et al., 2022). Initially hemispherical, the shock wave emerges from the reactive zone (Figure 8). Subsequently, growth slows, and the two tests diverge. In Test 4, the diameter and height remain similar, indicating a hemispherical shape, while in Test 6, the height and diameter converge, transitioning from a hemisphere to a sphere due to buoyancy. This trend is confirmed by subsequent images. However, in Test 4, the two cameras (1 and 2) recorded different measurements (Figure 7, left), likely due to wind effect (Figure 9). The maximum fireball diameter was approximately 30 meters for Test 6 and 20 meters for Test 4, occurring about 1.5 seconds after the burst.
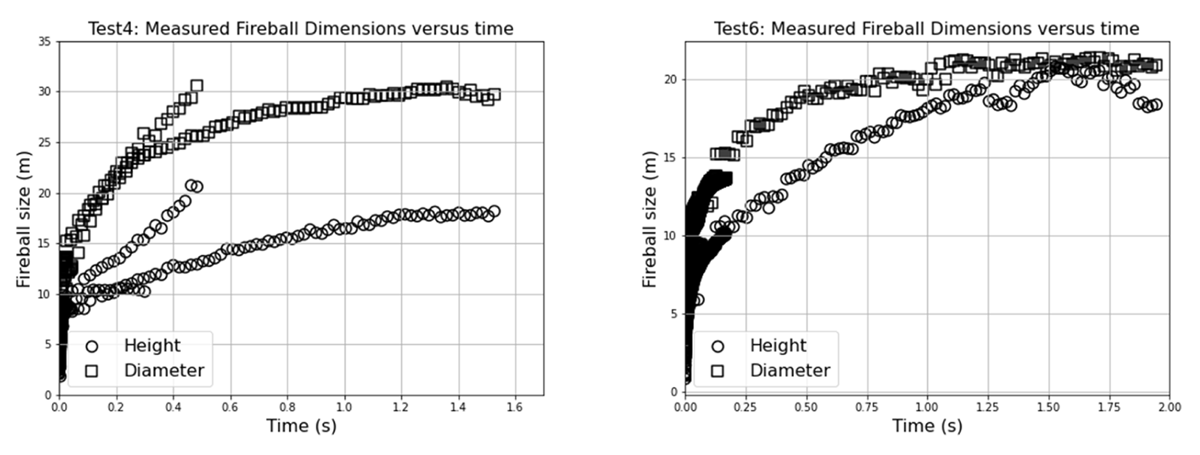
Figure 7
Fireball development: left, Test 4 (after 0.5 s, the fireball leaves the field of view of one of the cameras); right, Test 6.
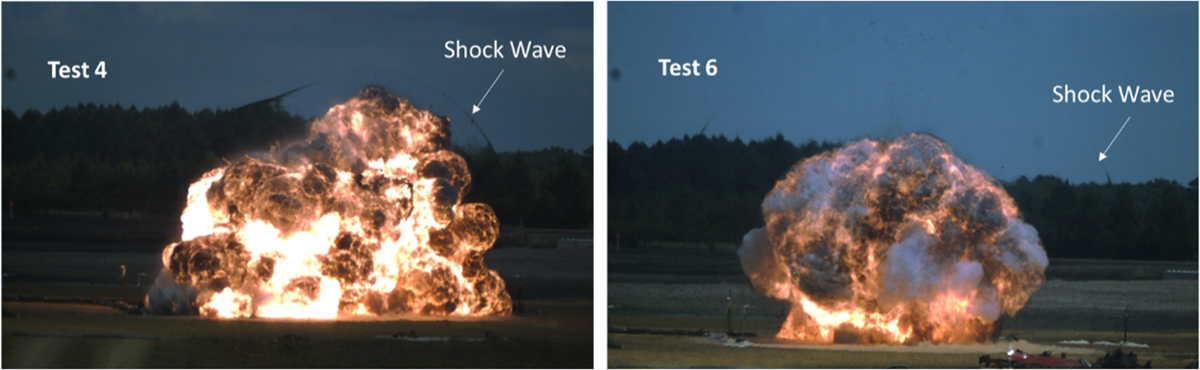
Figure 8
Fireball shape after about 10 ms (Photron SA1 camera).
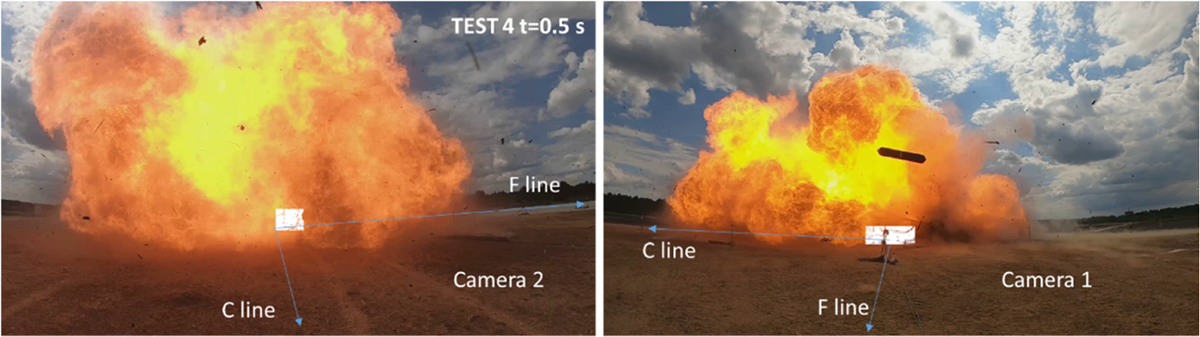
Figure 9
Test 4: fireball shape at 0.5 seconds (cameras 1 and 2).
Integrating these results with the correlations developed by Makarov, et al. (Makarov, et al., 2021) is essential for predicting fireball size in tanks with higher hydrogen content. The new test results of Wang, et al. (Wang, et al., 2023) are also included. The proposed correlations are compiled in Figure 10, showing a good fit with the theoretical curve and supporting applications up to 20 kg of stored hydrogen mass.
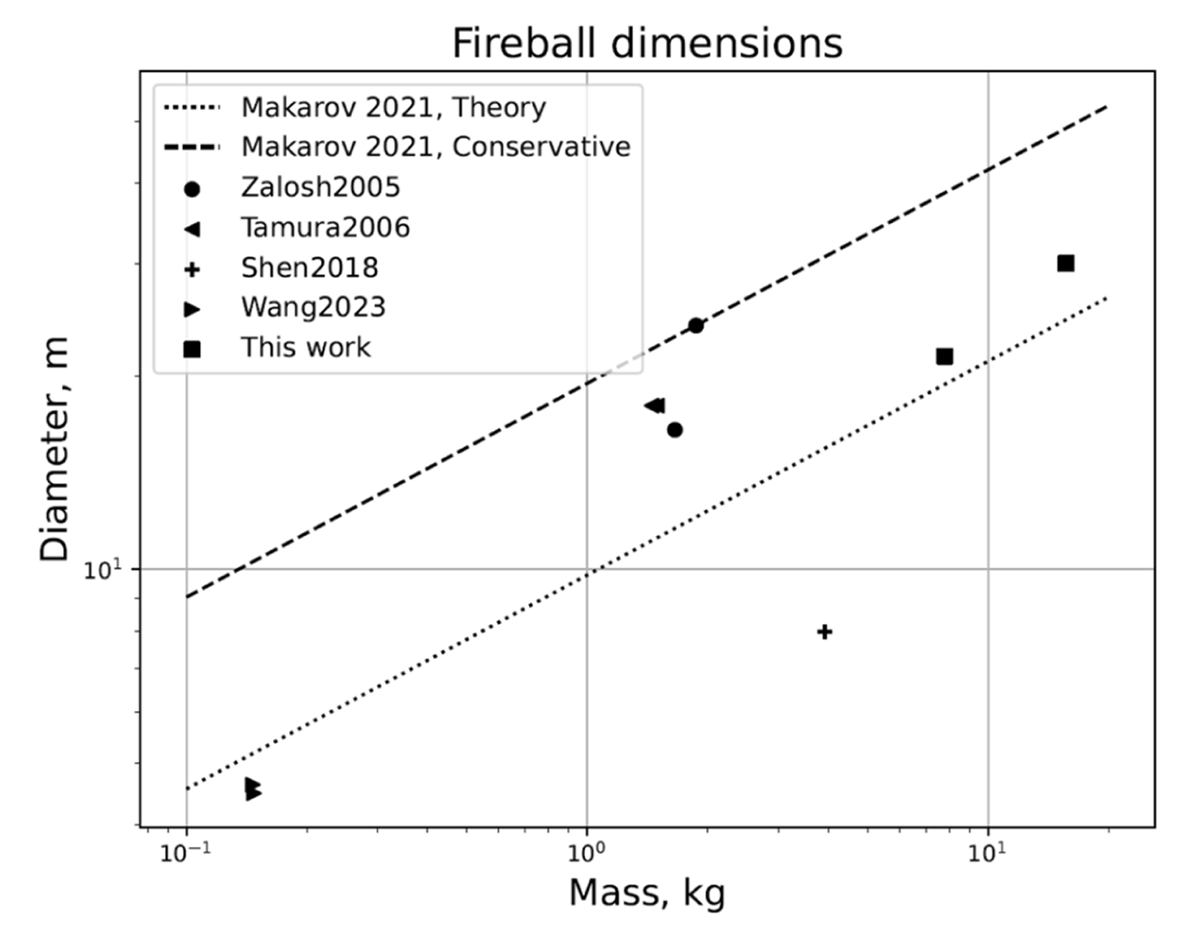
Figure 10
Synthesis of fireball dimensions in cases of CGH2 bursting tanks.
The thermal effects were assessed using radiated heat flux measurements around the test area, as shown in Figure 11. The maximum heat fluxes, measured at the closest radiometer (20 m) from ground zero, were 30 kW/m2 for Test 4 and 25 kW/m2 for Test 6, both occurring around 1 second after the burst when the fireball was fully developed. These values are significantly lower than the 210 kW/m2 measured at 15.2 m during Zalosh’s Test 2 (Zalosh & Weyandt, 2005). Such a large value may raise questions about the relevance of the measurement method used, and requires confirmation. Our measured values align with the expected 1/r2 behaviour. Considering 8 kW/m2 as the threshold for serious human injury and structural damage (threshold for domino effect), both tests recommend an exclusion distance of at least 40 meters. Thermal dose is a more relevant criterion for the effect of transient fireballs. For humans, the criterion adopted for the threshold of danger of significant lethal effects is 1800 [kW/m2]4/3∙s. Taking Test 6 and the F × 3 radiometer, we obtain a thermal dose of around 1100 [kW/m2]4/3∙s when the fireball disappears. Consequently, the distance from the previous threshold for humans is less than 20 m. For overpressure effects, with 140 mbar as the lethal threshold, the exclusion distance is 30 meters for Test 4 and between 20 and 30 meters for Test 6, indicating comparable distances.
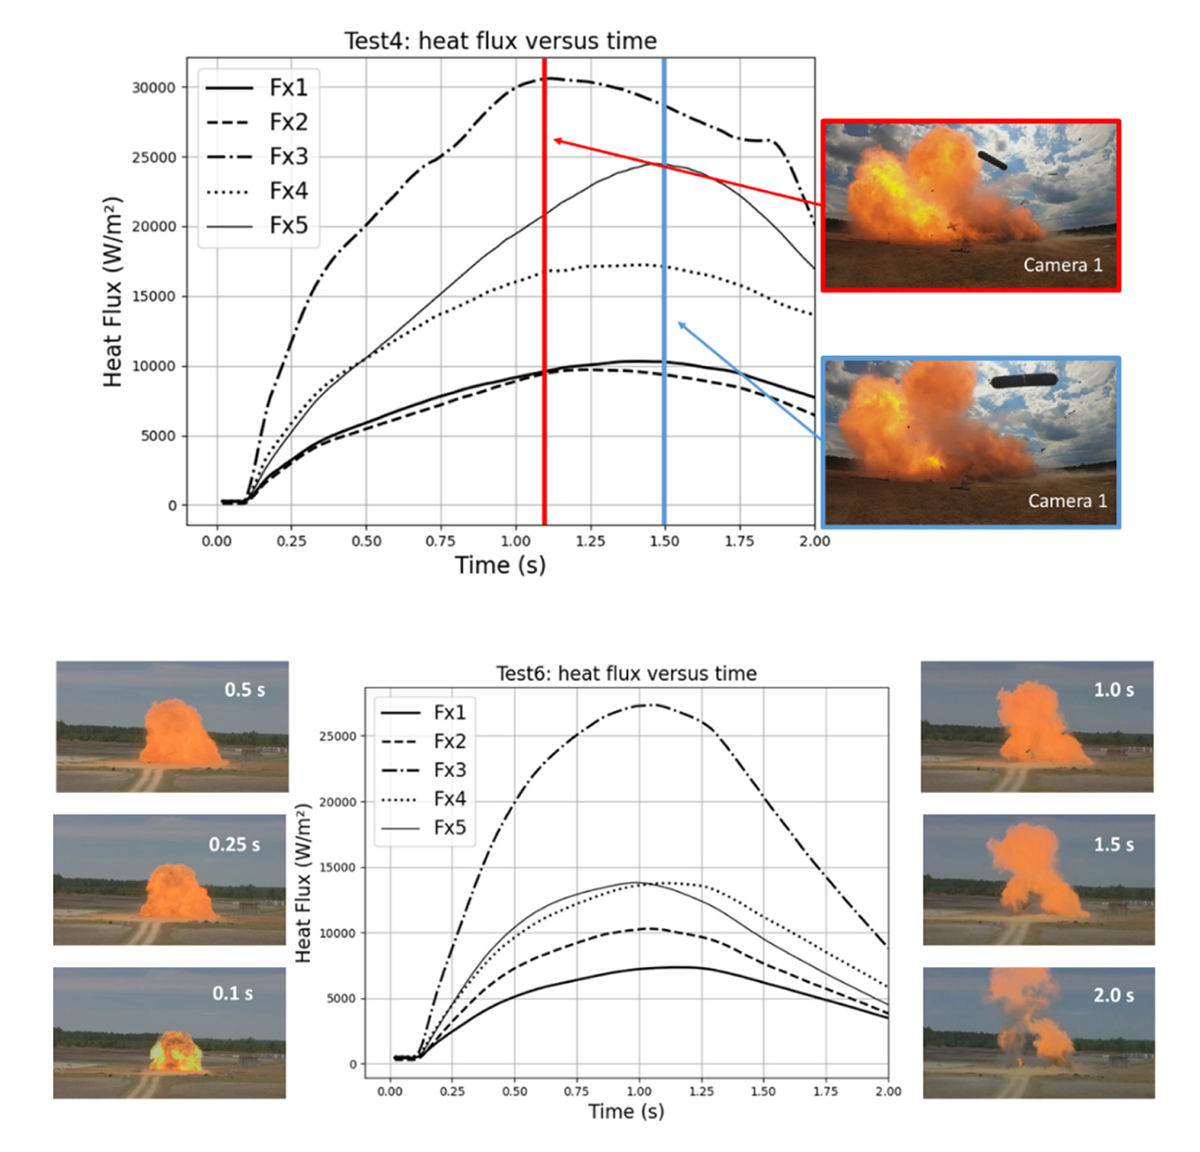
Figure 11
Fireball shape and associated radiated heat fluxes. Top: Test 4 (cameras 1 and 2); bottom: Test 6 (camera 3).
4.0 Conclusions
The exclusion zones defined after a pressurized hydrogen tank rupture are often based on tests with small tanks or limited data from larger tanks typical of light mobility applications. New uses necessitate data from larger tanks. The tests conducted in this study complement previous analyses, particularly those by the University of Ulster, confirming the validity of proposed methods for hydrogen quantities up to twenty kilograms. Furthermore, the exclusion distances based on thermal and overpressure effects significant for human life and structures are of similar magnitude.
For all the described tests, the maximum overpressure levels exceeded the threshold for the first lethal effects, which is generally considered to be 14 kPa (Légifrance, 2005). The ‘safe distance’ (where overpressure falls below this threshold) begins at 11 m (Tests 2 and 3), 28 m (Test 4), and 22 m (Test 6) from the explosion. Notably, this threshold aligns with the eardrum rupture threshold specified in UK legislation (Kashkarov, et al., 2020). For tests involving fireballs (Tests 4 and 6), the threshold for serious human injury and structural damage (including domino effects) is set at 8 kW/m2. Based on this criterion, the recommended exclusion distance is at least 40 meters.
Competing Interests
Etienne STUDER is a board member associated with the journal.