
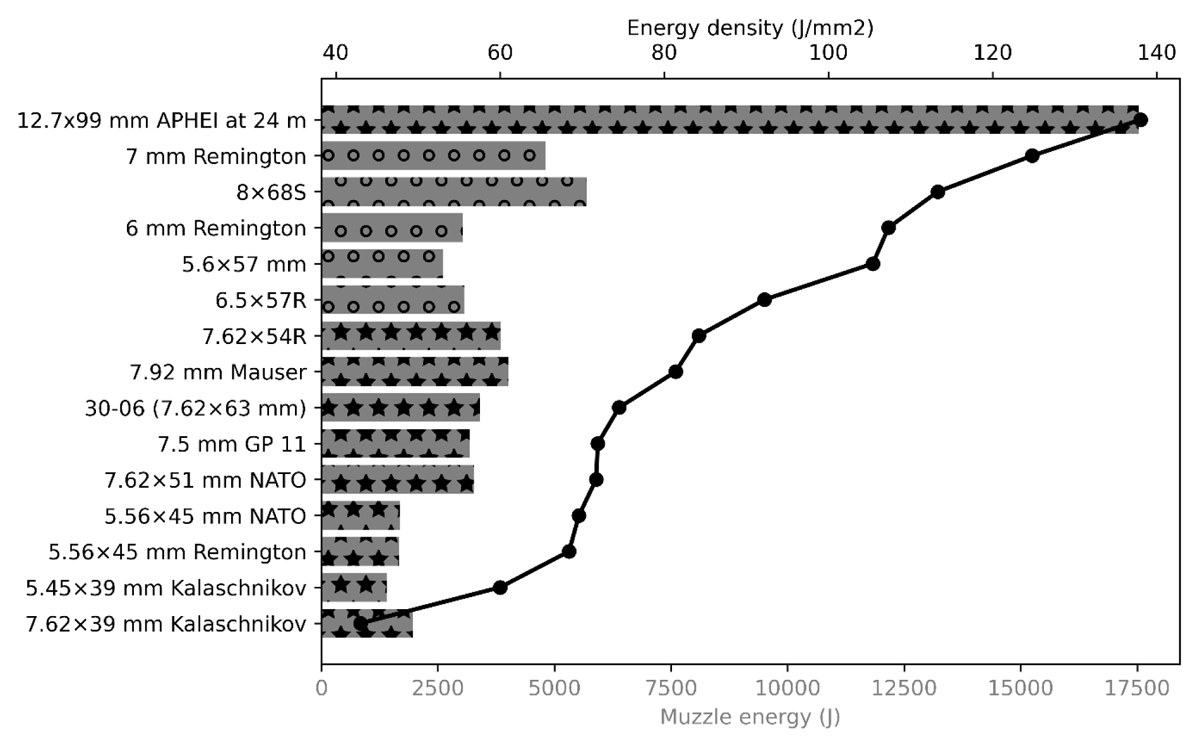
Figure 1
Muzzle energy and energy density for different calibers used by armed forces (★) or by hunters (o).
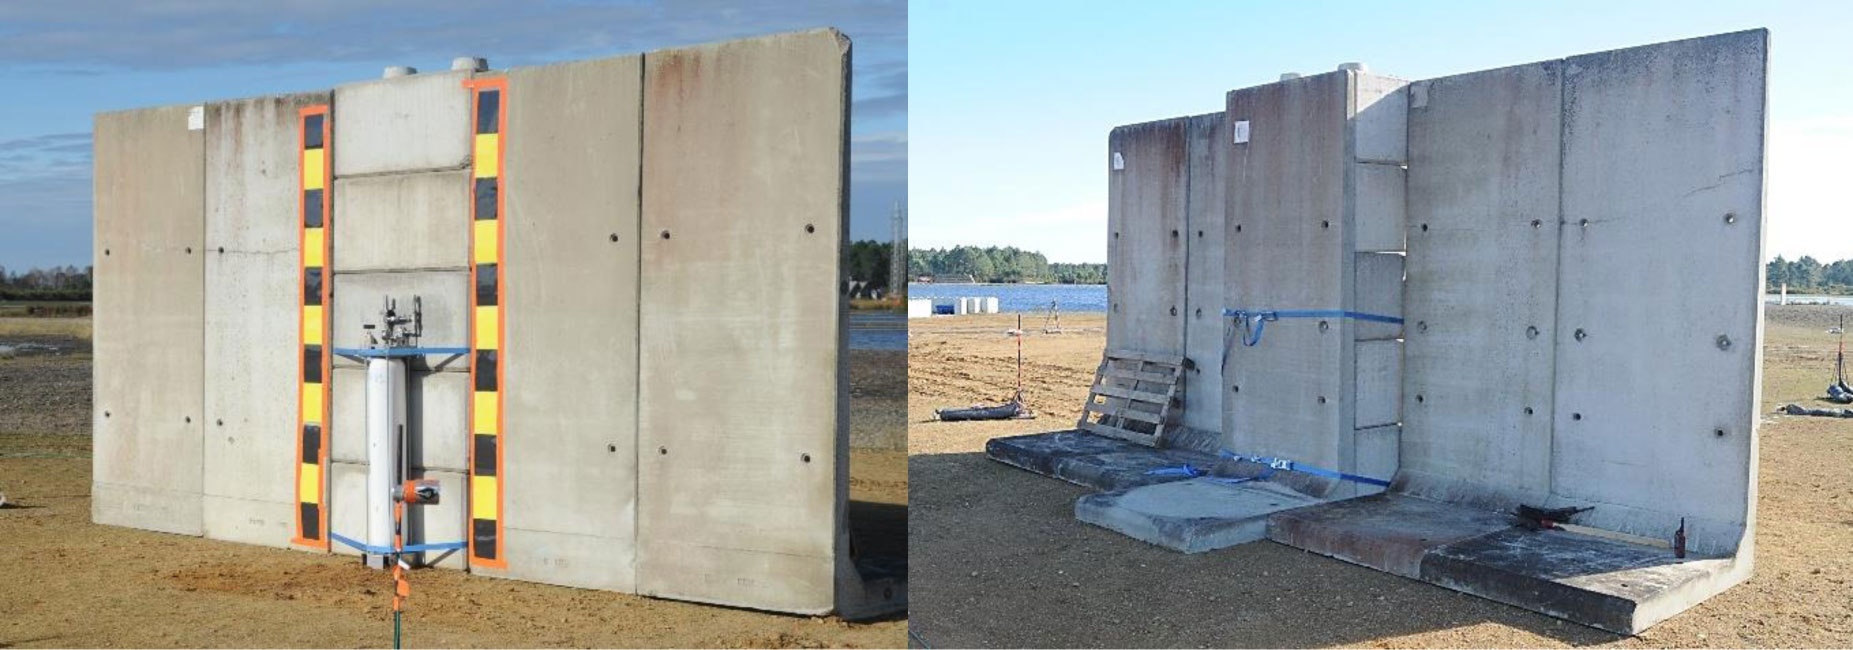
Figure 2
Concrete blocks at the back of the hydrogen tanks—left: front view with a Type I tank. Right: rear view.
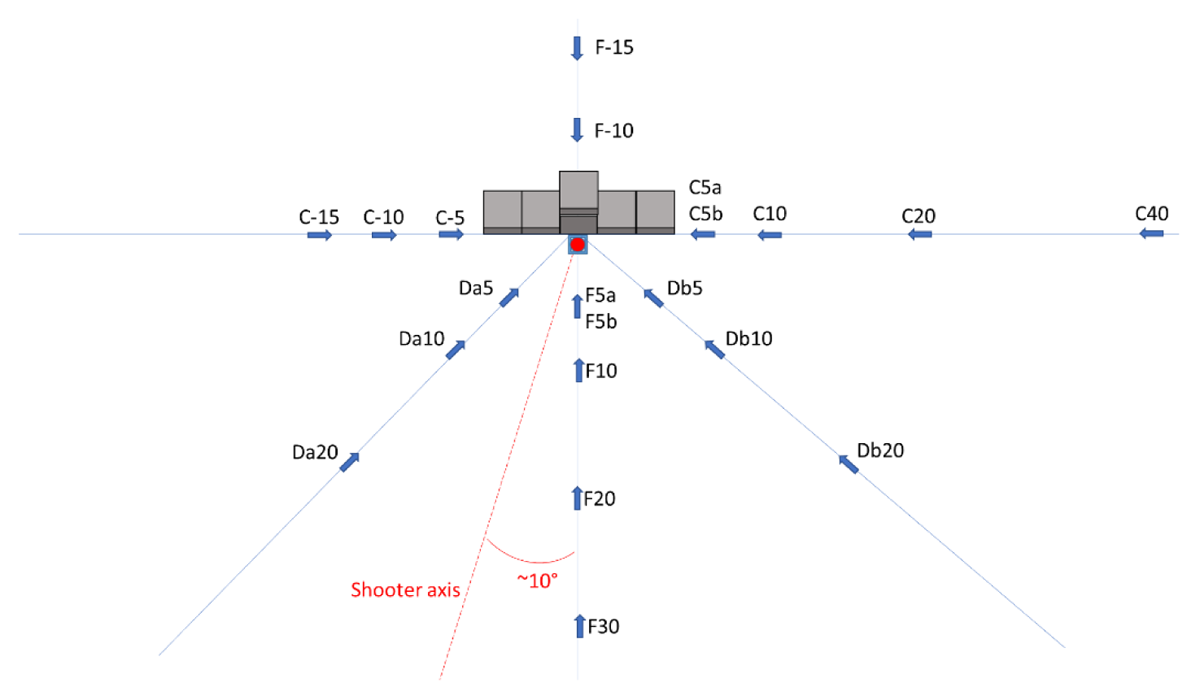
Figure 3
Target’s overall layout with hydrogen tank (red disk), pressure sensors, and shooter axis.
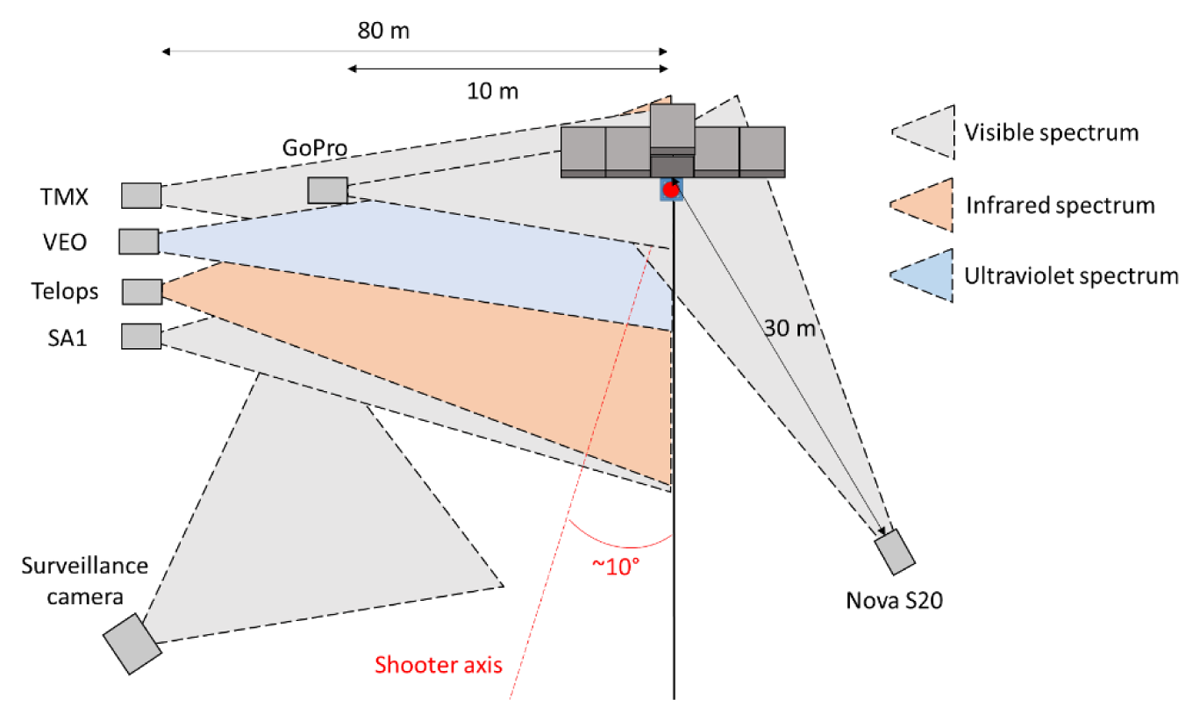
Figure 4
Layout and field of visions of the different cameras.
Table 1
Characteristics of tested CGH2 tanks.
| TANK TYPE | VOLUME (L) | PRESSURE (BARG) | SIZE OUTSIDE DIAMETER, LENGTH, THICKNESS (mm) |
|---|---|---|---|
| Type I | 32 | 490–505 | 227, 1265, 14.3 |
| Type IV | 200 | 475–480 | 480, 2175, N.P. |
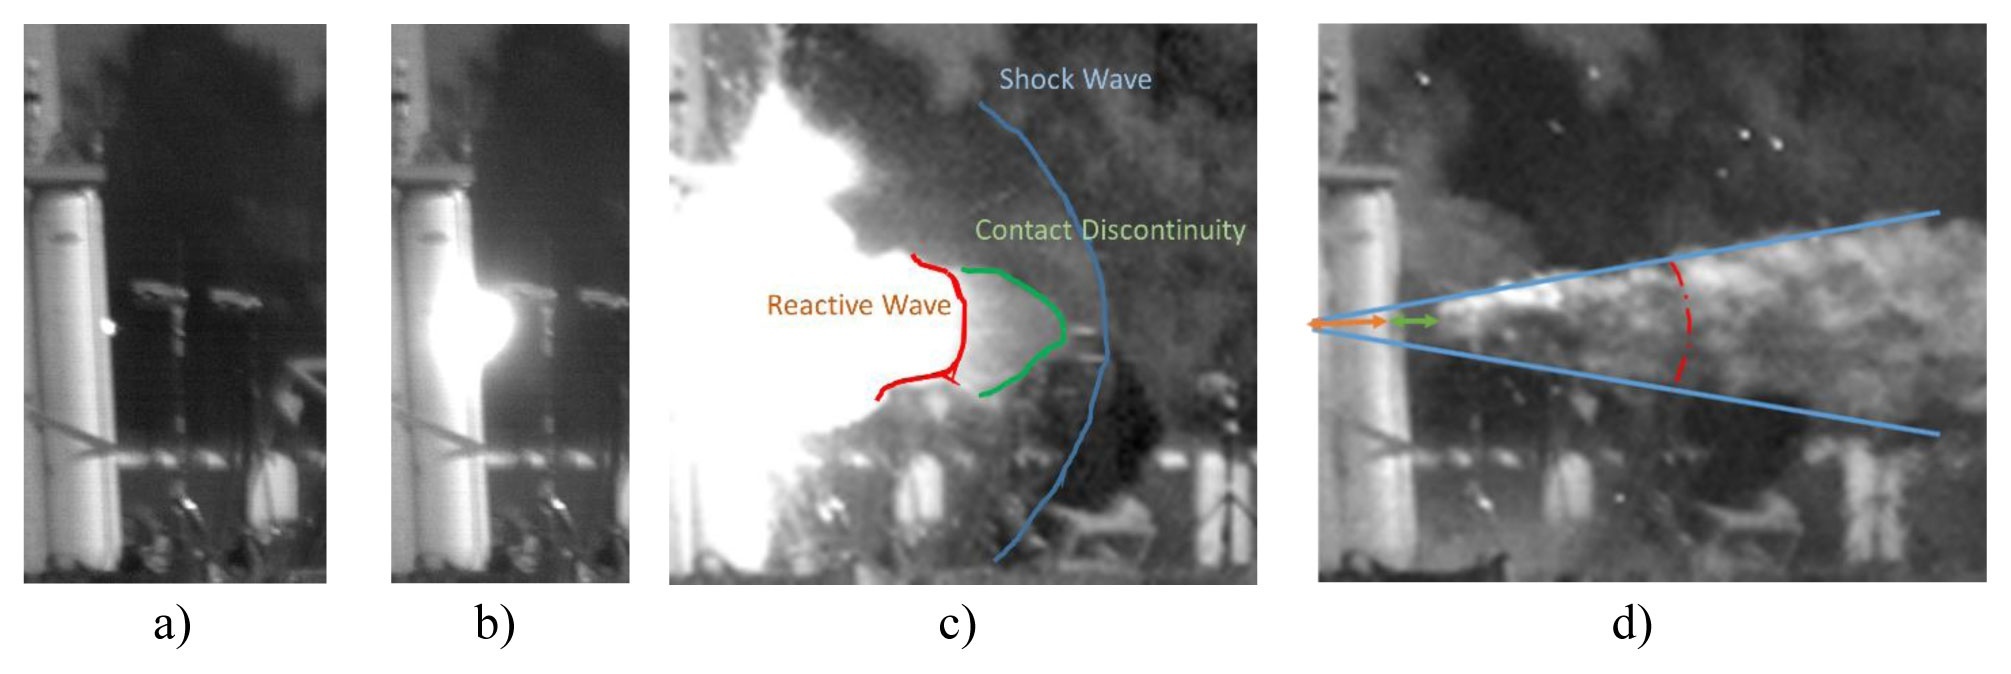
Figure 5
Sequence of events during the development of a jet fire for Type I tanks (TMX Camera).
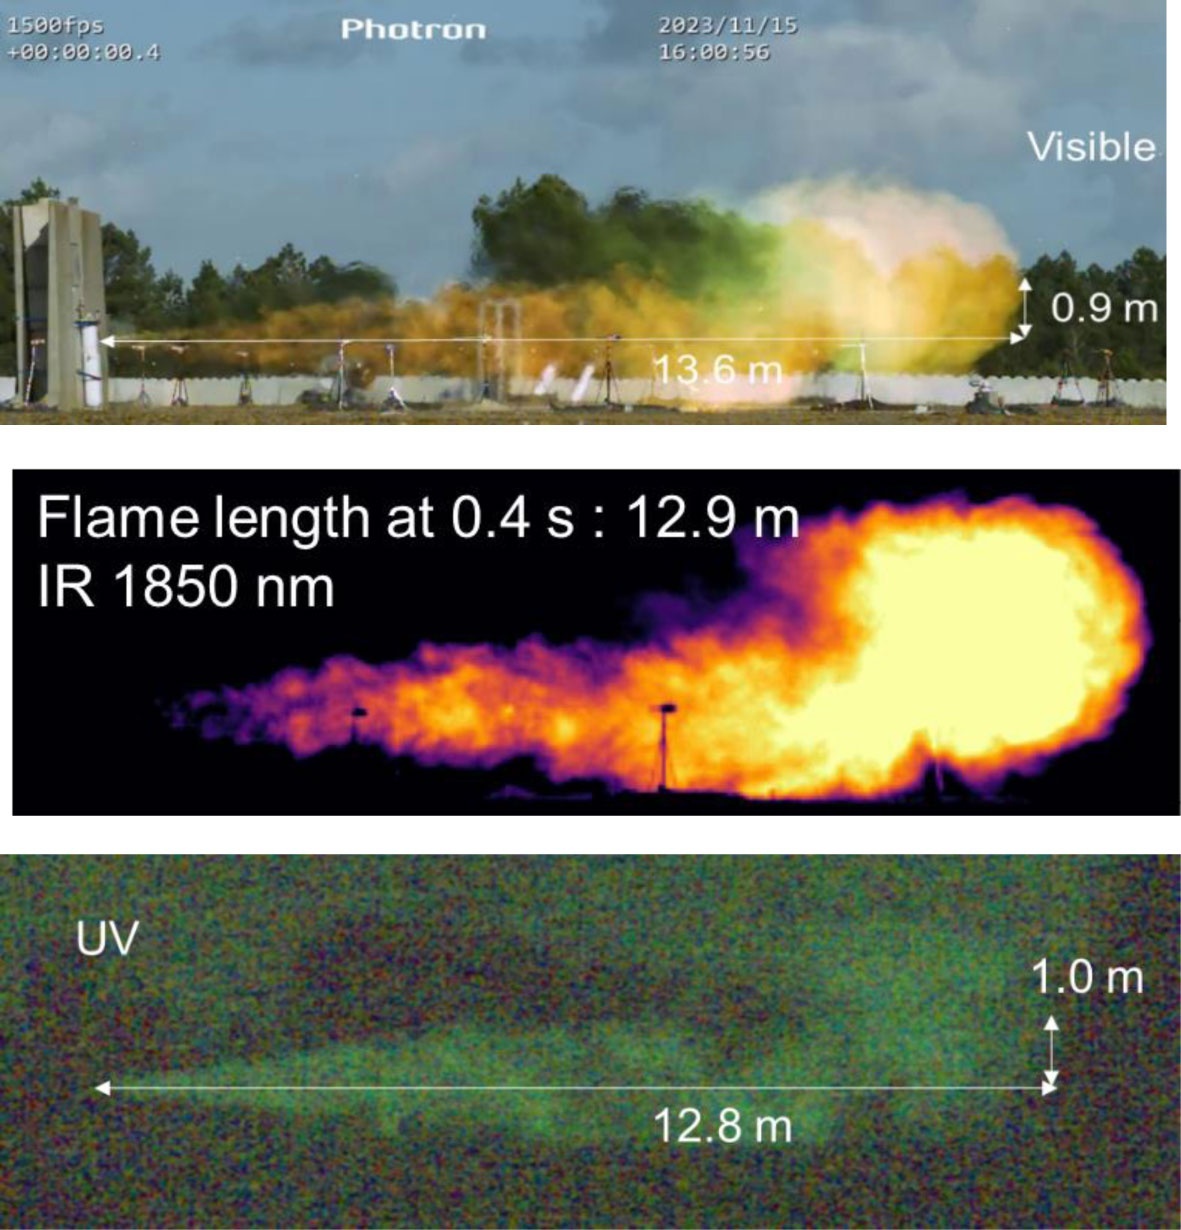
Figure 6
Comparison of jet-fire shapes seen from different wavelengths at the same time point (visible SA1, TELOPS IR @ 1850 nm, VEO UV @ 307 nm).
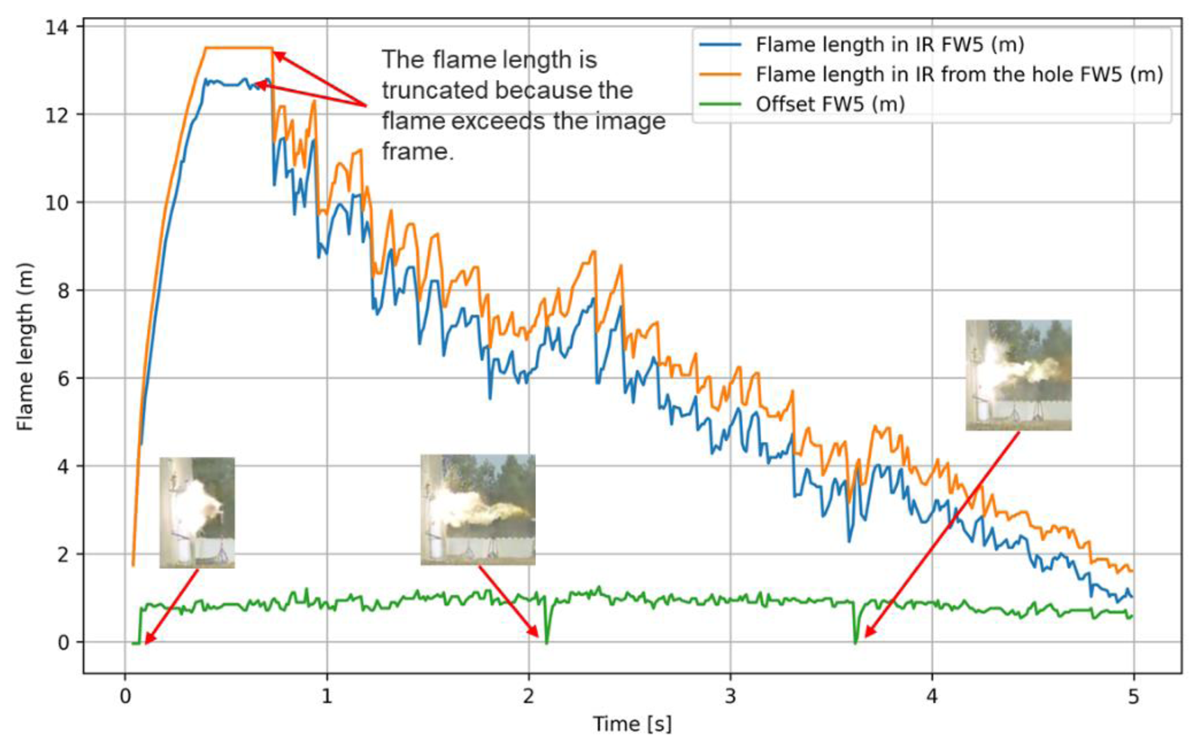
Figure 7
Flame length over time recorded by the IR camera with the 1850 nm filter.
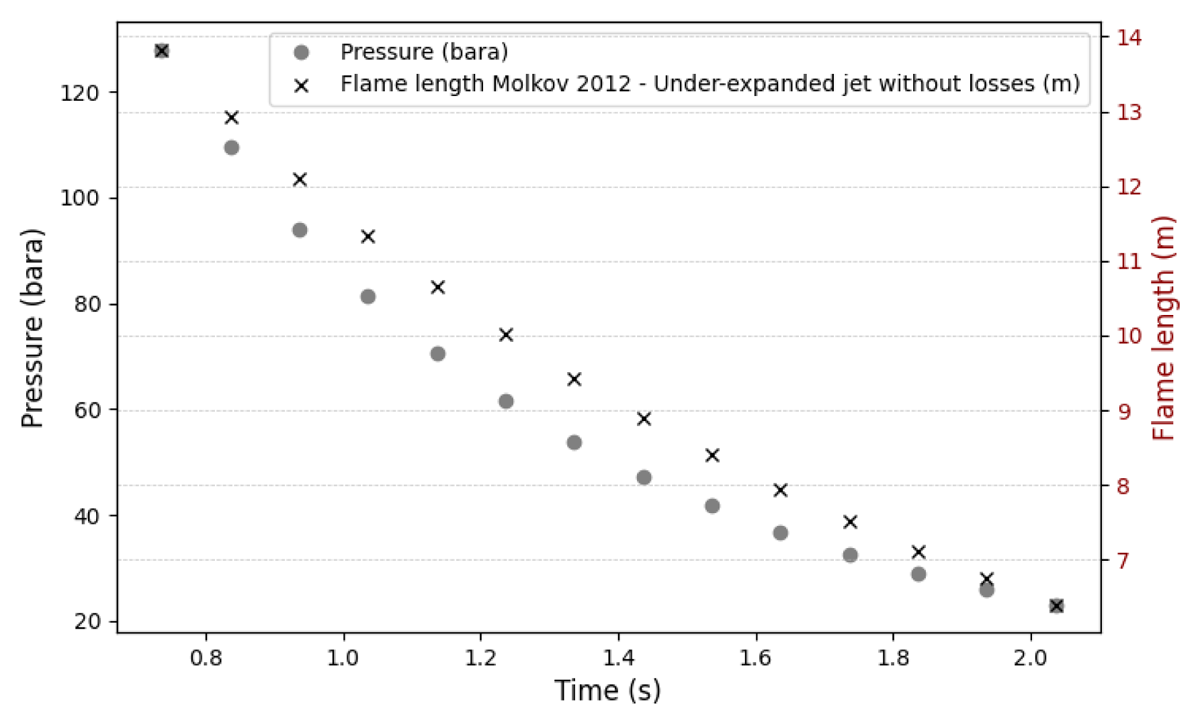
Figure 8
Flame length estimation with Molkov and Saffers’ (2013) model during the blowdown at an initial pressure of 491 bara with a leak diameter of 8 mm.
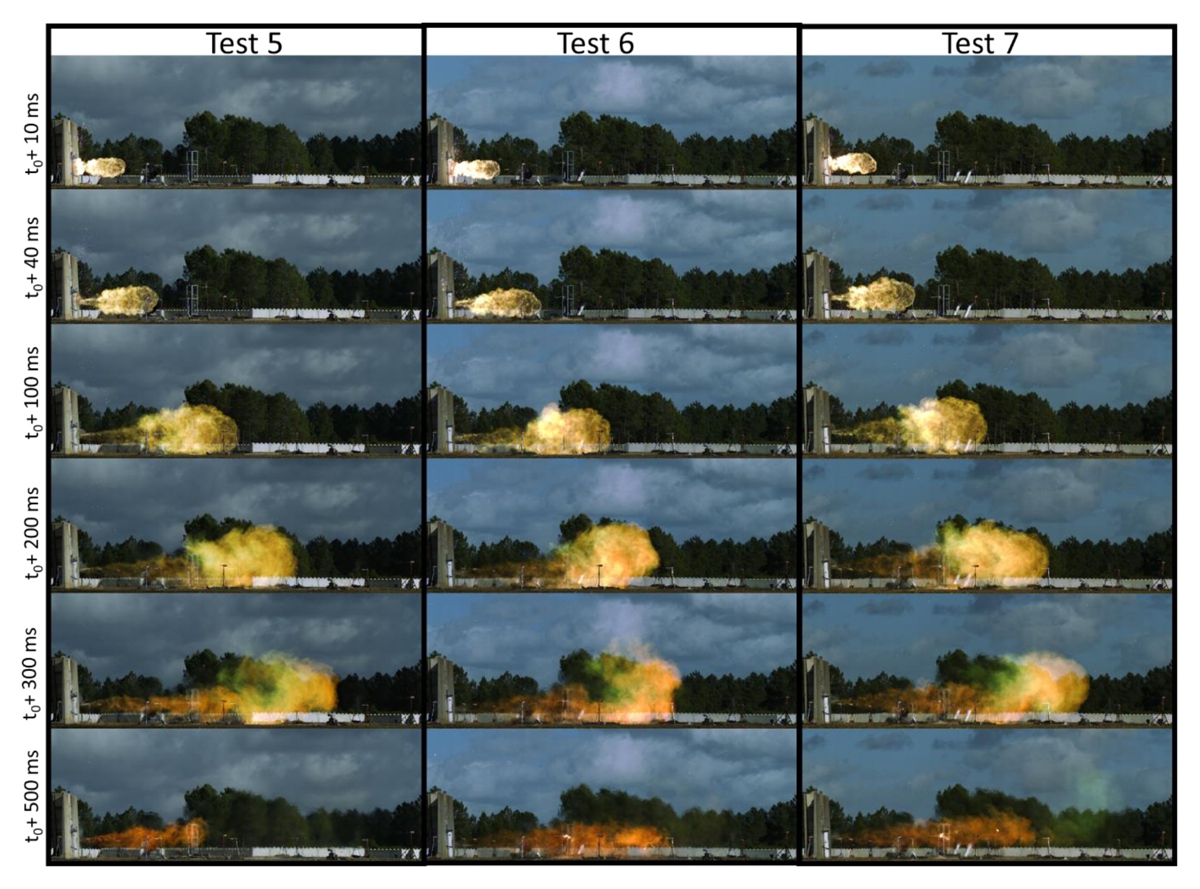
Figure 9
Development of the jet fire during three different tests.
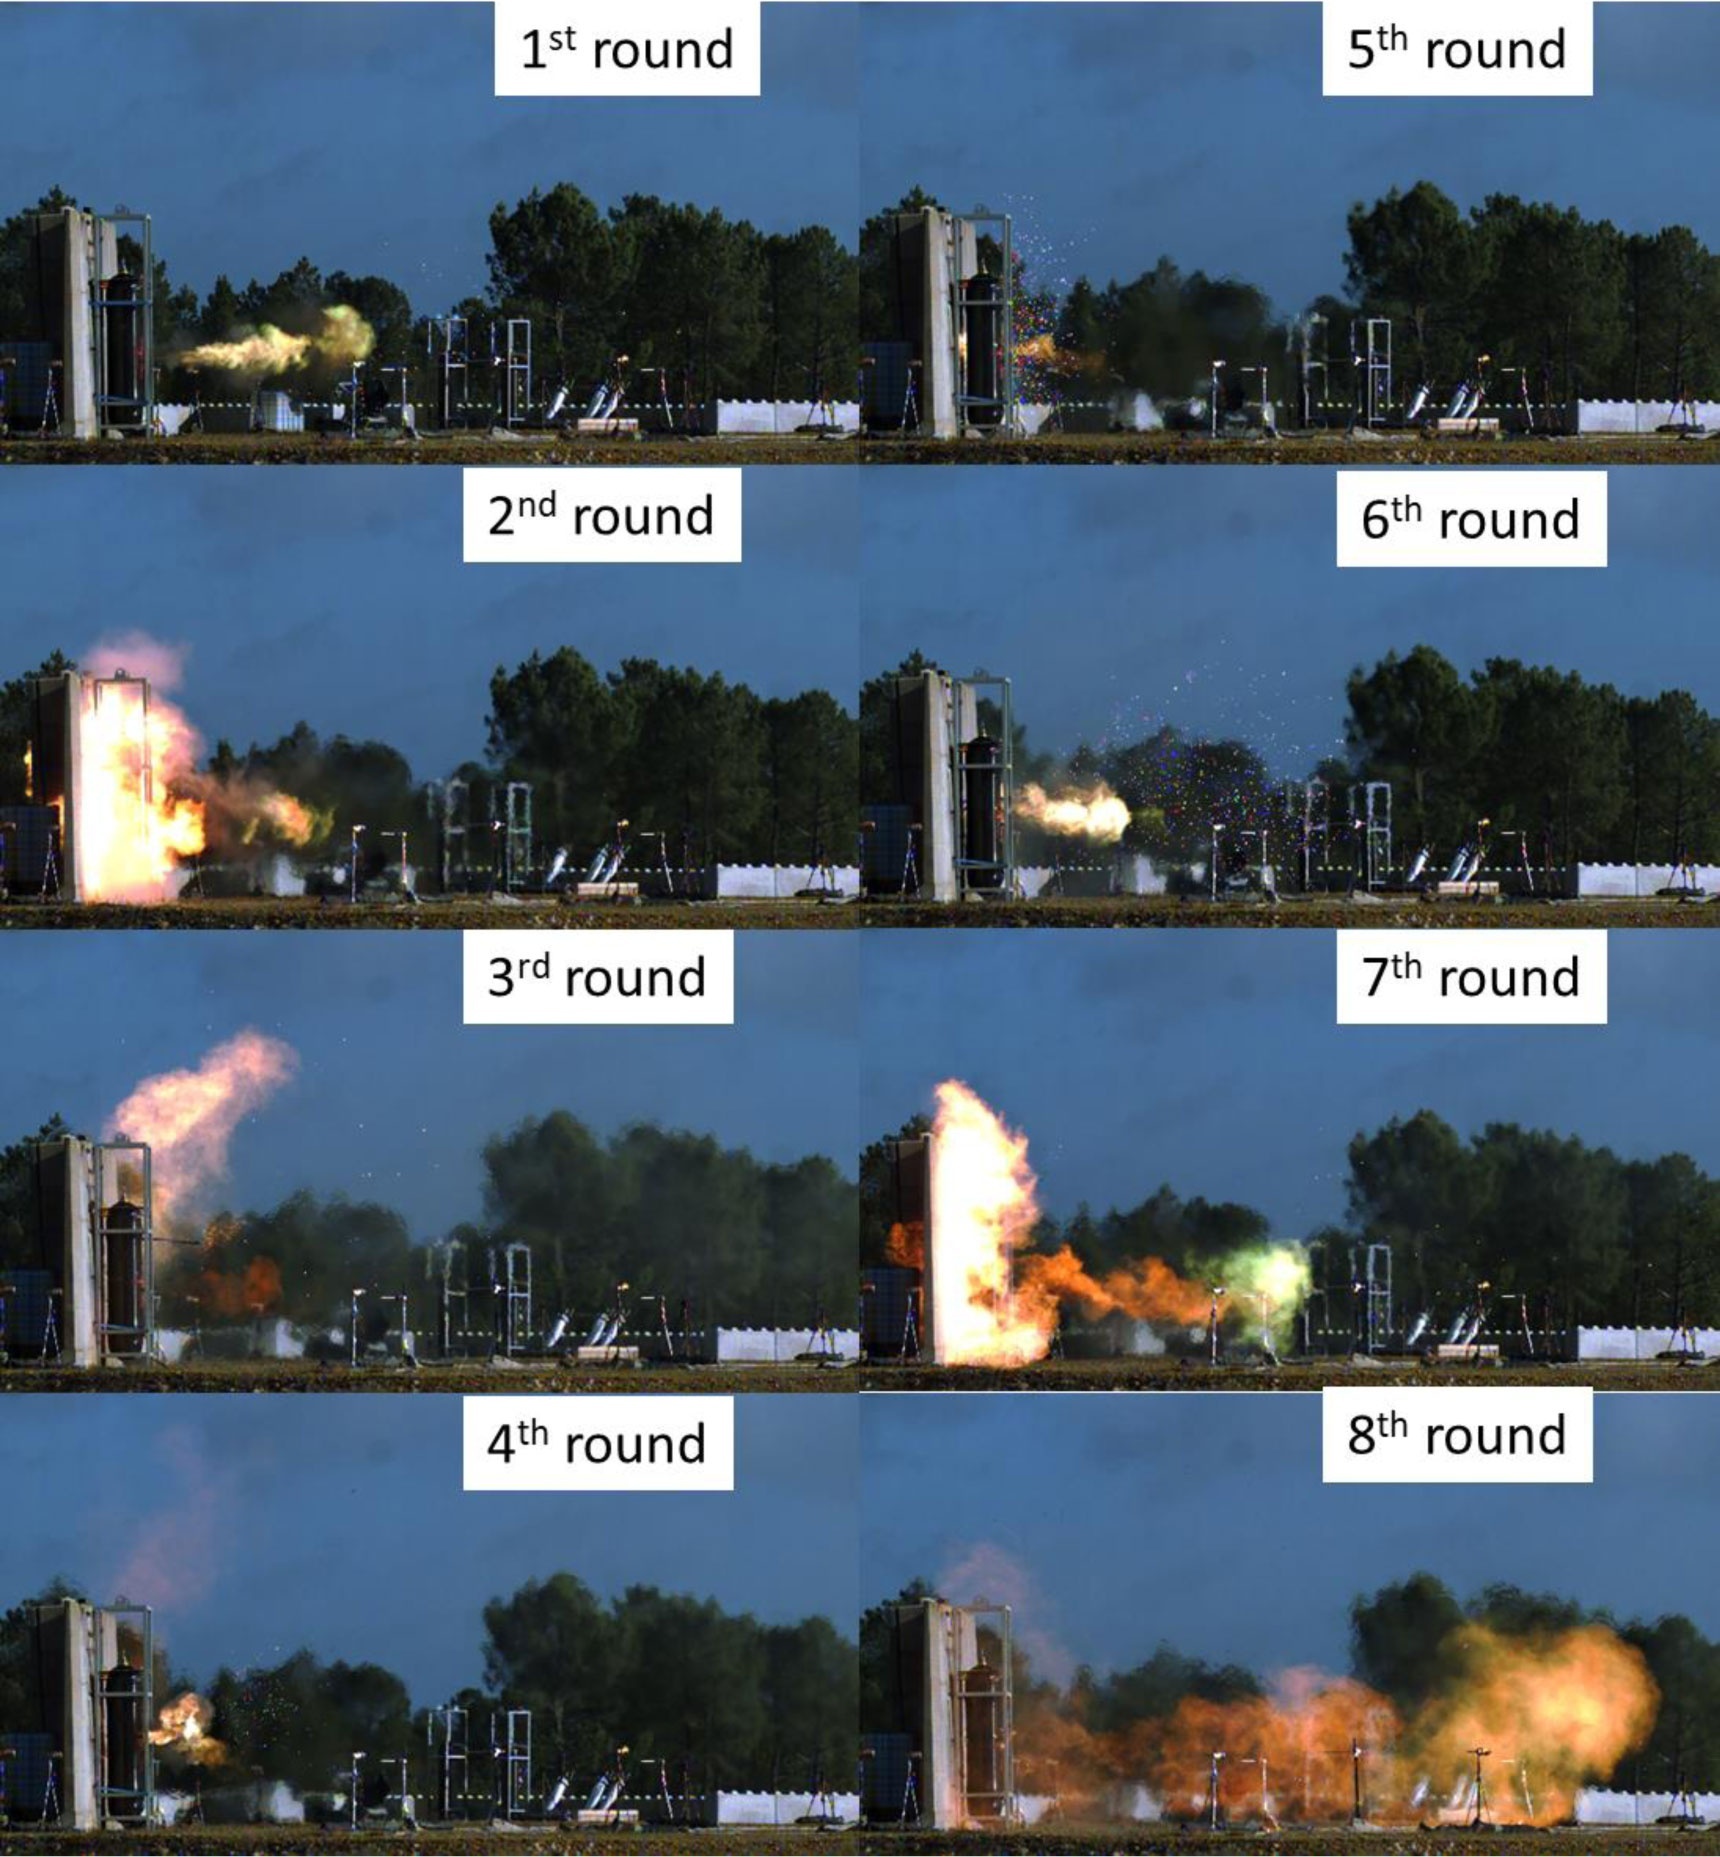
Figure 10
Sequence of events during consecutive API rounds.
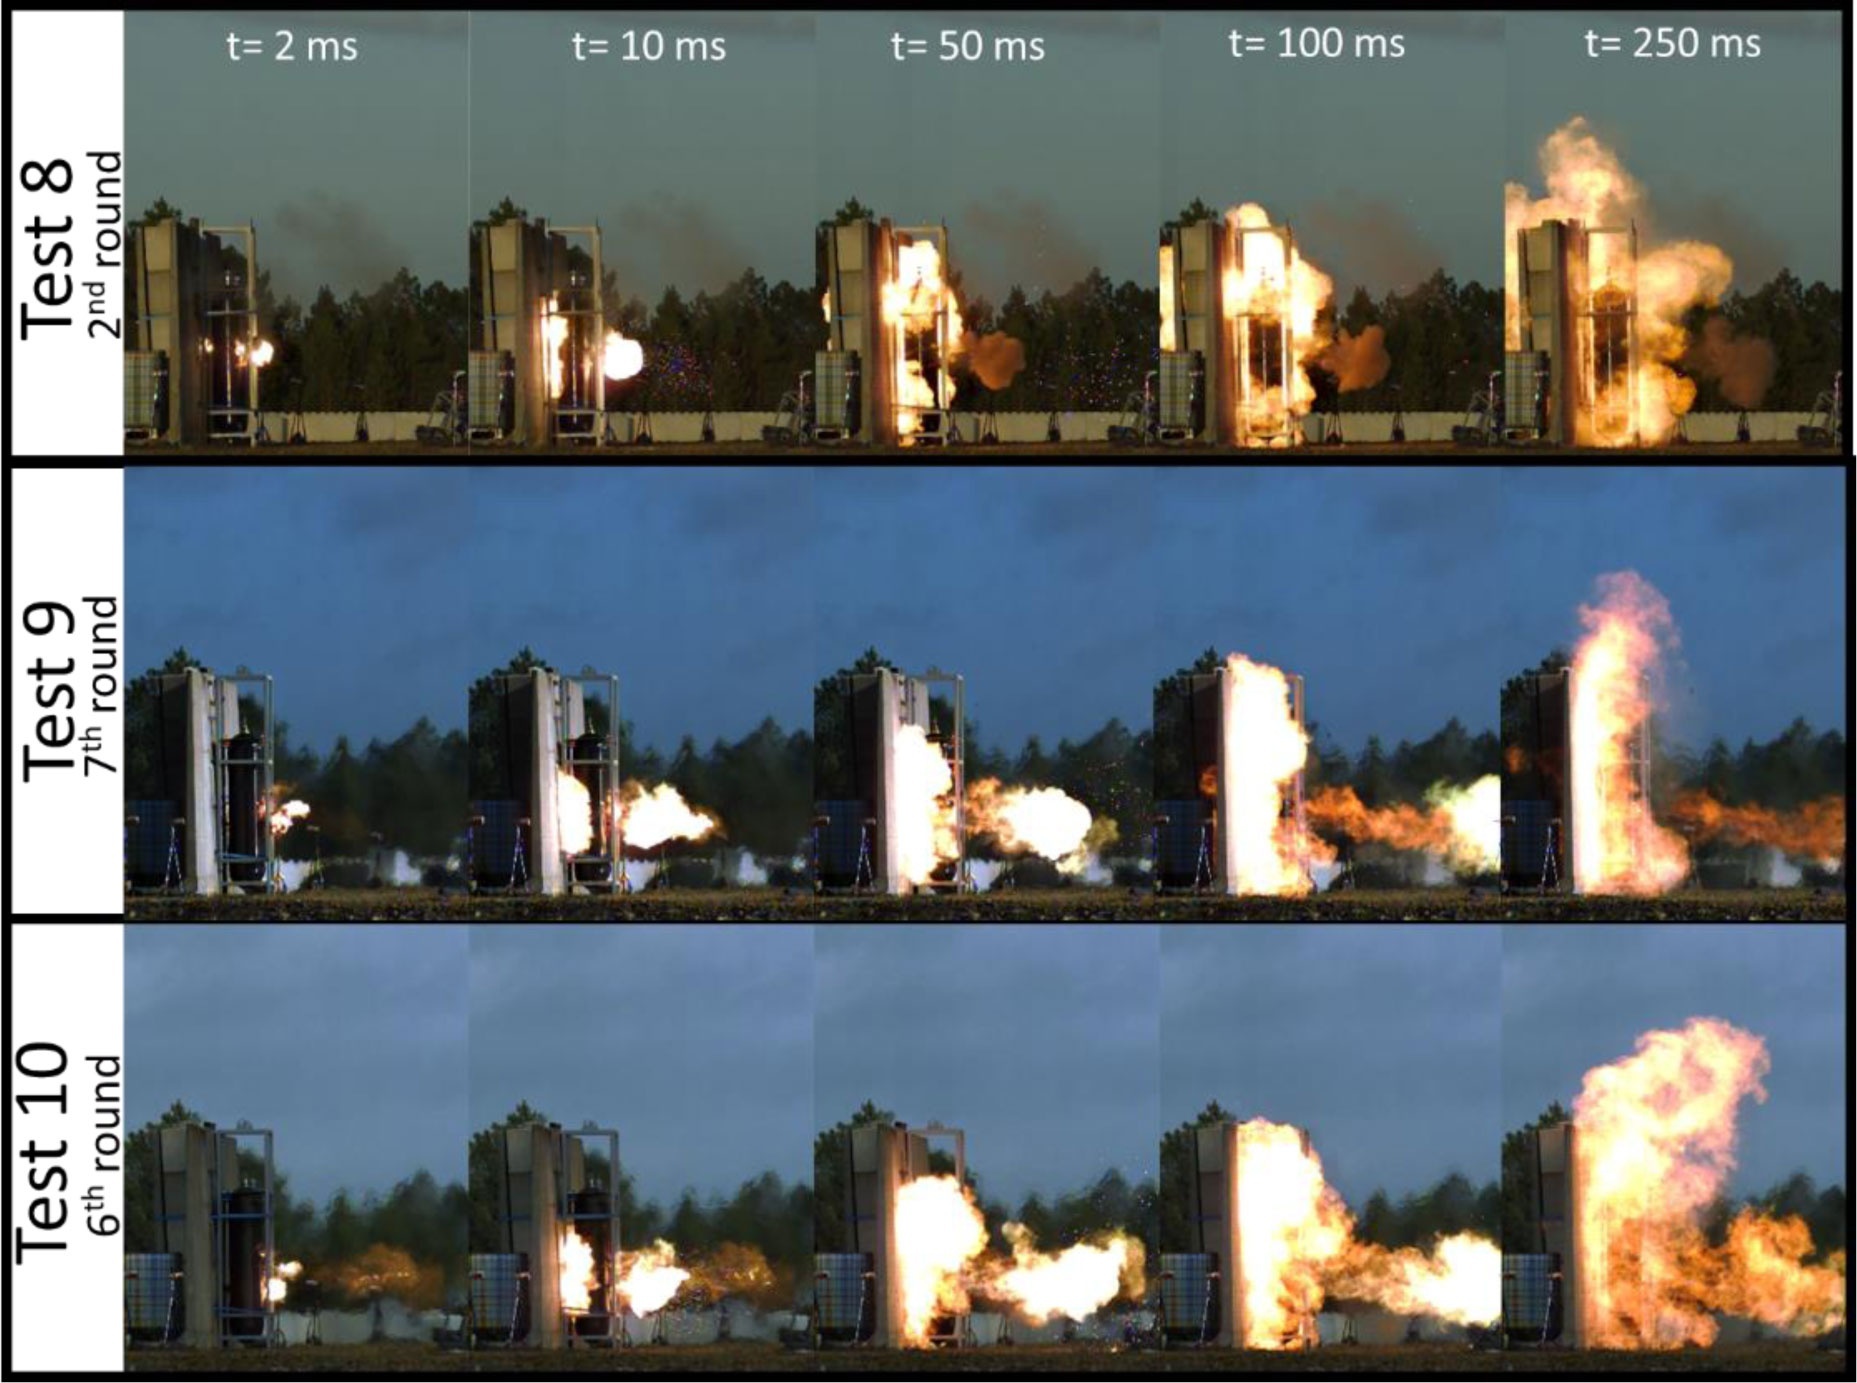
Figure 11
Evolution of a flashover following bullet impact in three different tests.
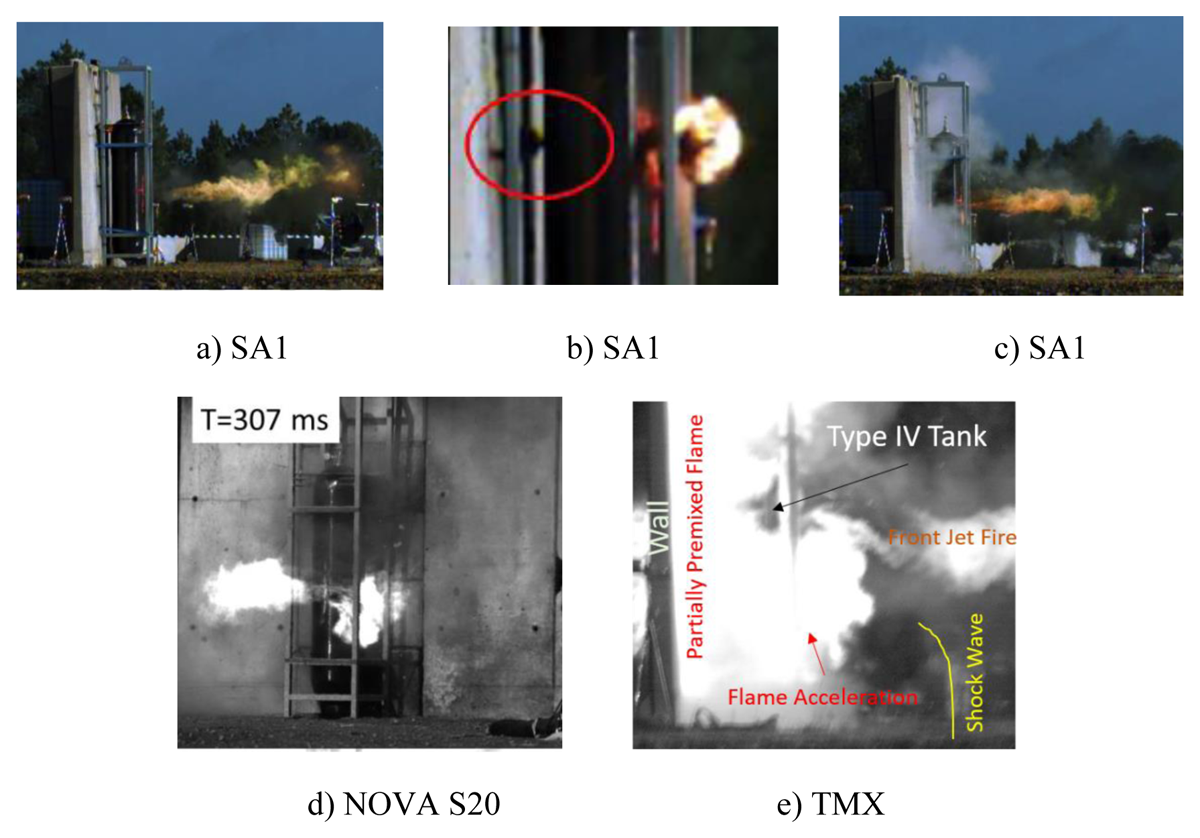
Figure 12
Sequence of events leading to a deflagration.