
| A | Area in m2 | lf | Flame length in m |
| ap | Planck-mean absorption coefficient | p | Pressure in bar (absolute) |
| C* | Non-dimensional radiant power | Qrad | Thermal radiation in W/m2 |
| df | Flame diameter in m | Re | Distance between radiation sensor and point source in m |
| D | Outlet diameter in m | Rs | Vertical distance between radiation sensor and release point |
| f | Frequency in 1/s | SEP | Surface emissive power in W/m2 |
| fs | Stochiometric mass fraction fuel | t | Time in s |
| ΔHc | Lower heating value in MJ/kg | T | Temperature in °C |
| Maj | Mach number in the expanded jet unitless | uj | Exit velocity of the expanded jet in m/s |
| ṁ | Mass flow in kg/s | uw | Wind velocity in m/s |
| N | Number of point sources | xRAD | Radiant heat fraction unitless |
| L | Length in m | x,y,z | Coordinates in m |
| Greek | |||
| λ | Wavelength in µm | ϕ | View Factor unitless |
| ρf | Density of the flame in kg/m3 | τ | Transmissivity unitless |
| ρ0 | Density of cold fuel in kg/m3 | τR | Residence time in ms |
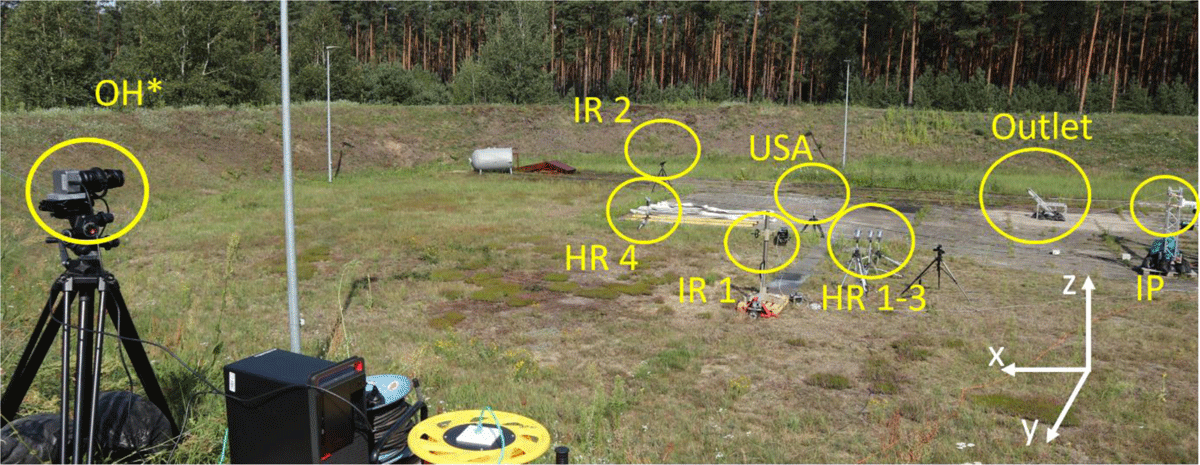
Figure 1
measuring equipment in free field at the test area.
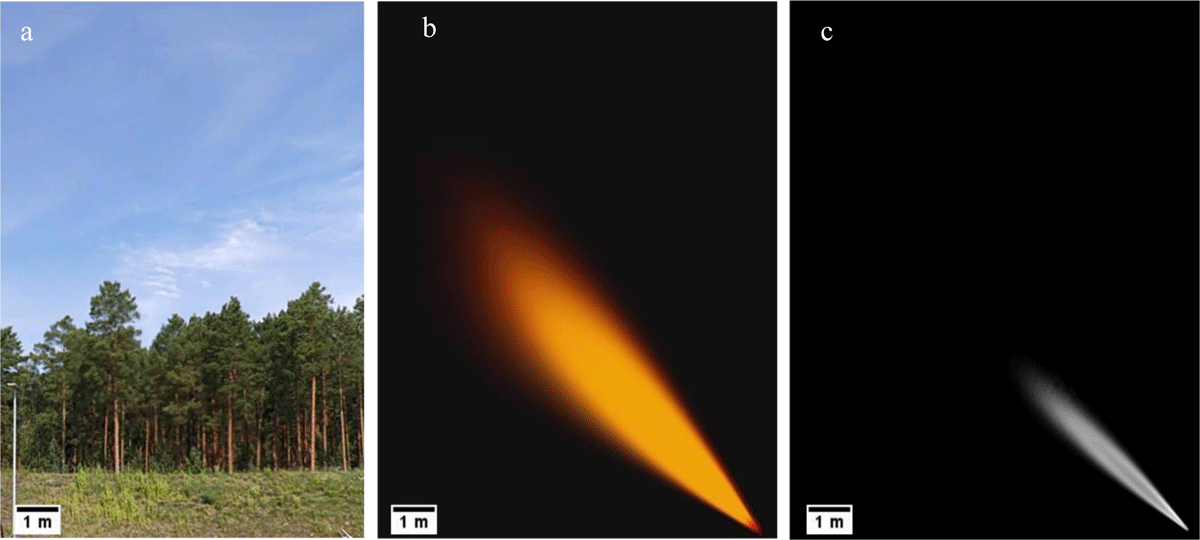
Figure 2
Comparison of the recording of a hydrogen jet flame with digital camera (a), time averaged IR camera (b) and time averaged OH* camera (c). The hydrogen flame is not detectable by visible light in open field conditions. The flame lengths estimated by IR and OH* measurements significantly differ.
Table 1
Position of measurement equipment in the open field.
| POSITION OUTLET NOZZLE (0|0|0) | IR 1 | IR 2 | OH* | IP | USA | HR1 | HR2 | HR3 | HR4 |
|---|---|---|---|---|---|---|---|---|---|
| x in m | 6 | 0 | 0 | –2 | 8 | 3.46 | 3.46 | 3.46 | 6.5 |
| y in m | 18 | 17 | 34 | 8 | 11 | 12.31 | 14.31 | 16.61 | 11 |
| z in m | 0,47 | 0,6 | 2 | 0,6 | 0.5 | –0.26 | 0.16 | 0.34 | –0.26 |
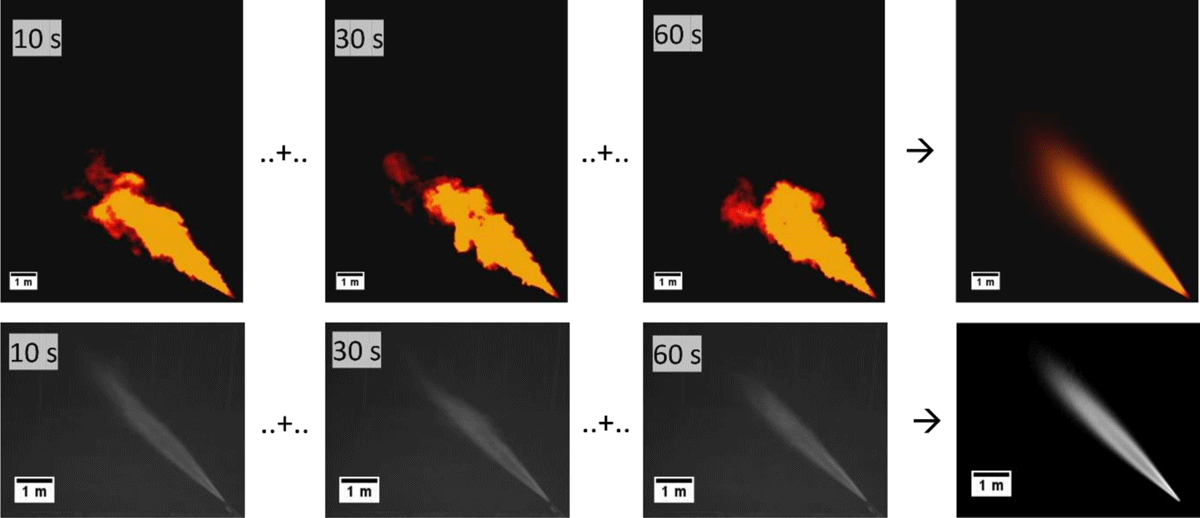
Figure 3
Schematic overview of averaging the individual IR (top line) and OH* (bottom line) images to generate a times average (stationary) flame image over the test duration.
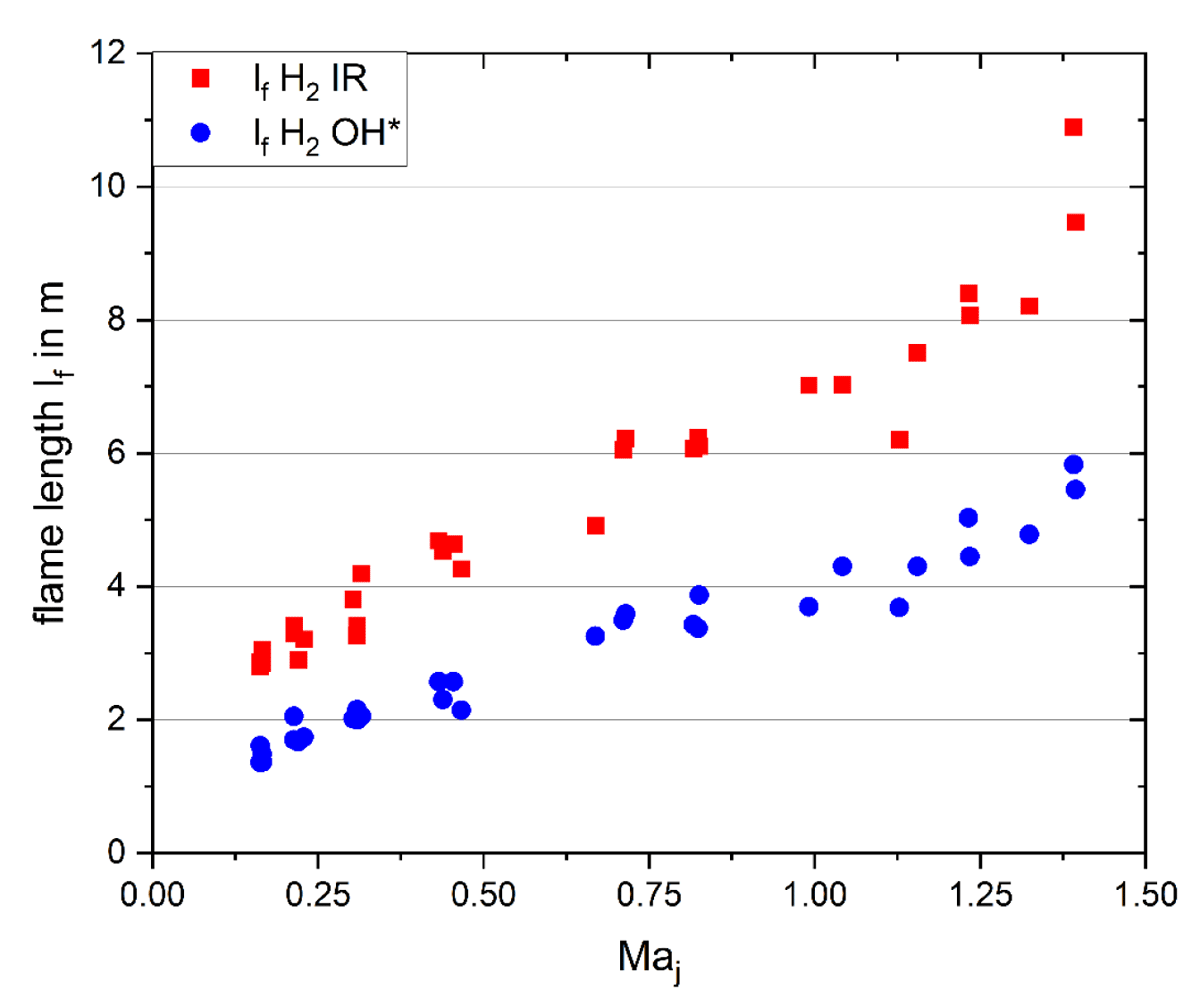
Figure 4
Comparison of hydrogen flame length determined by IR and OH* camera over the outlet Mach number Maj.
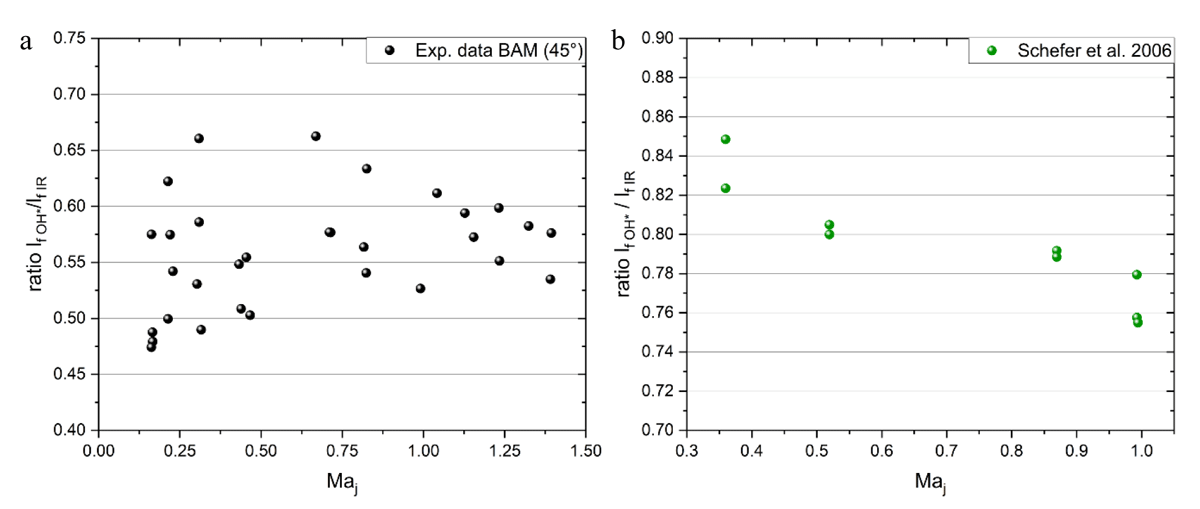
Figure 5
Comparison between experimental determined ratio of flame length OH*/IR (a) and the ratio of flame length OH*/IR by Schefer et al. (b) shown over the outlet Mach number Maj.
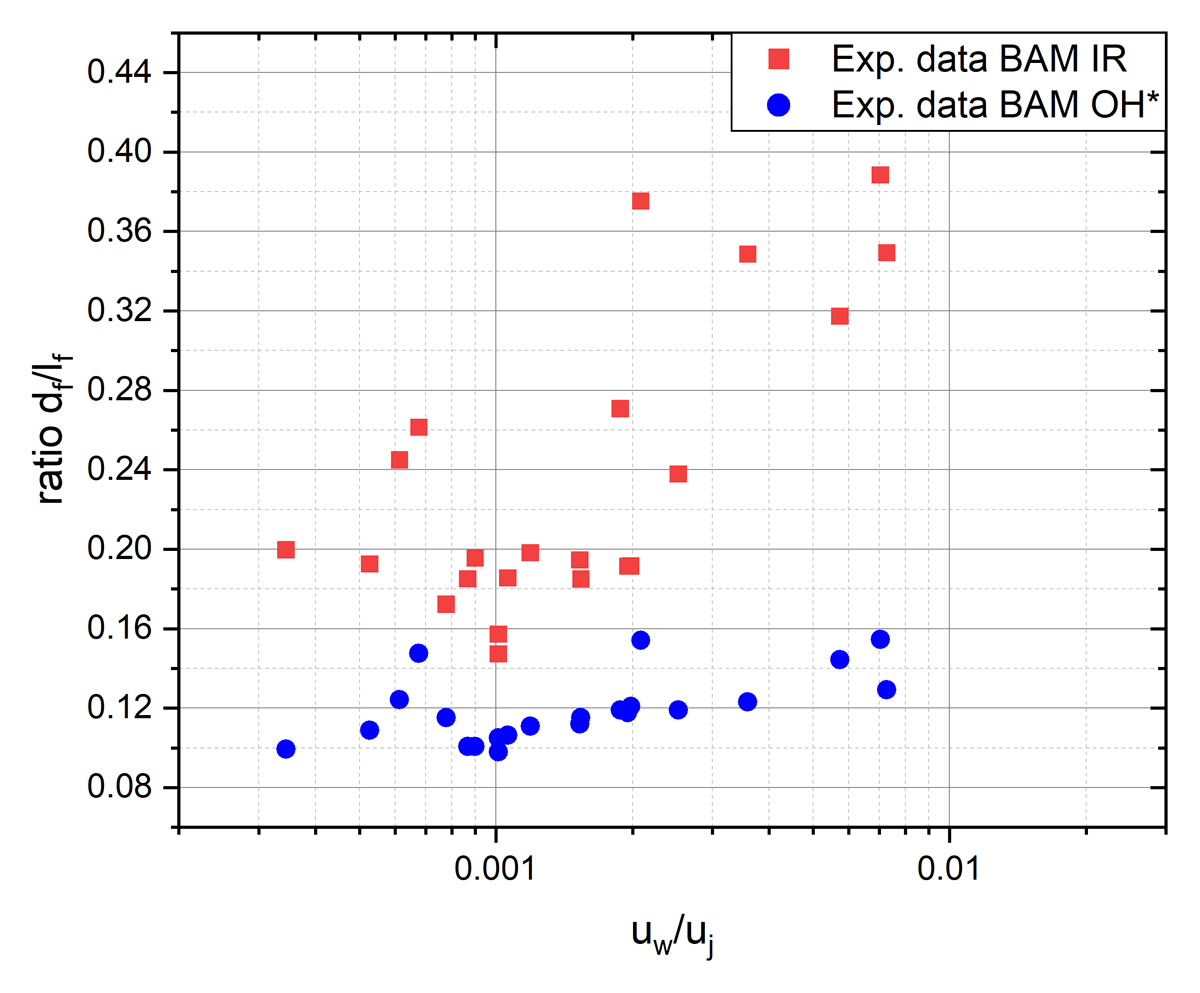
Figure 6
Comparison of ratio flame diameter to flame length for OH* and IR plotted over the ratio wind velocity to outlet velocity.
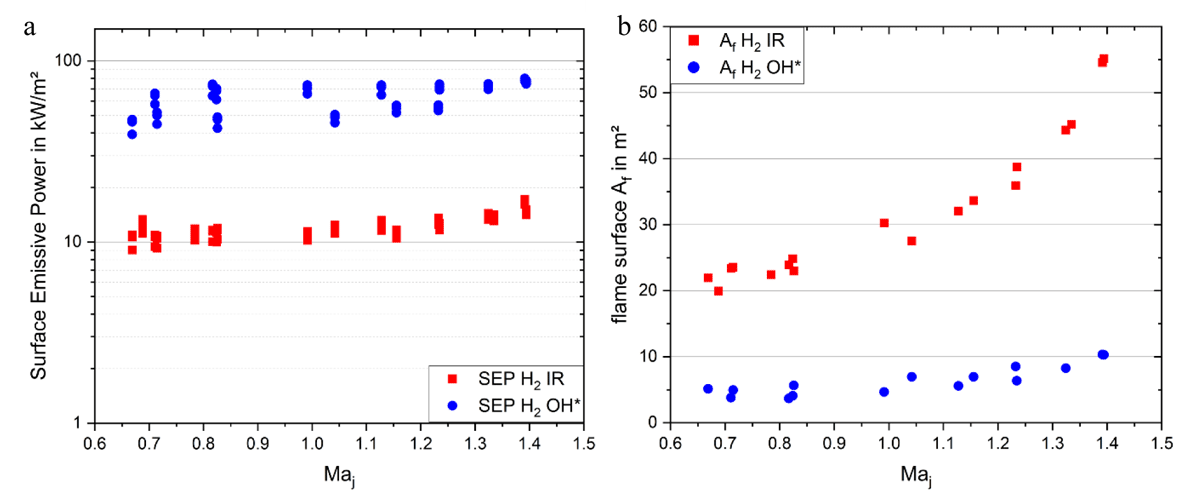
Figure 7
Comparison of (a) Surface Emissive Power and (b) flame surface area of hydrogen jet flames determined using IR (red) and OH* (blue), results are plotted against the expanded outlet Mach number, Maj.
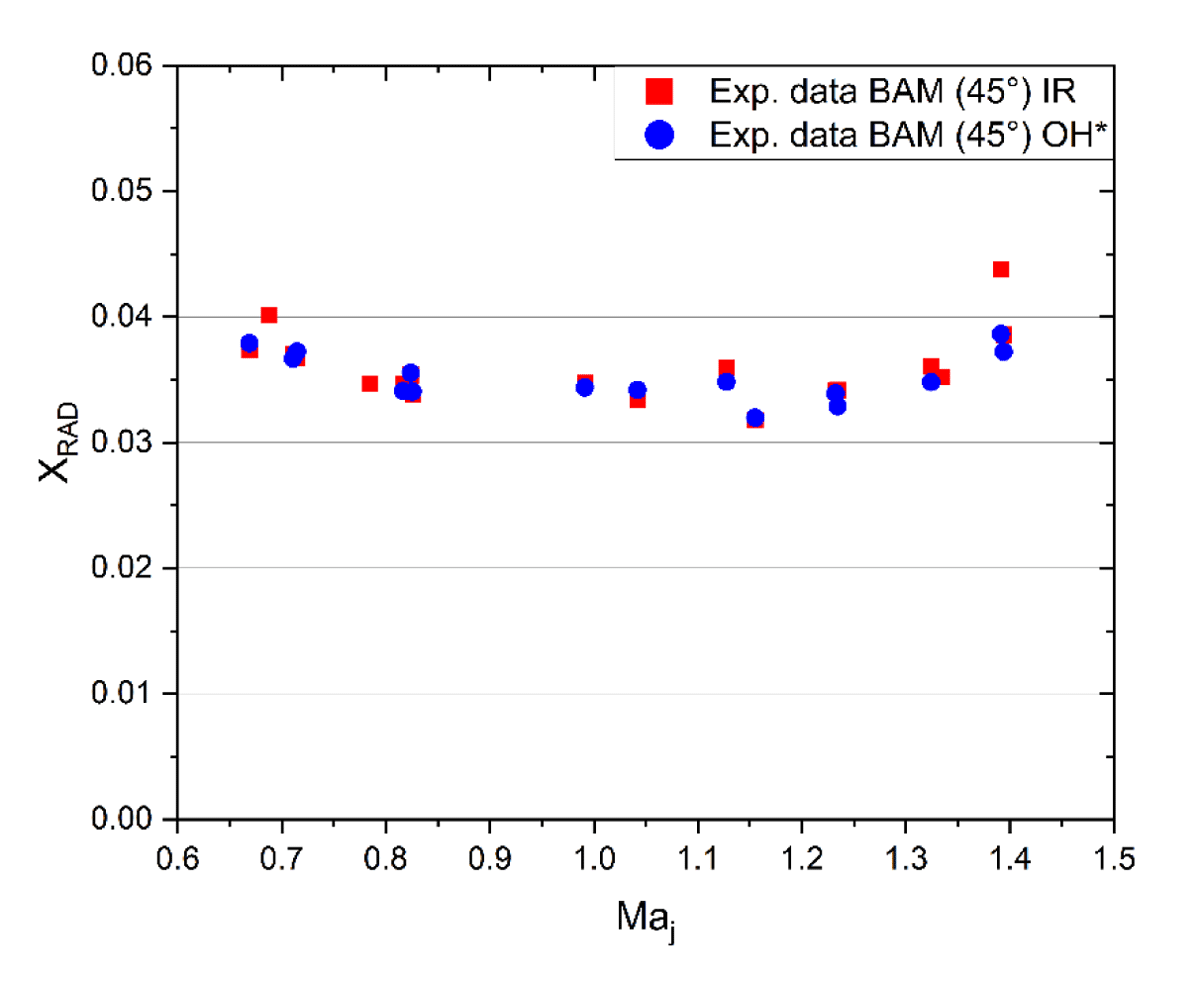
Figure 8
Experimental determined radiant heat fraction determined with OH* and IR measurement over the Mach number Maj.
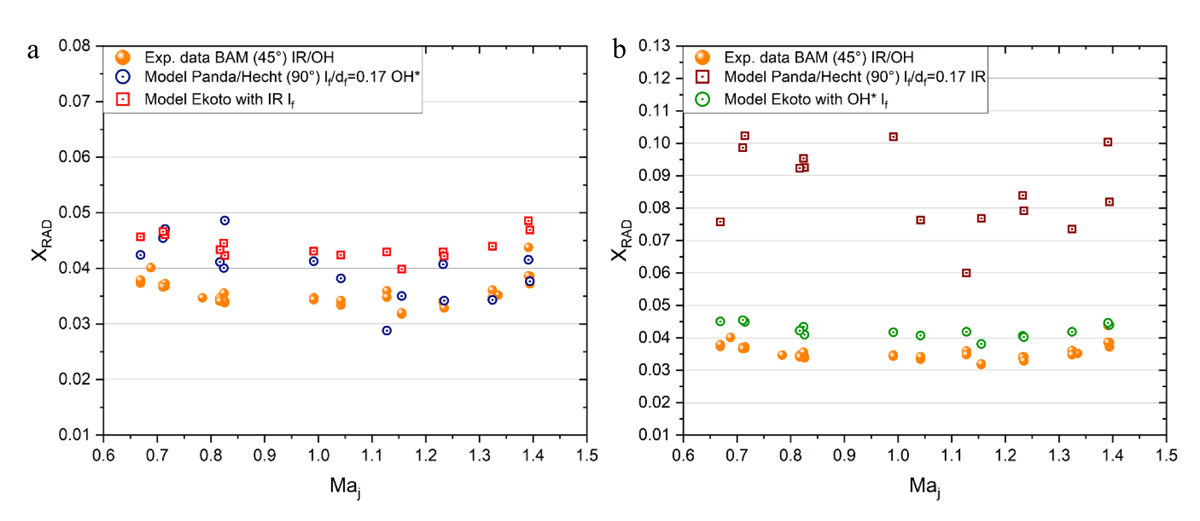
Figure 9
Comparison between experimental determined radiant heat fractions to model of Panda and Hecht using OH* and Ekoto using IR data (a) and Panda and Hecht using IR and Ekoto using OH* (b). The data is plotted against the Mach number Maj.