
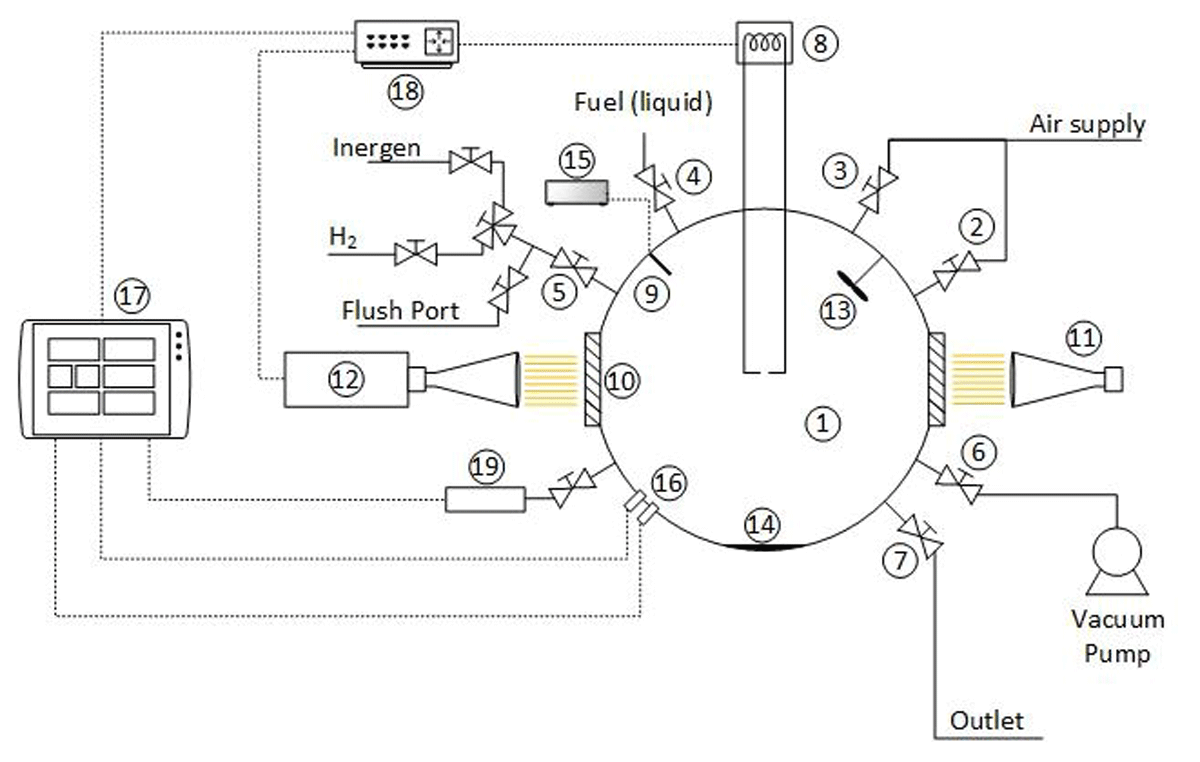
Figure 1
Schematic of the experimental setup (Henriksen, 2021; Henriksen et al., 2021). 1: explosion chamber; 2: oxidizer inlet; 3: flush inlet; 4: fuel (liquid) injection port; 5: inlet for fuel and inert (gas); 6: vacuum port; 7: gas outlet; 8: ignition system; 9: thermocouple; 10: glass windows (100 mm); 11: LED light source; 12: high-speed camera; 13: stirrer; 14: heating plate; 15: ambient temperature display; 16: dual explosion pressure sensors; 17: data acquisition system; 18: control/trigger unit and; 19: ambient pressure sensor.
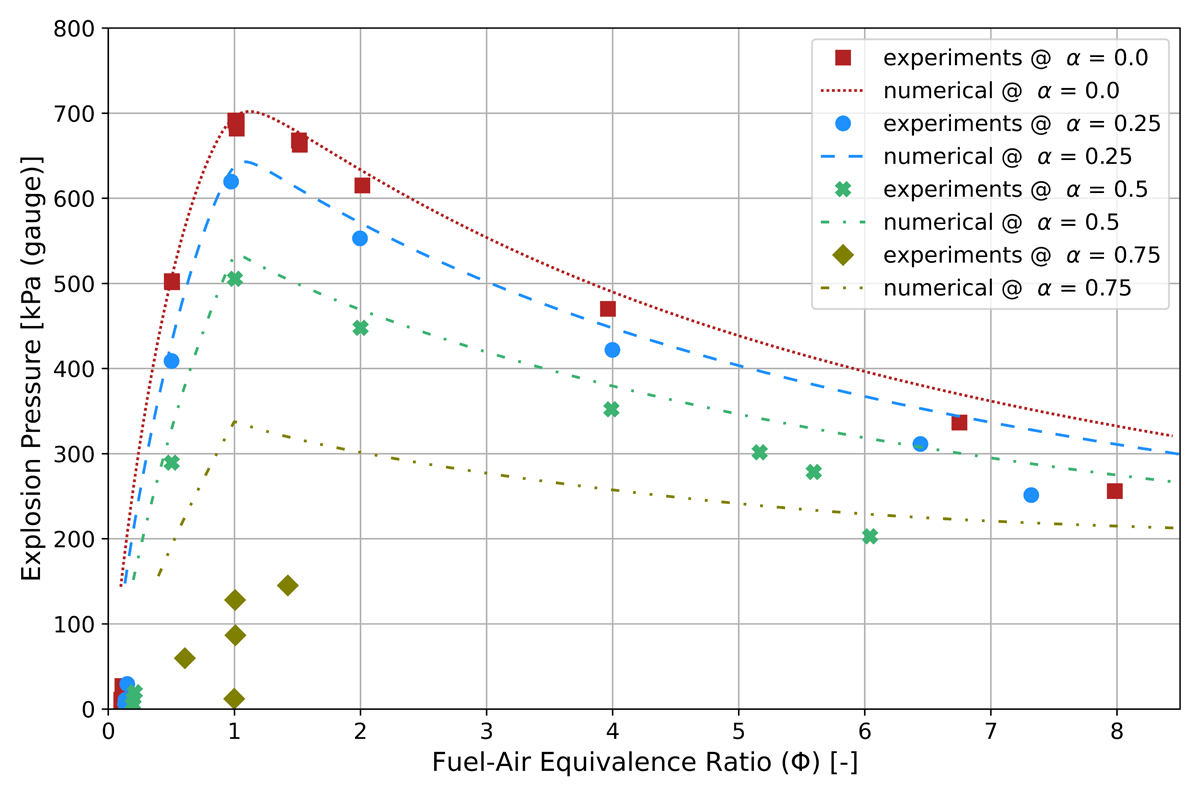
Figure 2
Experimental and numerical explosion pressure as a function of fuel-air equivalence ratios for inert-to-air relations (α) of 0, 0.25, 0.50, and 0.75.
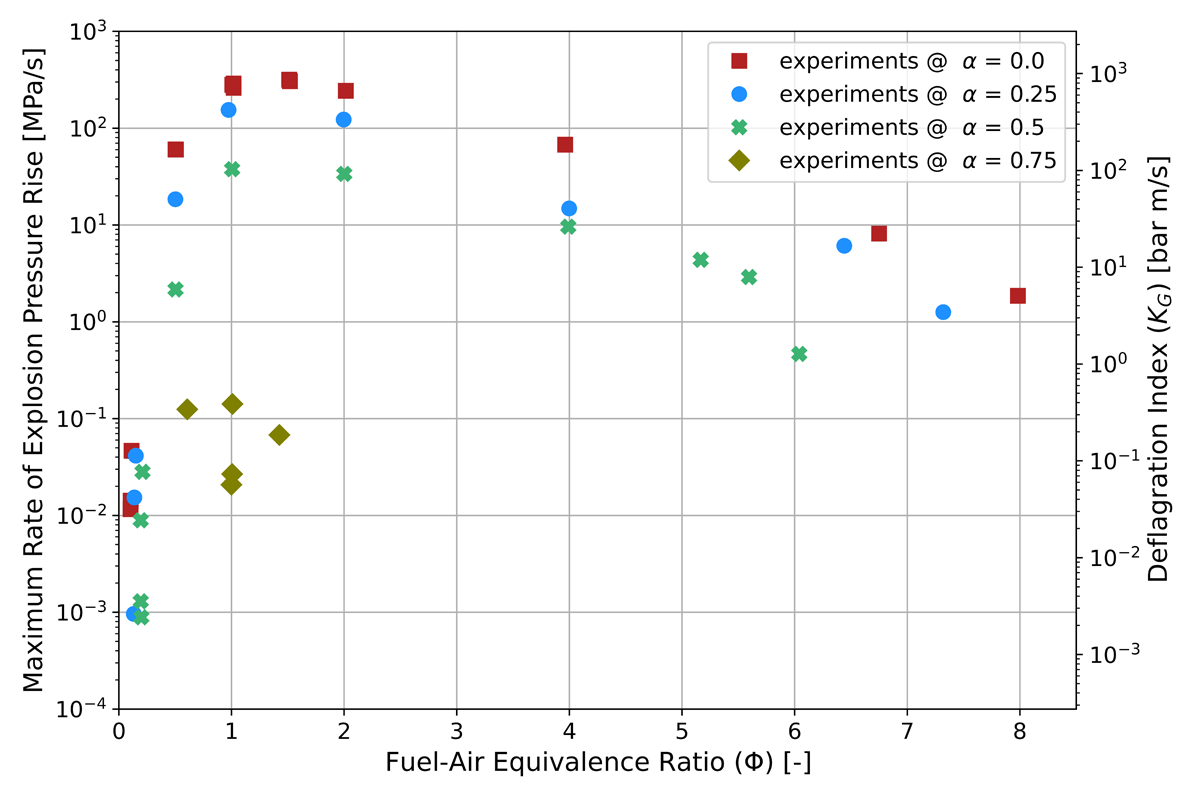
Figure 3
Experimental maximum rate of explosion pressure rise as a function of fuel-air equivalence ratios for inert-to-air relations (α) of 0, 0.25, 0.50, and 0.75.
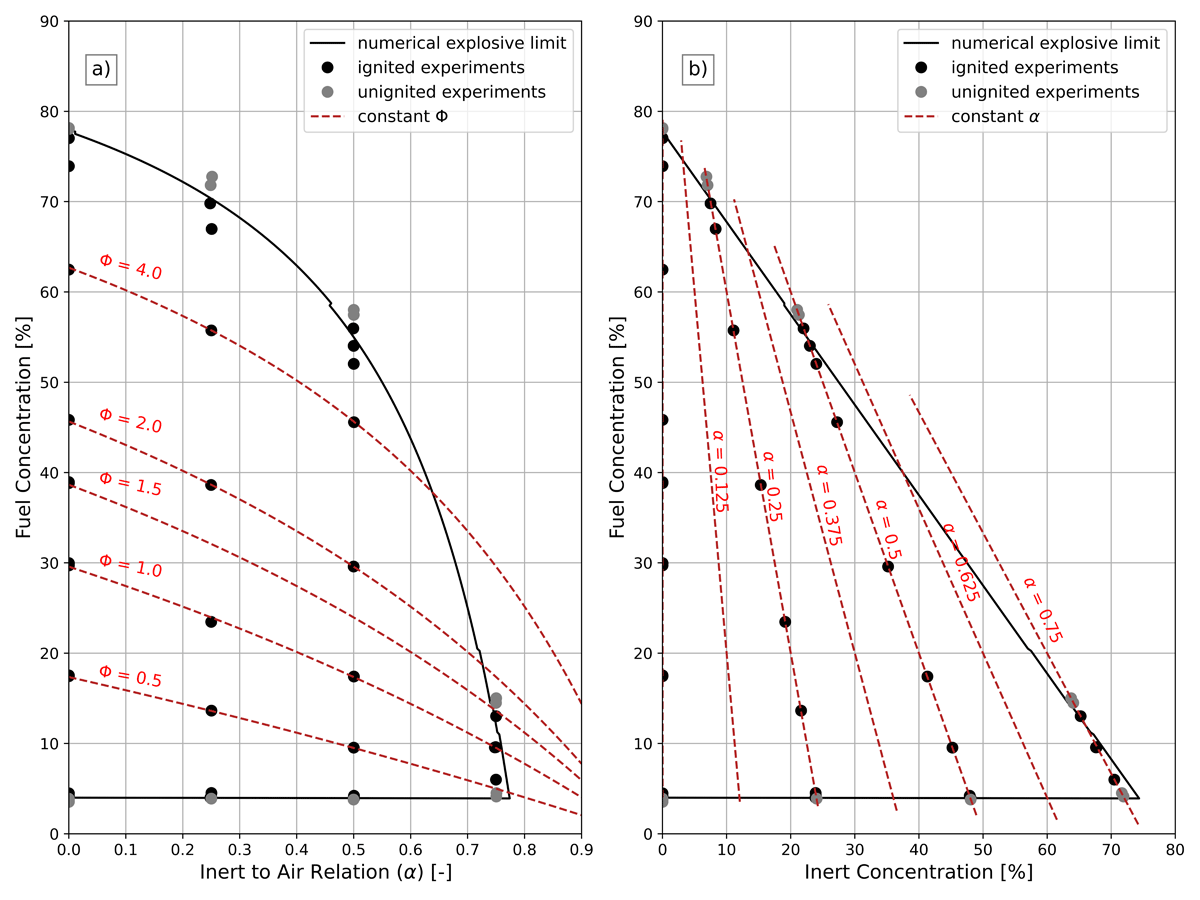
Figure 4
Experimental and numerical explosive limit of hydrogen-air-Inergen. a) Explosive limit of hydrogen as a function of inert-to-air relation (α); b) Explosive limit of hydrogen as a function of the concentration of Inergen.
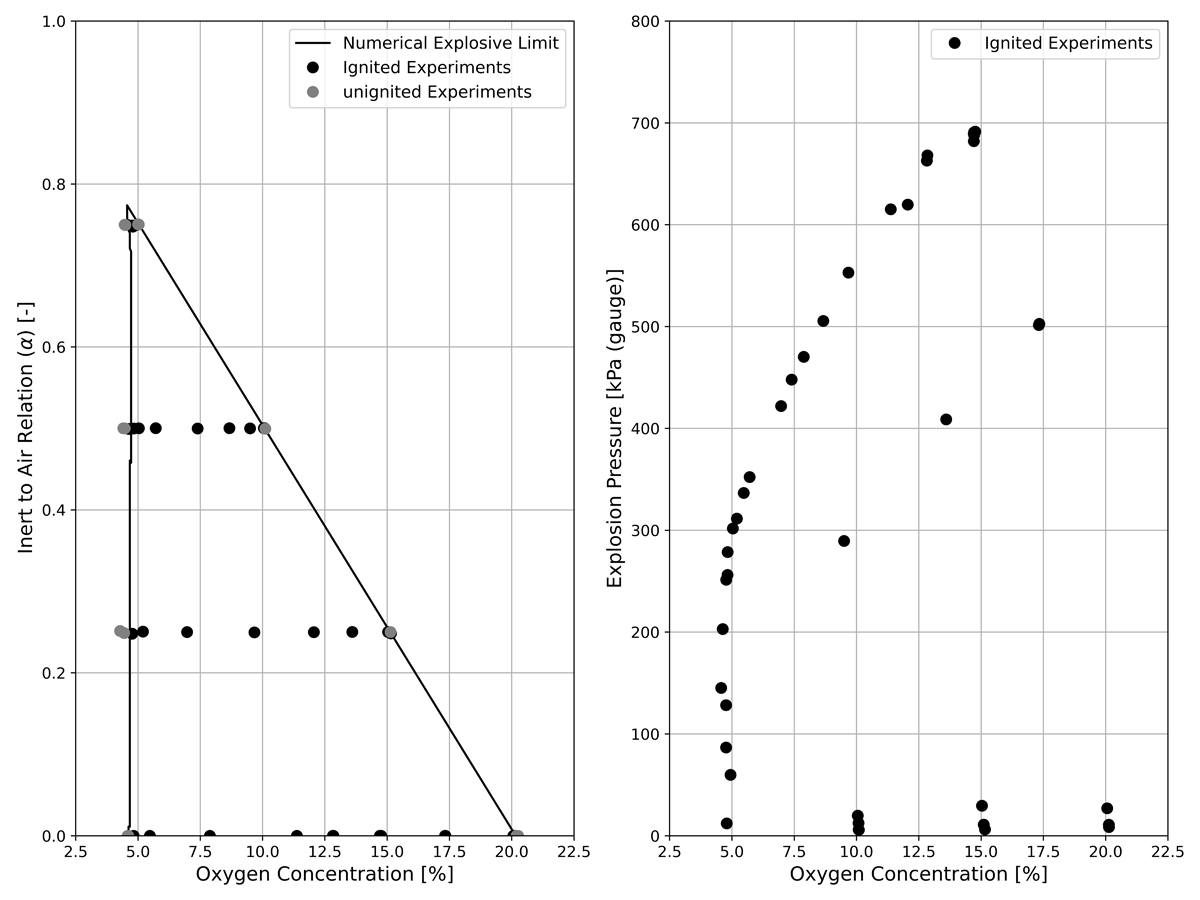
Figure 5
Experimental and numerical explosive limit as a function of oxygen concentration and inert-to-air relation (α).