
1.0 Introduction
Anthropogenic emissions of greenhouse gases from the combustion of hydrocarbon fuels have significantly contributed to global climate change, leading to an increase in the average global temperature. In 2023, Canada saw record high average annual temperatures, and globally, 2023 was the warmest year to be recorded since 1850 (NOAA, 2024). As of 2021, total Canadian greenhouse gas emissions have decreased by 8.4%. Over the same period, residential emissions decreased by 17% (7.2Mt), however the ‘buildings’ economic sector emissions increased by 7.7% to 87 Mt CO2 eq. This represented 13% of Canada’s total greenhouse gas emissions of 670 Mt CO2 eq (ECC Canada, 2023). To meet the nations’ commitment to achieving net-zero emissions by 2050 more progress on reducing greenhouse gas emissions must occur (Canada, 2024).
Hydrogen is an energy carrier that can be used to store excess renewable energy for later use and may be important in the future energy distribution network. Generation and use of hydrogen energy is being explored as a low-carbon pathway to produce and store energy, however there are significant technical, economic, and regulatory barriers to produce, transport, and use hydrogen (Smith et al., 2022; IRENA, 2019). In an effort to incentivise development of hydrogen supply chains, it has been proposed that blending hydrogen into the existing natural gas distribution network can decrease end-use carbon emissions while low-carbon infrastructure is being developed and adopted. This transition period and its impact on residential end-use appliances is similar to previous transitions from firewood, to coal and then hydrocarbon gases (Zhao McDonell and Samuelsen, 2022).
A review of past literature highlights several studies on the impact of hydrogen blending in natural gas appliances. Zhao, McDonell and Samuelsen (2019a; 2019b) found that while hydrogen addition reduced ignition time in residential stoves, flashback occurred above 15%, with flame instability and overheating becoming more pronounced at higher hydrogen levels. Emissions performance showed reductions in NOx, CO, and UHC emissions, though combustion noise increased at higher hydrogen blends. This study used a series of critical flow orifices to mix the blends from cylinders of pure gases and a pressure regulator to maintain a typical natural gas installation pressure. Gersen et al. (2023) tested 12 domestic appliances using flow controllers using a feed-forward control mechanism to maintain appropriate flowrates and likewise regulating gas pressure to ~1725 Pa. Glanville et al. (2022) used a similar experimental setup and found most appliances operated reliably up to 30% hydrogen with minor performance changes. Wojtowicz and Jaworski (2021) also used flowmeters and typical Polish gas meters and determined that up to 13.2% hydrogen could be safely added to nitrogen-rich natural gas. Finally, Boulahlib, Medaerts and Boukhalfa (2021), Choudhury, McDonell and Samuelsen (2020), and Wright and Lewis (2022), focus on boilers and water heaters but of particular note is the research performed by Suchovsky et al. (2021) with the Canadian Standards Association. They evaluated space and water heating appliances, finding that up to 15% hydrogen caused no major operational issues, reduced CO2 emissions, and maintained CO and NOx levels within acceptable limits. Their research gives an excellent discussion on fuel interchangeably and performs appliance tests according to CSA/ANSI Z21 standards, however those standards do not dictate that the gas delivery system meets national installation codes, and Suchovsky et al. (2021) did not discuss the gas delivery system for their experiments at all. There are also several literature sources that compile and compare past experimental studies or review the current state of hydrogen blended natural gas (HBNG) (Islam, Yoo and Girard, 2025; Leicher et al. 2022; Basinger, Hickey and McDonell, 2023).
Despite these experimental results and the extensive number of theoretical studies, there is still a gap in the literature, with only a limited number of studies testing residential equipment on HBNG fuels. In addition, many of these experimental studies have only tested to 20–30% hydrogen and are geographically limited to either Europe or the western United States. No studies on hydrogen admixture have been conducted using the northeastern part of North America’s natural gas distribution network. Most of these experimental studies have also been carried out at ‘lab-scale’ using tubing, compression fittings, flow controllers, and unknown pressure regulators to feed gas to an appliance. These prior tests operate under the assumption that the only factor impacting the operability of HBNG blended appliances is the appliance itself. This study builds on this body of literature by creating a testing apparatus that conforms to the natural gas and propane installation code CSA B149.1:20 and incorporates pressure regulators, fittings, valves, etc that are required under the gas code. Thus this ‘pilot-scale’ apparatus improves on prior studies by incorporating a whole-system approach that treats the appliance and post-meter piping/gas handling equipment as equally important in impacting the safety and operability of HBNG blending. This setup also investigates the upper limit of hydrogen blending and thus is not limited to testing appliances to 20–30%. Further, these tests use natural gas sourced from the northeastern part of North America and thus add data from a previously underrepresented region.
2.0 Materials and Methods
2.1 Appliance Testing Apparatus
To conform to Canada’s natural gas and propane installation code CSA B149.1:20, the gas line shown in Figure 1 was designed and built. Rather than controlling the flowrate of gas externally using flow controllers or critical flow orifices as prior laboratory studies have done (Zhao, McDonell and Samuelsen, 2019a), this study replicates the actual gas distribution network by treating the gas network as an infinite reservoir in which the appliance control system constricts the gas flowrate by an internal valve. Cylinders of high-pressure blended HBNG were chosen to mimic the tube trailers that Halifax’s natural gas supplier Eastward Energy currently uses to serve large customers that are not connected to the gas distribution network.
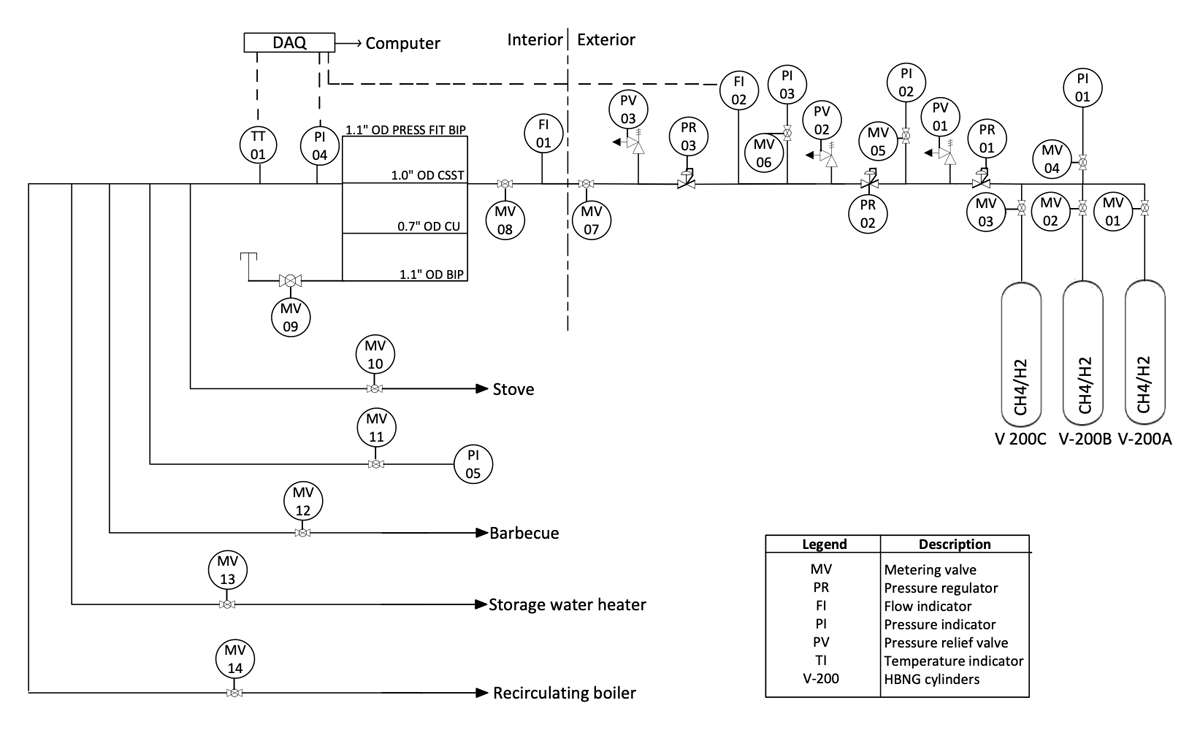
Figure 1
CSA B149.1:20 compliant gas line for pilot-scale appliance testing apparatus (Street et al. 2025).
Another important feature is the Pietro Fiorentini FE25 line pressure regulator which lowers the gas pressure to 1000–2500 Pa, and the 1.0 in schedule 40 (33.4 mm o.d, 30.02 mm i.d) galvanised steel piping that has been sized according to CSA B149.1:20.ƒ. These are important because flame instability is influenced by gas flowrate, which depends on gas-line pressure. Appliance inlet gas pressure depends on the accuracy and reliability of the pressure regulator along with the friction losses due to pipe size. It is important that during HBNG testing, these are as similar to in-situ gas networks as possible. Thus it is critically important to test on installations that adhere to the gas code. This apparatus has been installed by certified red seal gasfitters, and has been inspected and certified as a code-compliant installation by the Nova Scotia fuel safety board. A few minor variances were required from code, however these did not impact the installation technically. For example, clause 9.2.3 dictates that gas cylinders are marked ‘FOR NATURAL GAS ONLY’, while this installation has cylinders marked ‘FOR NATURAL GAS AND/OR HYDROGEN ONLY’.
In addition to the gas line, a water recirculation system (shown in Figure 2) was designed and built to replicate two systems. The first was a hydronic heating loop representative of a baseboard or radiant heating system. This required two Grundfos water pumps and a fan/heat exchanger to remove the heat generated from recirculating heating systems and represent the baseboard/underfloor heat sink. The second system was designed to simulate mains water usage from showers, faucets, etc. This system pumps water from intermediate bulk containers through the appliance and returns the water to the containers. This water can then be reused and thus less water is wasted during testing. Both the gas and water systems include Omega PX pressure transducers, K-type thermocouples, and FTB370 turbine/Emerson CMF010 flowmeters to measure process pressures, temperatures, and flowrates. In addition, flue gas temperatures have been recorded; for appliances with enclosed flue stacks, the flue differential pressure has been estimated using an Omega FPT series pitot tube.
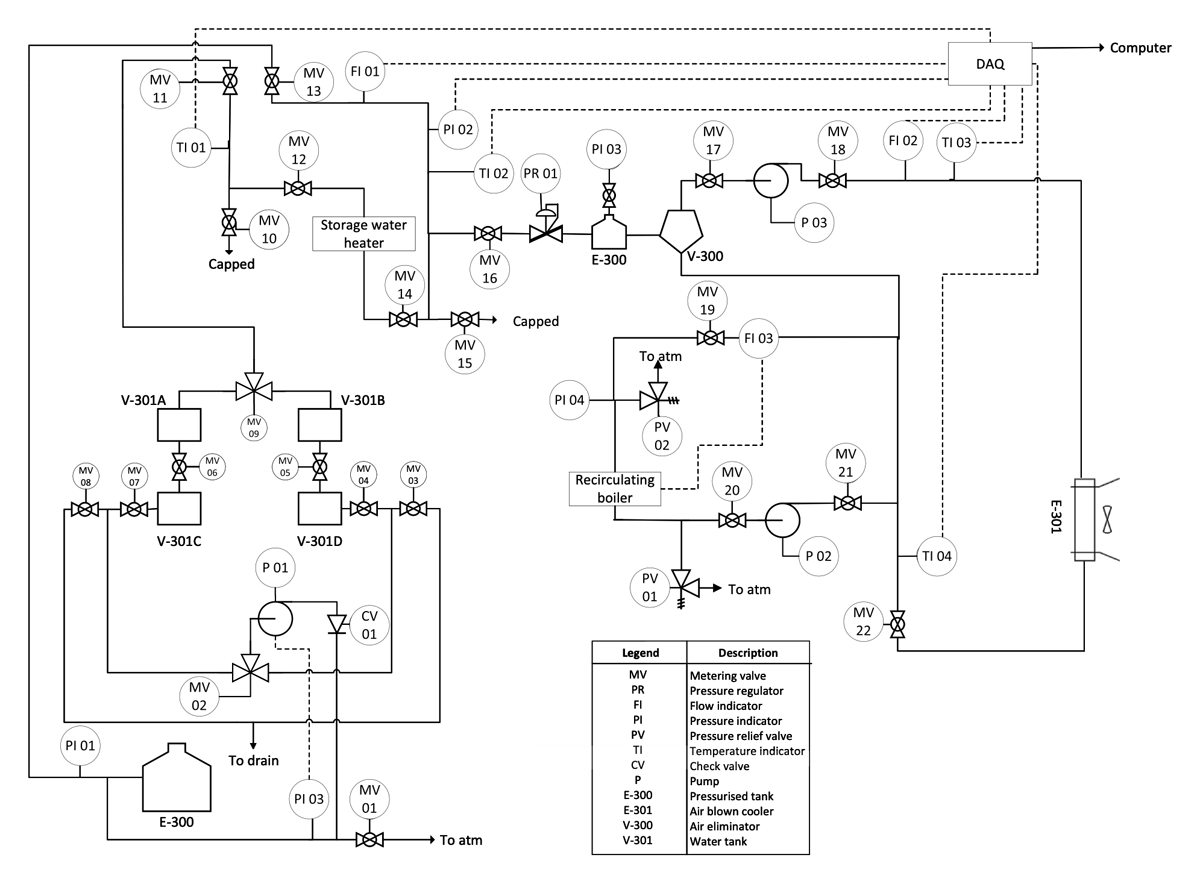
Figure 2
Water system for appliance testing apparatus.
Gas cylinders were prepared at compressed natural gas (CNG), 20%, 30%, 40%, 50%, and 60% hydrogen by volume using the method of partial pressures in which a compressibility factor was estimated using the GERG-2008 equation of state. Natural gas was obtained from the Maritimes & Northeast Pipeline, and comprised approximately 91% CH4, 6% C2H6, with the balance C3H8, CO2, N2, and trace components of H2 and higher order hydrocarbons. Hydrogen (99.999% pure) was obtained from Linde in HY-5.0UH-T cylinders. The blends were validated using gas chromatography. However, the uncertainty in validation samples and the presence of higher order hydrocarbons (CO2, N2, etc.) in the fuel meant that the blend composition varied by ±3% hydrogen.
2.2 Testing Programme
Four new appliances were tested in this study, including a residential stove with both a stovetop and oven natural gas burners, a barbecue (BBQ), a space-heating boiler (SHB), and a storage water heater (SWH). Three of these appliances are shown in Figure 3.
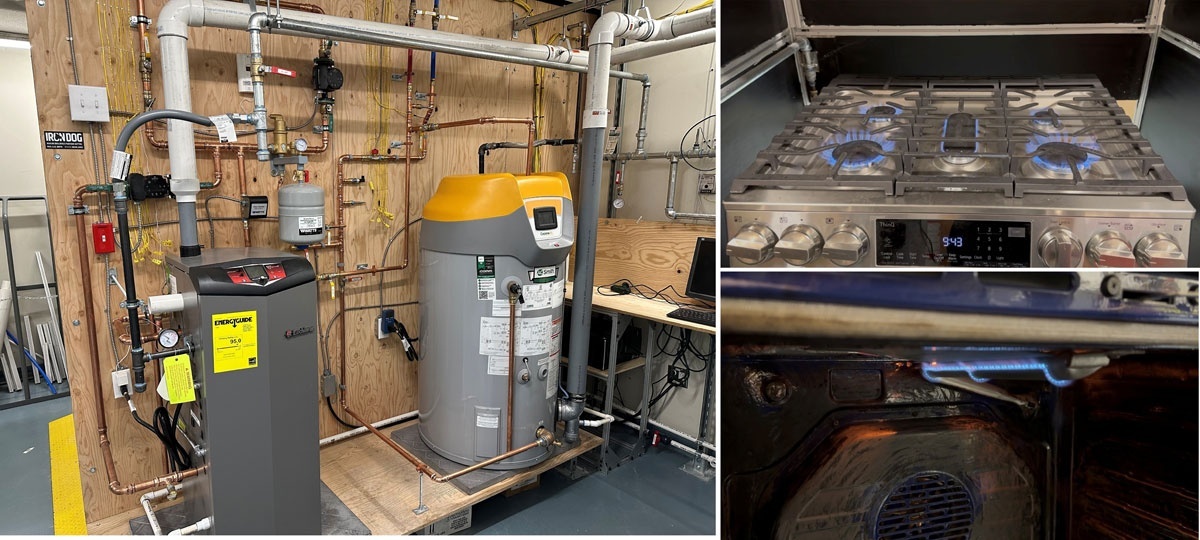
Figure 3
Space heating boiler, storage water heater, and residential stove/oven for HBNG fuel testing.
A Kidde CO detector was installed, and hydrogen leakage was measured using a GasDog GD200-H2 portable hydrogen detector with a range of 0–20 ppm, 0.001 ppm resolution, and ±3% F.S. accuracy. The detector was run along the gas line, pausing at joints to determine if hydrogen was leaking. Methyl mercaptan was present in the natural gas and sniff-tests were performed as necessary. Visual inspections of key components such as the cylinders, pressure regulator, and junctions were performed regularly to determine if corrosion or degradation had occurred, although the system was not disassembled to check interior components.
The appliance testing standard CSA/ANSI Z21.1:24 requires that for range burners, the flames not flash back on ignition under low, normal, or high gas-line pressure (clause 5.5.2). This test has been performed, along with a determination of ignition time at cold and hot re-ignition (clause 5.7.3) under the aforementioned gas-line pressures. CSA/ANSI Z21.58:22 has similar requirements for gas barbecues (clause 5.6.2) and CSA/ANSI Z21.10.1:19 (R2024) for water heaters (clause 5.5.2). These standards require the appliance turned on and off five times at each pressure and temperature condition. When flashback was observed it was recorded both during flame ignition and extinguishment, along with any flame instabilities on ignition. Ignition time and flame visual properties of the barbecue and stovetop/oven burners were recorded at 240fps using an Apple iPhone 14 Pro Max. The burner noise was also recorded for each appliance using a Dig-sense 20250-29 sound meter.
CO, CO2, NOx, and O2 emissions from the flue gas for each appliance were obtained using a Horiba portable multi-gas analyser PG350. The flue gas was first cooled to ~40°C and moisture was removed. For the SHB and SWH the emissions were recorded from the flue gas pipe, and for the stove/BBQ measured from the oven body and the closed barbecue lid. The stovetop emissions were measured with the flue hood ~130 mm from the burner tops to minimise the ambient air from diluting the emissions measurements. Gas volumetric flowrate was measured using an Itron M400A rotary gas meter. During operation, video of the meter dial was recorded and a python computer script created to analyse the dial reading and compute the flowrate of gas. The mass flowrate was measured using an Emerson CMF010m Coriolis meter. Theoretical flowrates were calculated under two conditions: first under the assumption that the burner thermal loading remains constant, and second with the assumption that gas-line pressure, appliance piping, burner orifice diameter, etc. doesn’t change (constant pressure).
Constant thermal output
These calculations assume that the operator wishes to maintain the thermal loading of the burners and that the appliance maintains its thermal rating. This could be achieved either by increasing the gas flowrate (if the appliance is in a laboratory setting) or by increasing the appliance or gas-line pressure regulator to maintain a higher line pressure. The lower heating values of hydrogen and natural gas were 10.2 MJ m–3 and 31.6 MJ m–3 respectively and the mixture LHV and density were calculated using weighted averages. The volumetric and mass fuel flowrate as a ratio of the pure natural gas values can then be calculated using equation 1 below.
where – fractional change in mixture volumetric flowrate from CNG; LHV – Lower heating value (kJ kg–1); – fractional change in mixture mass flowrate from CNG; ρ – density (kg m–3).
Constant pressure/orifice conditions
If the gas utility does not make any modifications to the system or appliance, the volumetric flowrate is dictated by flow through an orifice (the burner nozzle) and is thus dependent on the properties of the fuel. Assuming appropriate values for atmospheric and downstream pressure and treating the gas as incompressible, one can use the orifice equations to calculate the mass ratio in equation 2.
where – fractional change in mixture volumetric flowrate from CNG; – fractional change in mixture mass flowrate from CNG; ΔP – gas line gauge pressure, Pa; ρ – density (kg m–3).
It should be noted that equation 2 also assumes a constant coefficient of discharge for the burner orifice. This is a fair assumption in cases where the inertial forces of the moving fluid are significantly greater than the viscous forces acting on it and the fluid has a high Reynold’s number. However, in some appliances the flowrate is low enough that the Reynold’s number is low and the assumption of constant coefficient of discharge for increasing HBNG blends is not accurate. This will introduce small errors in at increased HBNG concentrations for low-flow appliances, however as will be shown in section 3.3 the assumption of constant coefficient of discharge causes a small-enough error for the appliances/burners tested which range from 2.93–35.17 kW (10,000–120,000 Btu). It is thus appropriate to generalise the assumption and allow for equation 2 to be applied to all appliances tested here.
In this paper, both the constant thermal input and constant pressure equations have been calculated and compared to the observed flowrates to determine how the burner thermal loading is impacted by HBNG and whether the flowrates can accurately be predicted using orifice theory. This measurement and prediction of flowrate is an important distinction from prior studies that set the flowrate externally to maintain a certain burner loading (Zhao, McDonell and Samuelsen, 2019a) or used a feedforward Proportional-Integral-Derivative (PID) control system to regulate flowrate and thus introduce transient response delays/oscillations in the introduction of gas to the appliance.
3.0 Results and Discussion
3.1 Flame Properties
During testing conducted in 2024, flashback was not observed for any of the appliances during hot or cold ignition. However, as shown in Table 1, intermittent flashback ‘pops’ occurred when extinguishing flames on the oven broil burner, the oven bake burner, and the left-side barbecue burner during hot ignition tests. The broil burner showed the highest susceptibility, experiencing this at 50% hydrogen, while the oven bake and barbecue burners exhibited this at 60% hydrogen. Notably, lowering the gas-line pressure increased the frequency of these flashback events, whereas increasing the pressure reduced occurrences. In 2025, further testing after a year of using the appliances and applying oil/grease to the oven interior and barbecue confirmed these trends, however post-operation flashback began to be observed at 30% hydrogen on the oven broil burner. This suggests that age or condition of appliances may impact their propensity to experience flashback. Caution should be given to these results given the limited sample size (five tests per pressure/temperature combination) and further experimentation on a wider dataset of appliances using statistical analysis is needed to determine the significance of these trends.
Table 1
Flashback as flame was extinguished (normal gas-line pressure) 2024 data.
| CNG | 20% | 30% | 40% | 50% | 60% | ||||||||
|---|---|---|---|---|---|---|---|---|---|---|---|---|---|
| HOT | COLD | HOT | COLD | HOT | COLD | HOT | COLD | HOT | COLD | HOT | COLD | ||
| Stovetop | 0 | 0 | 0 | 0 | 0 | 0 | 0 | 0 | 0 | 0 | 0 | 0 | |
| Oven | Top (Broil) | 0 | 0 | 0 | 0 | 0 | 0 | 0 | 0 | 1 | 0 | 1 | 0 |
| Back (Bake) | 0 | 0 | 0 | 0 | 0 | 0 | 0 | 0 | 0 | 0 | 0.4 | 0 | |
| BBQ | Left | 0 | 0 | 0 | 0 | 0 | 0 | 0 | 0 | 0 | 0 | 0.2 | 0 |
| Middle | 0 | 0 | 0 | 0 | 0 | 0 | 0 | 0 | 0 | 0 | 0 | 0 | |
| Right | 0 | 0 | 0 | 0 | 0 | 0 | 0 | 0 | 0 | 0 | 0 | 0 | |
| SHB | 0 | 0 | 0 | 0 | 0 | 0 | 0 | 0 | 0 | 0 | 0 | 0 | |
| SWH | 0 | 0 | 0 | 0 | 0 | 0 | 0 | 0 | 0 | 0 | 0 | 0 | |
Current CSA Z21 standards do not explicitly define flashback but state that flames must not flash back upon ignition or under operation of the appliance, which suggests that minor flame instabilities as the flame is extinguished may be acceptable under current standards. Two primary hazards arise from flashback: (1) potential accumulation of unburned gas if flameout detection is absent, and (2) damage to burners due to elevated flame temperatures and pressures. Flashback during ignition is particularly hazardous as it increases the likelihood of both risks, whereas flashback at flame extinction mainly affects burner integrity. Although further study is required to quantify long-term burner degradation from repeated flashback events, prior natural gas testing suggests occasional flashback on extinguishment is unlikely to cause significant safety concerns on partially aerated tube-type burners.
More concerning is the unstable ignition behaviour observed at 60% hydrogen in both the barbecue and the stove broil burner. These burners, which feature elongated tube designs, exhibited sporadic localised instability, with the flame anchoring near the gas inlet but becoming erratic toward the far end. While the instability typically resolved into a stable flame, it twice persisted until the burner was manually shut off and reignited. Such instability is unacceptable in residential applications, suggesting that the maximum viable safe hydrogen blending limit for residential stoves and barbecues may be ≤50%.
These findings contrast with those of Zhao, McDonell and Samuelsen (2019a; 2019b), who reported flashback issues at 15–25% hydrogen for a residential stove, although they do not report whether flashback occurred on flame ignition or extinguishment, or the age or condition of the appliance. Other studies (Gersen, Essen and Pysyk, 2023; Glanville et al., 2022; Sorgulu et al. 2023) have demonstrated safe operation at up to 30% hydrogen without flashback, although only Gersen, Essen and Pysyk (2023) tested beyond 30%, and found that flashback occurred at ~50% for a barbecue. Again, the age or condition of appliances tested, or whether flashback occurred at flame ignition or extinguishment was not discussed. The discrepancies between these studies may stem from differences in gas pressure, flow rate, and burner configurations. For example, Zhao, McDonell and Samuelsen (2019a; 2019b) employed critical flow orifices to control fuel flow, whereas most other studies used mass flow controllers. For the majority of tests, the gas delivery method does not matter as when the burner is turned on and operating normally the only requirement is that the gas is delivered at the required inlet pressure. Assuming all prior studies chose a pressure regulator that meets the accuracy class required by code these tests should not be any different. The key difference between these gas delivery methods is the transient period as the gas is beginning to flow and the burner is lit (or the transient period as the flame is extinguished). Critical flow orifices require a set gas flow rate to meter the correct ratios of gas, and thus there is a time period on startup and shutdown in which these devices do not give the correct composition of gas. Flowmeters have a response time such that when the control system of a burner is turned on or off there is some delay before it changes the flowrate. Additionally, if the response of the control system is based on downstream conditions and programmed using the principles of process control then there is an oscillatory response around the desired flowrate during any transient period. Thus, the flashback tests, which are inherently transient and rely on the gas starting to flow exactly as it does in real-world installations, require a gas delivery system that mimics real-world installations as closely as possible. Cylinders of compressed HBNG are not, however, the sole option for maintaining real-world accuracy. Flowmeters, for example, can be made to work by continuously running a stream of gas of a desired composition (much like a gas network main pipeline) and attaching a takeoff from this stream with the correct pressure regulators. Prior studies may not have implemented this strategy or considered the impact of their blending equipment on gas composition/transient response, which highlights the benefit of installing testing equipment according to national codes and standards as it allows for standardised testing of appliances. The present study, which represents real-world gas distribution system pressures and equipment, found that the upper hydrogen blending limit before flashback occurs for the residential range and barbecue tested initially aligned more closely with Gersen, Essen and Pysyk’s (2023) results (~50%) than Zhao, McDonell and Samuelsen’s (2019a) (15%), although the appliances did show lower tolerance after a year of heavy simulated use (~30%).
Slow-motion video indicated that all stovetop and barbecue burners ignited within the 4 s requirement from CSA/ANSI Z21 standards. There were three distinct ignition periods. First was the time between turning the burner control on and the first small volume of gas being ignited. Then the flame took a small amount of time to travel around/across the burner and completely ignite, and finally the flame spent some time in an unsteady turbulent state before transitioning to a stable flame with distinct tips. The second period (flame travelling around burner) is shown for a stovetop burner in Figure 4 for CNG and 60% HBNG and shows that the 60% blend takes significantly less time to complete the burner circumference.
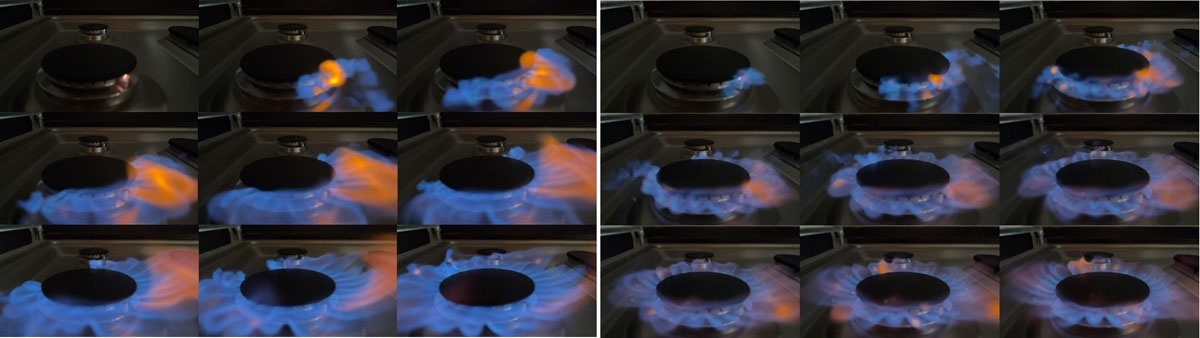
Figure 4
Stove burner ignition, natural gas. Left: CNG, 25 ms per frame. Right: 60% HBNG, 12.5 ms per frame.
The overall time each stovetop burner took to complete these three intervals is shown in Figure 5. Overall ignition time decreases with increasing hydrogen blend until 50% hydrogen is added, at which point the ignition time increases slightly. This increase is unusual and has not previously been reported in other lab-scale tests. It is unclear why the time between turning the burner control and the initial ignition is greater at 50/60% hydrogen blends, however the increase in time for the flame to circumnavigate the burner and then stabilise into jets was likely due to the increased velocity of the gas for high hydrogen blends. As each small volume of gas ignites, the flame front travels both radially towards the burner, and tangentially around the burner at the flame burning velocity. If the velocity of the gas, which acts radially to counter the flame, increases then the flame front will have to travel a greater distance to circumnavigate the burner. Finally, the increase in time for the flame to stabilise is likely due to the increased amount of gas released during ignition, and possibly the increased turbulence of the gas exiting the burner orifice due to the increased volumetric flowrate of gas. Once stabilised, the physical characteristics of the flame were observed and the flame height decreased slightly with increasing hydrogen blend. An inner cone was observed after 20% HBNG was added, although the flame still looked very similar to a natural gas flame.
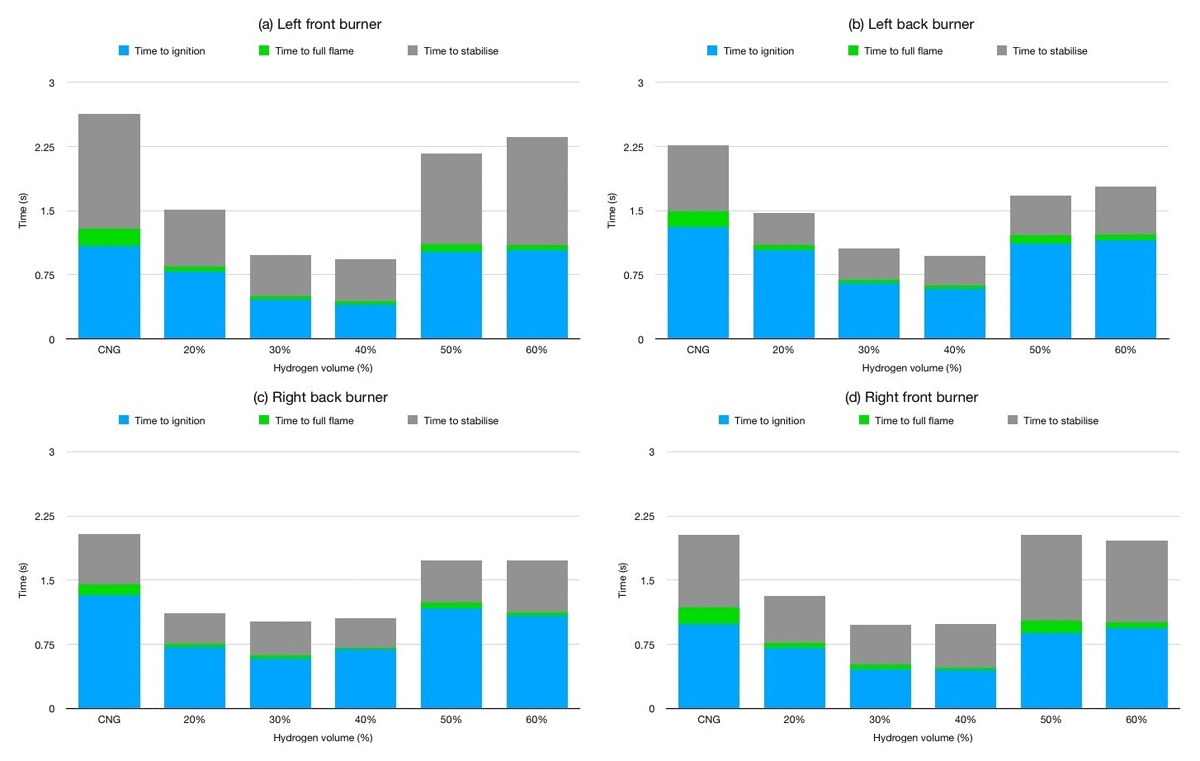
Figure 5
Ignition time data from stovetop burners.
Burner noise for each burner is shown in Figure 6. Most burners showed no clear trend of increasing noise with added hydrogen, although the oven top (broil) burner showed a slight increase. This contrasts to the findings of Zhao, McDonell and Samuelsen, 2019a), which suggest that burners on hydrogen blends will be louder. It should be noted that the high noise levels from the SHB, SWH, and oven bake burner are mostly due to the fans/blowers that move the combustion air or hot combustion gases (oven bake burner). The noise level from these fans/blowers is the same on each blend, as such the difference in noise from the ambient levels should still demonstrate any change in burner noise due to hydrogen blends.
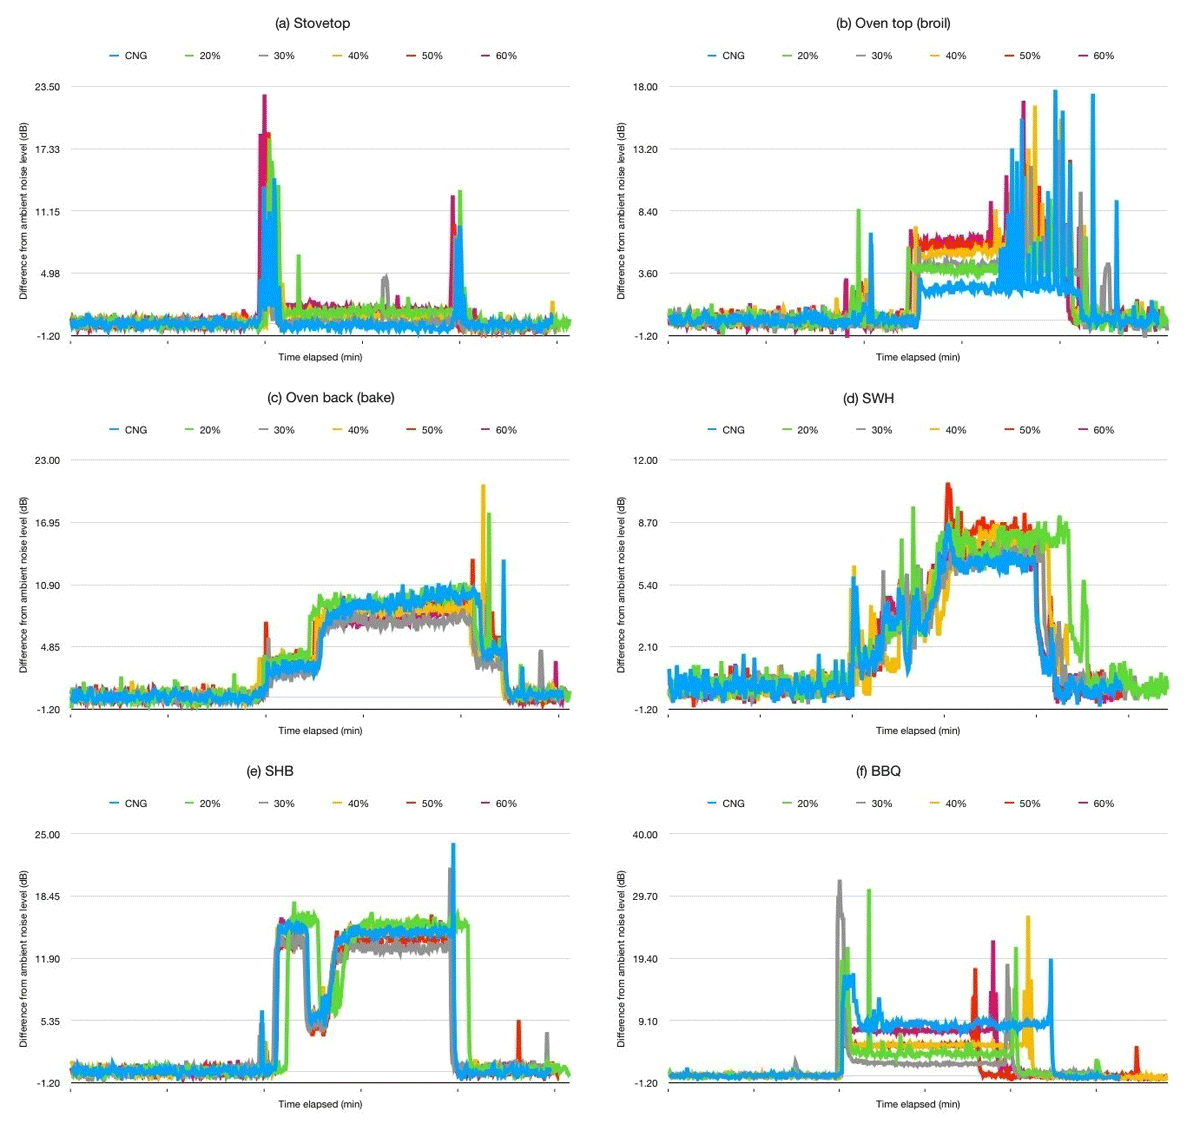
Figure 6
Burner noise adjusted for ambient sound level.
3.2 Emissions
CSA/ANSI Z21 standards dictate that maximum allowable CO emissions are measured on an air-free basis. This involves measuring the flue gas oxygen concentration and correcting the emissions based on the stoichiometric air-fuel ratio of natural gas. This is not an appropriate test for comparisons of HBNG fuels because hydrogen requires less oxygen for combustion, thus for the same appliance operating on hydrogen blends (assuming the appliance does not monitor and adjust the excess air ratio) a HBNG fuel will contain more oxygen in the flue gas than pure natural gas. Air-free oxygen correction assumes that any increase in oxygen in the flue gas is due to exhaust air dilution and thus increases the calculated emissions for flue gases with greater oxygen concentration. This penalises HBNG fuels and makes it appear that their emissions are greater than they actually are. To correct for this, it is possible to calculate the emissions on a per-energy or per-mass of fuel basis, however for comparison purposes, it is often more desirable to know how HBNG fuels compare to CNG. Thus, for this study, the ratio of emissions results compared to CNG is presented here. For example, if for a particular appliance operating on natural gas 9.12% CO2 is measured in the flue stack, and for a 20% blend 7.8% is measured, then we report that there is a 14.5% reduction in CO2 emissions from the 20% blend. Reduction in CO2 emissions from CNG is shown in Figure 7, and clearly shows a trend of less CO2 emitted from the various appliances. The reduction closely matches the expected reduction in CO2 calculated assuming constant pressure conditions (equation 2). It should be noted that the appliances will likely be run for longer due to burner derating, thus the total emissions reduction will be less than reported in Figure 7.
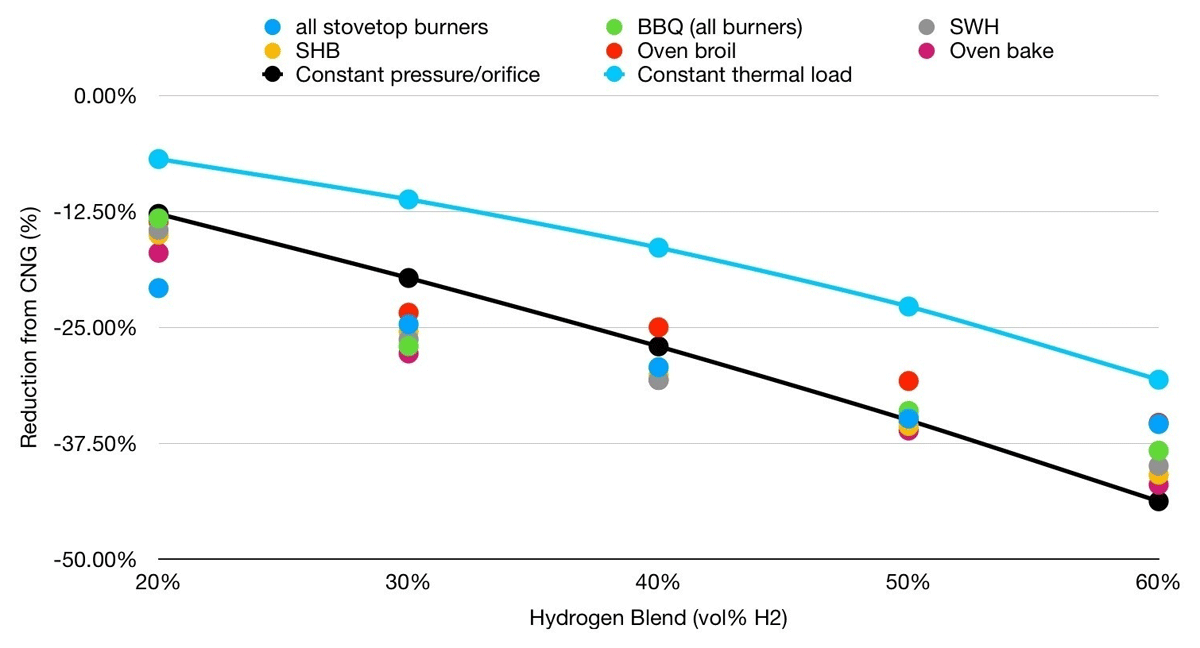
Figure 7
Burner reduction in CO2 emissions from CNG.
NOx concentrations had no clear trend. Some appliances emitted less NOx on higher HBNG blends, such as the BBQ in Figure 8a, while other appliances, such as the oven bake burner (Figure 8b), displayed no clear trend. NOx emissions are primarily dependent on flame temperature, thus they will always be present, even on pure hydrogen-air flames, however these experiments showed that increasing hydrogen blends do not significantly increase or decrease these emissions.
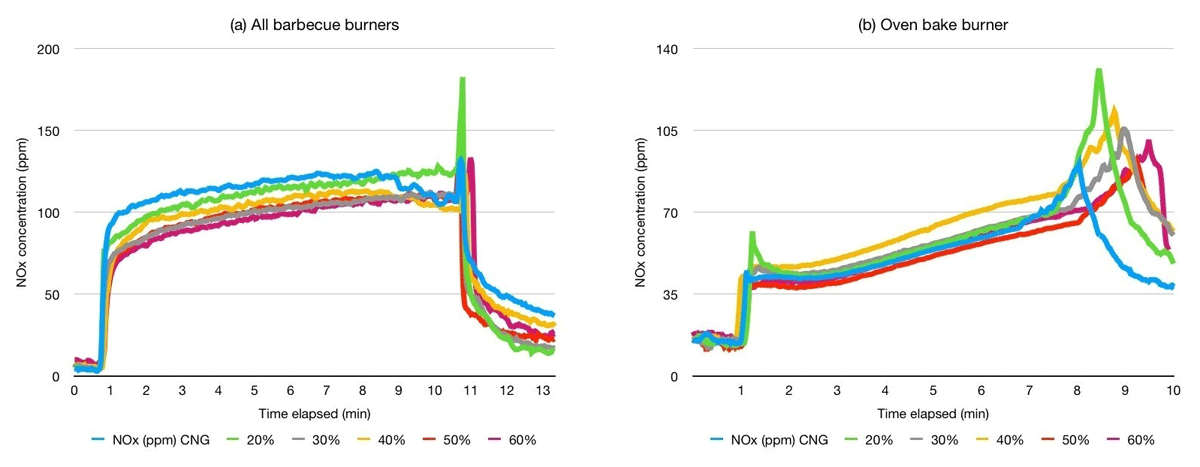
Figure 8
Absolute NOx emissions.
The CSA/ANSI Z21 standards dictate maximum CO concentration of 0.08 vol% in the flue gas for residential stoves (CSA Z21.1:24) but 0.04%/0.02% for residential boilers CSA/ANSI Z21.10.2.19. All blends of HBNG tested on all appliances met these CSA requirements, and increasing HBNG blends typically reduced the CO concentration as shown in Figure 9. All appliances also had a higher concentration of oxygen in the flue stack compared to CNG, although past 30% hydrogen, the oxygen level tended not to increase significantly. More oxygen is expected in the flue gas as a result of less oxygen consumed by HBNG combustion, and this is likely counteracted by the increased flowrate of gas burned at higher blends.
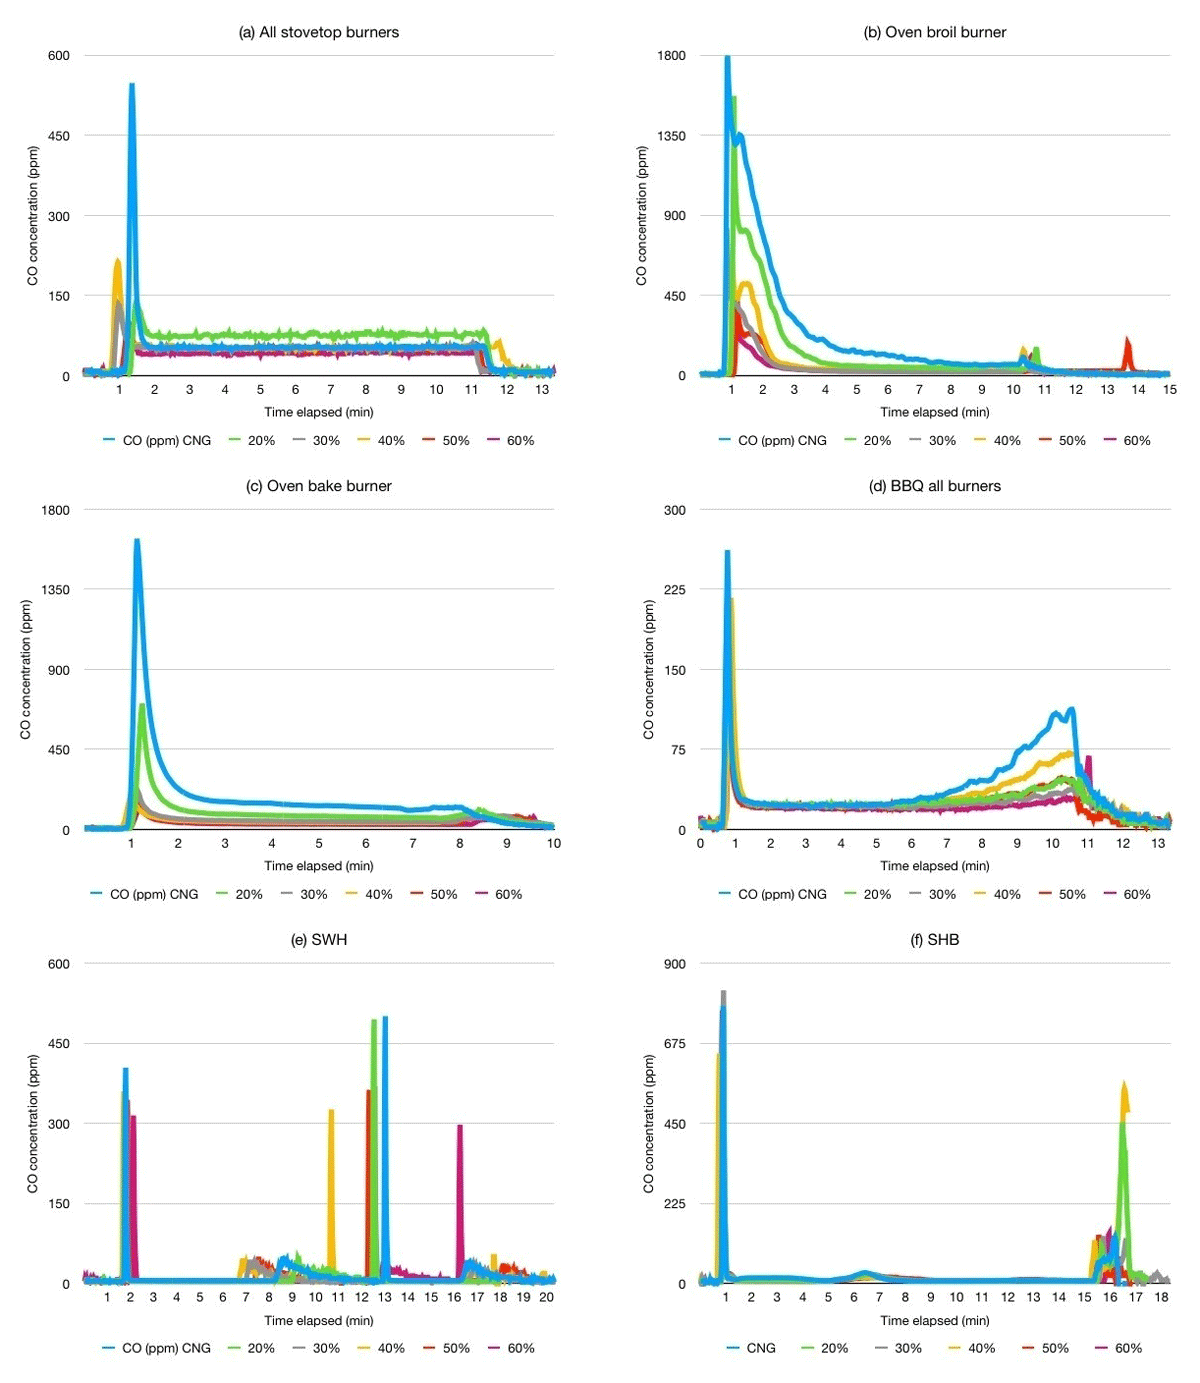
Figure 9
Burner absolute CO emissions.
No measurable hydrogen was observed leaking from the gas line components using the GasDog sensor, nor was the smell of methyl-mercaptan observed during any tests. The gas-line components operated without any clear safety or operability issues, and no excessive corrosion was apparent on components. The Pietro Fiorentini FE25 regulator needed to be replaced after approximately 14 months use as it began to experience excessive pressure fluctuations, however communication with the manufacturer suggests this is a known issue that can occur on any FE25 and is not due to hydrogen addition. No tests on metal fatigue life were performed and longer-term tests incorporating rigorous risk and safety analyses are necessary, however this study suggests that post-meter gas network components have no immediate safety concerns with hydrogen addition up to 60%.
3.3 Process Conditions
Figure 10 shows the gas volumetric flowrate increases at higher HBNG blends, while the mass flowrate decreases. The change in flowrate from CNG matches the flowrates calculated based on orifice theory/constant pressure closely, although orifices theory appears to overestimate the mass flowrate slightly. The change in flowrate from CNG was consistent across burners, which suggests that there is no significant impact of the decreased coefficient of discharge expected from smaller burners.
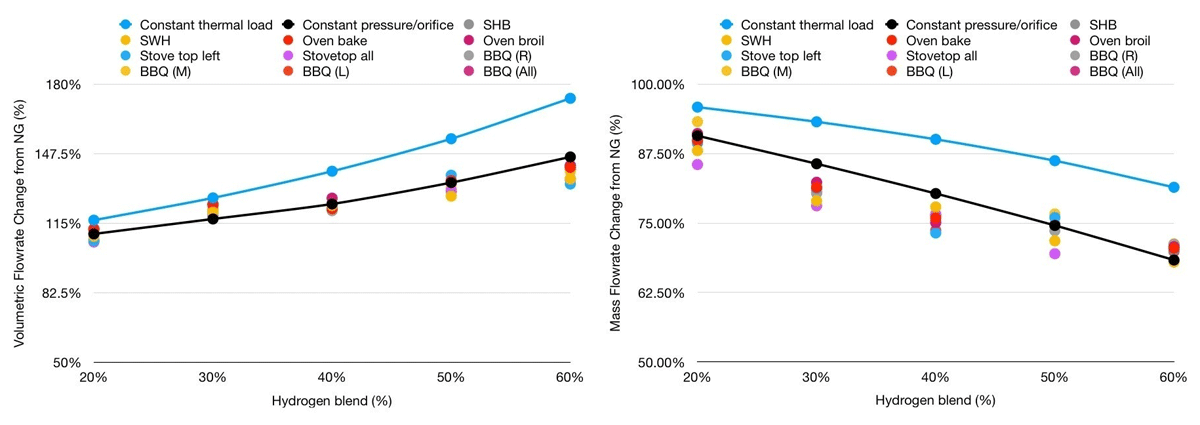
Figure 10
Mass and volumetric flowrates.
To maintain constant burner loading, it would be necessary for gas utilities to increase the volumetric flowrate by increasing the gas-line pressure. Typical gas-line regulators are able to accurately maintain a set pressure, which is critical because small variations in pressure can impact the burner loading. For example, a gas-line initially at 1930 Pa would need to be increased 45% to 2816 Pa for a 60% HBNG blend, which is an increase of less than 4 in H20. This highlights the importance of testing appliances using the pressure regulators set out in CSA B149.1:20, as gas flowrate can impact emissions and potentially flame stability.
The SWH and SHB both condensed the flue gas to recover heat and improve efficiency, and the pH of condensate did not change between tests. The SHB also showed no change in flowrate, however the SWH condensate flowrate increased slightly. The appliance body surface temperatures, and process water temperatures did not change appreciably. As expected, the amount of time each appliance took to heat a volume of water increased slightly when compared to CNG, although the variability is significant and suggests that the difference is small enough that factors such as the gas flowrate, ambient temperature, and composition of the fuel can significantly impact the time an appliance takes to heat. The SWH and SHB flue stack temperature and volumetric flowrate also did not change significantly, and the appliances drew the same amount of power under HBNG blends. The burner temperatures for open-flame appliances did not materially change, and the time it took the burners to cool did not vary significantly, as shown in the forward-looking infrared (FLIR) image for 60% HBNG after 3 minutes of the burners turning off in Figure 11a, and the time to cool plot in Figure 11b showing temperature before ignition, during operation, and for 20 minutes after the appliance had turned off.
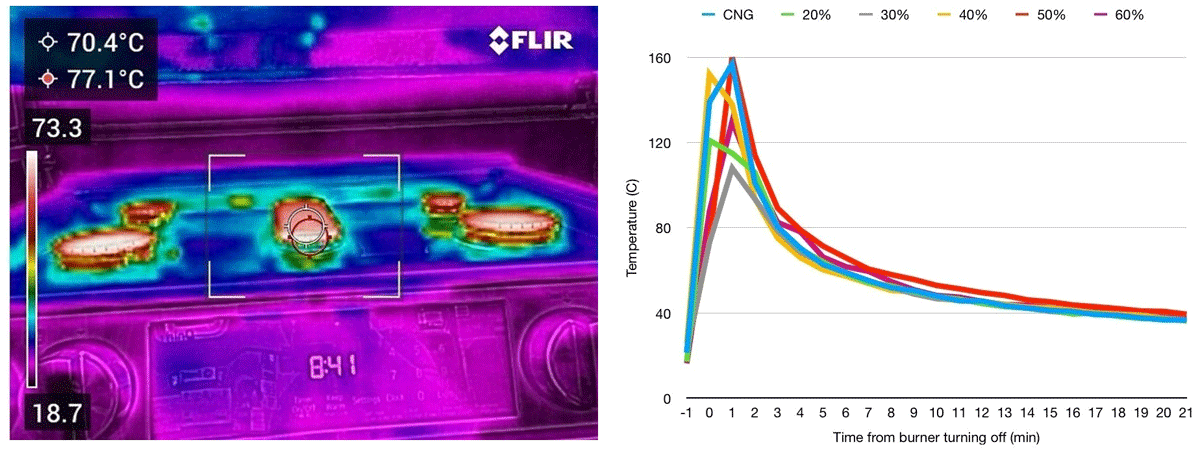
Figure 11
Stove FLIR photograph (left) and plot of burner temperature (right).
4.0 Conclusion
This study examined the operability of a post-meter gas network and four residential appliances – two heating devices (SWH, SHB) and two cooking appliances (stove, BBQ) – under hydrogen-natural gas blends using a distribution system designed to meet CSA B149.1:20 installation standards. The results suggest that the hydrogen tolerance of the gas network and appliances tested in this study is higher than previously reported in laboratory-scale experiments, with no observed flashback at ignition across all tested appliances up to 60% hydrogen. However, some burners experienced intermittent flashback upon flame extinguishment at 30–60% hydrogen, particularly in tube-style burners such as the oven broil and barbecue burners. Additionally, unstable flame behaviour at 60% hydrogen in these two appliances suggests that the upper safe blending limit for residential cooking appliances is below this threshold.
No leakage or operational safety issues were observed, although long-term tests are required to determine material compatibility. Key results, including emissions, burner noise, and condensate/pH, were largely consistent across hydrogen blends, with the exception of a slight increase in condensate volume for the SWH. Carbon monoxide and carbon dioxide emissions decreased as expected with increasing hydrogen content. Unlike prior results that suggest higher combustion noise with hydrogen, no clear trend was observed in this study. Gas flow measurements revealed that volumetric flowrates increased while mass flowrates decreased with hydrogen blending, consistent with orifice theory. To maintain consistent burner output, a gas-line pressure increase would be required.
These findings reinforce the need for further pilot-scale studies that incorporate real-world distribution system components rather than relying solely on lab-scale testing with externally controlled pressure/flowrates. Future studies should explore the relationship between gas-line pressure and flashback behaviour in greater detail, investigate long-term burner wear from intermittent flashback, and assess operability across a wider range of residential appliances, especially on appliances that have previously been demonstrated at lab-scale to have low hydrogen tolerance. This study also focused only on testing new appliances, and it will be important to determine whether factors such as appliance age impacts the upper limit of hydrogen blending.
Data Accessibility Statement
Due to the large size of datasets and appliance manufacturer confidentiality agreements, the full data is not available online. Where possible, data will be made available upon request to the corresponding author at Theodore.Street@dal.ca.
Acknowledgements
The authors acknowledge financial support provided by the Natural Sciences and Engineering Research Council of Canada. Natural gas was provided by Eastward Energy.
Competing Interests
The authors have no competing interests to declare.
Author Contributions
Michael J. Pegg: Editing/review, Supervision, project administration, funding acquisition, conceptualisation.
Theodore E. Street: Writing, data collection and analysis, editing.