
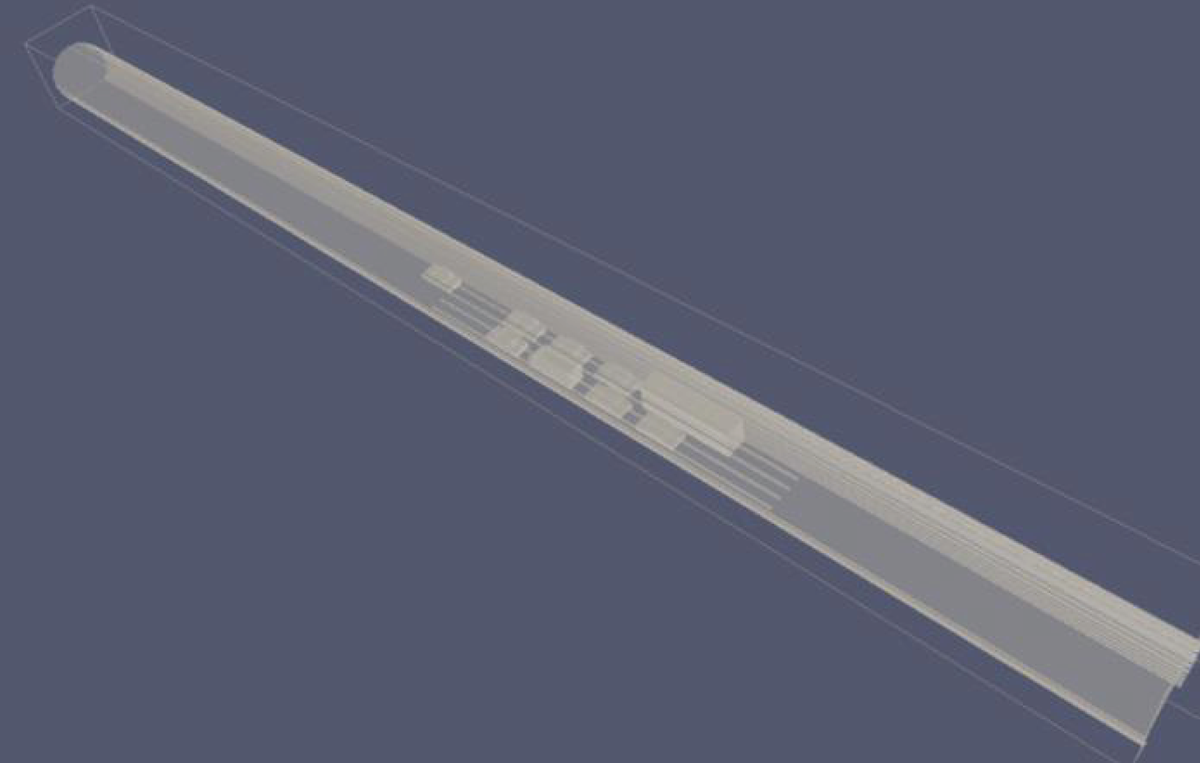
Figure 1
Geometrical model of tunnel facility with nine vehicles, including cars, a van, and a bus.
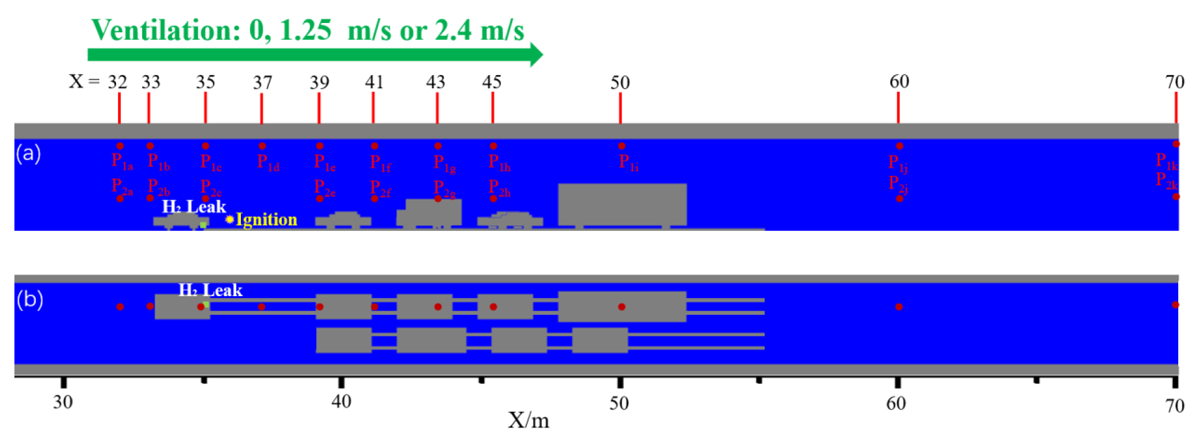
Figure 2
Computational domain views in a vertical cut (a) and in a horizontal cut (b), showing the layout of vehicle models and the positions of pressure gauges modelled in simulations.
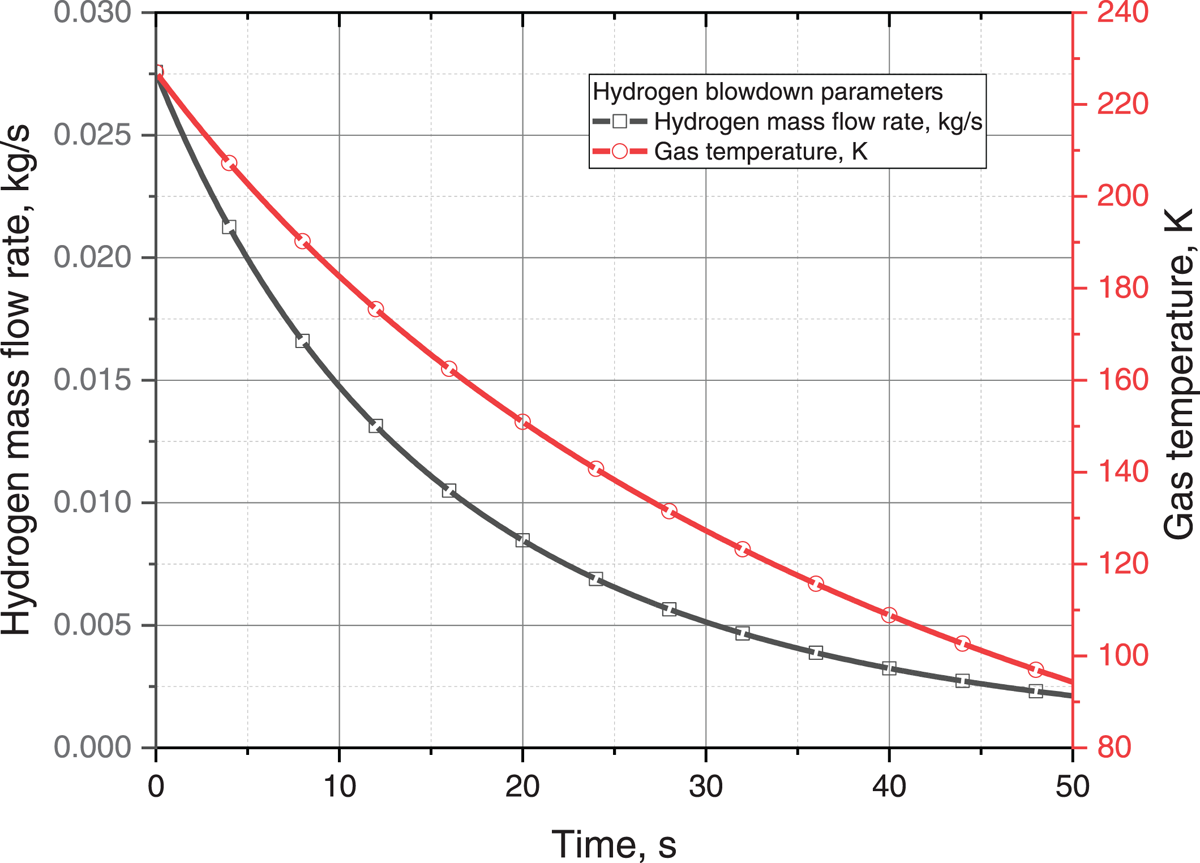
Figure 3
Adiabatic H2 blowdown parameters at effective nozzle: mass flow rate (kg/s) and temperature (K), approximately equivalent to H2 release through a TPRD nozzle diameter of 2.24 mm from a storage tank of 0.053 m3 at 118 bar.

Figure 4
Misted region in the tunnel.
Table 1
Simulation cases with variant ventilations and ignition times with or without water mist.
| VENTILATION VELOCITY, m/s | IGNITION TIME WITHOUT MIST, s | IGNITION TIME WITH MIST, s | ||
|---|---|---|---|---|
| 2.5 | 5.1 | 9.2 | 5.1 | |
| 0 | A | B | C | J |
| 1.25 | D | E | F | K |
| 2.40 | G | H | I | L |
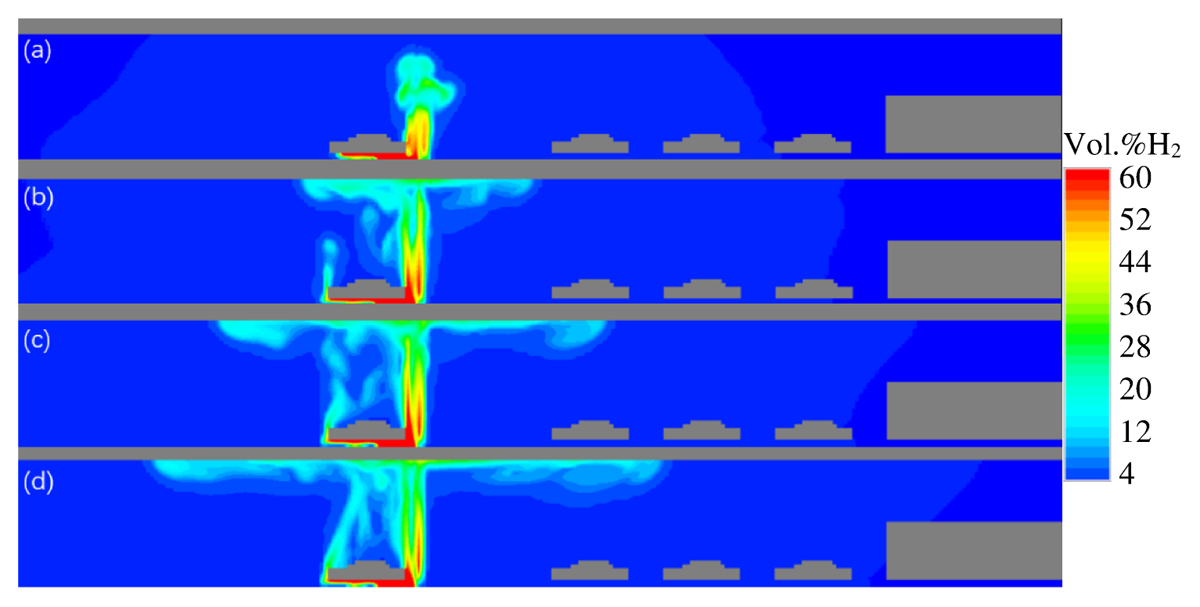
Figure 5
Hydrogen concentration contours in a longitudinal vertical cut through TPRD nozzle without ventilation at t = (a) 2.5 s; (b) 5 s; (c) 7 s; (d) 9 s.
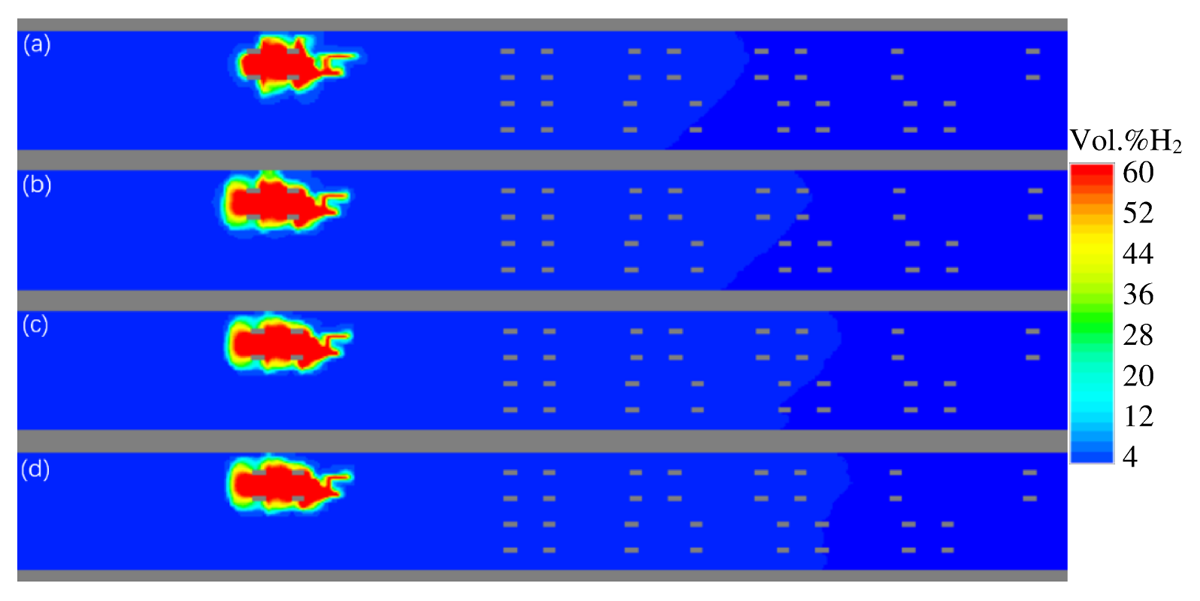
Figure 6
Hydrogen concentration contours in a horizontal view right below the chassis of the leaking vehicle without ventilation at t = (a) 2.5 s; (b) 5 s; (c) 7 s; (d) 9 s.
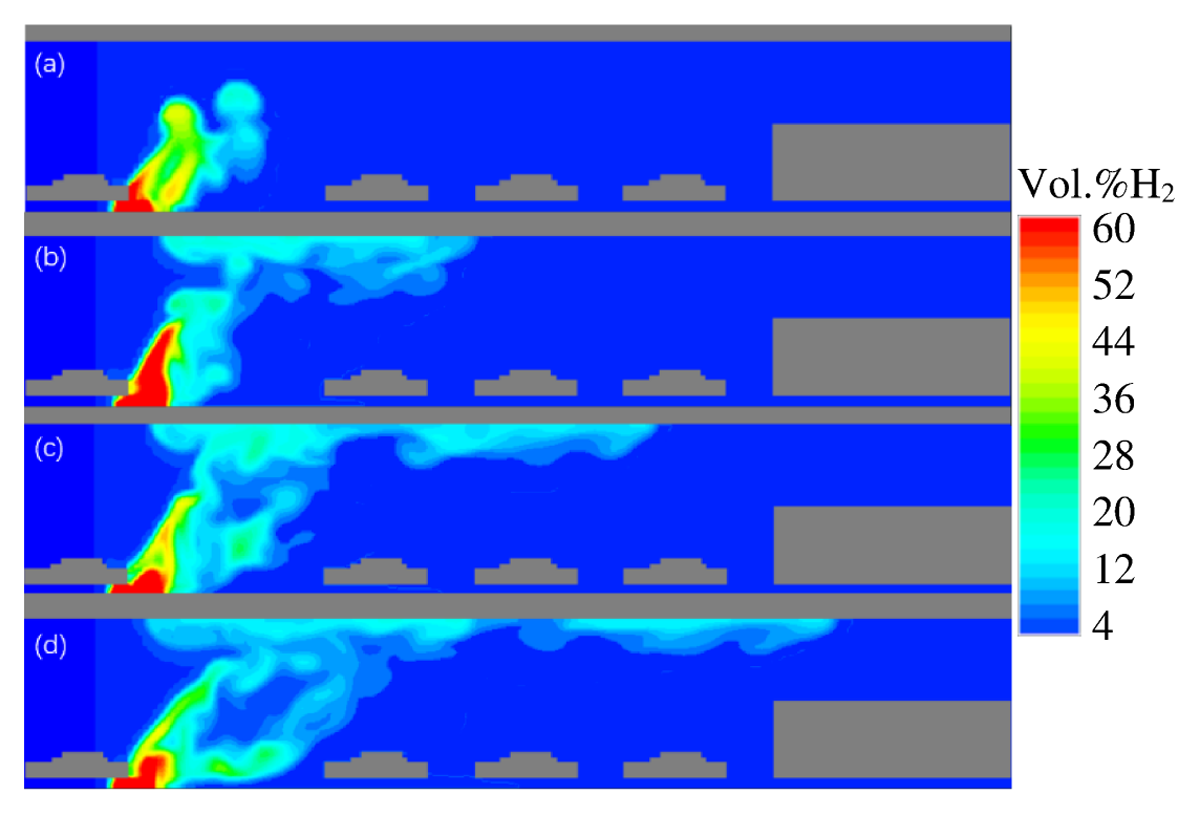
Figure 7
Hydrogen concentration contours in a longitudinal vertical cut through TPRD nozzle with 1.25 m/s ventilation at t = (a) 2.5 s; (b) 5 s; (c) 7 s; (d) 9 s.
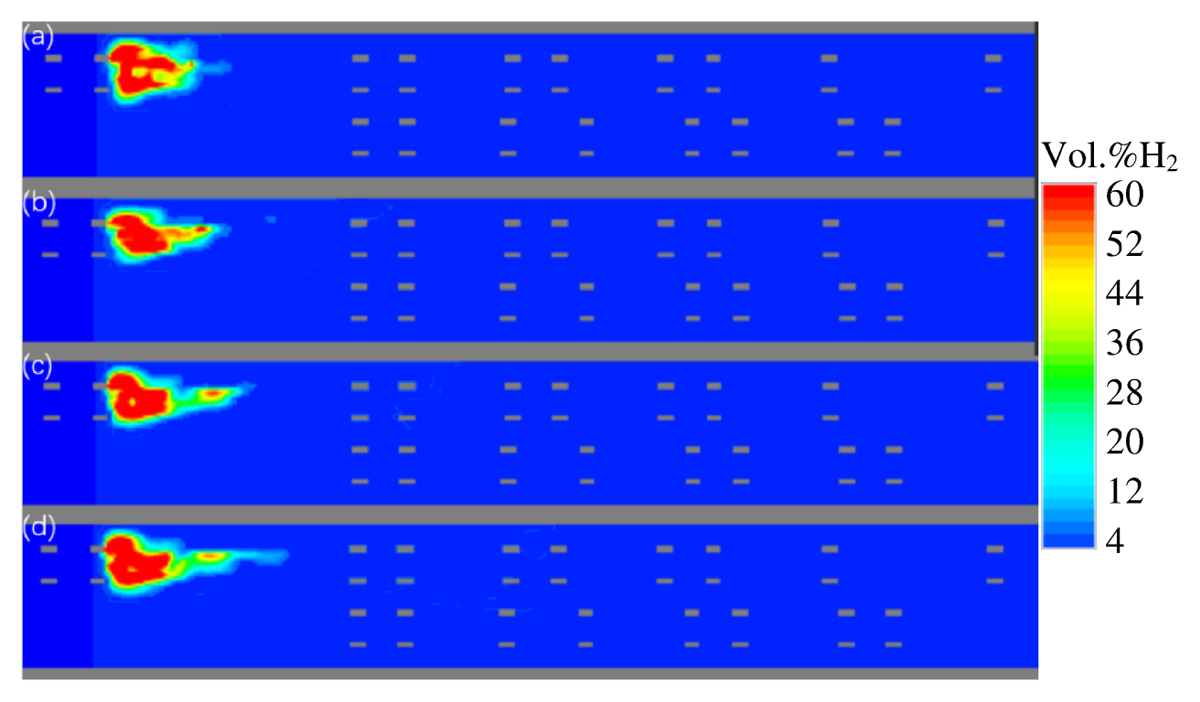
Figure 8
Hydrogen concentration contours in a horizontal view right below the chassis of the leaking vehicle with 1.25 m/s ventilation at t = (a) 2.5 s; (b) 5 s; (c) 7 s; (d) 9 s.
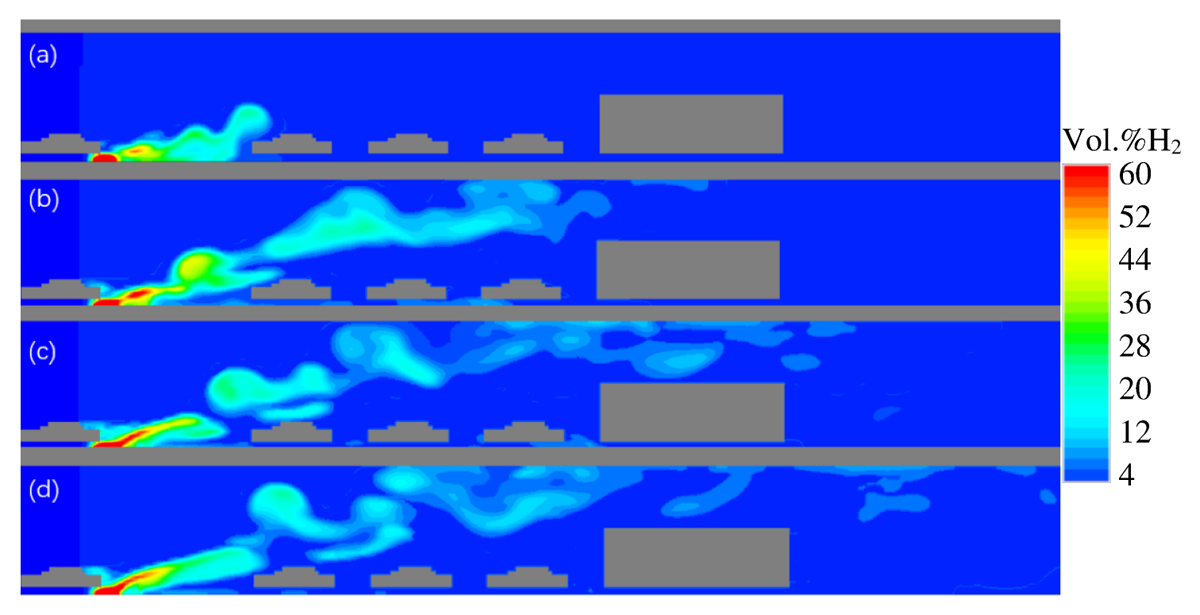
Figure 9
Hydrogen concentration contours in a longitudinal vertical cut through TPRD nozzle with 2.4 m/s ventilation at t = (a) 2.5 s; (b) 5 s; (c) 7 s; (d) 9 s.
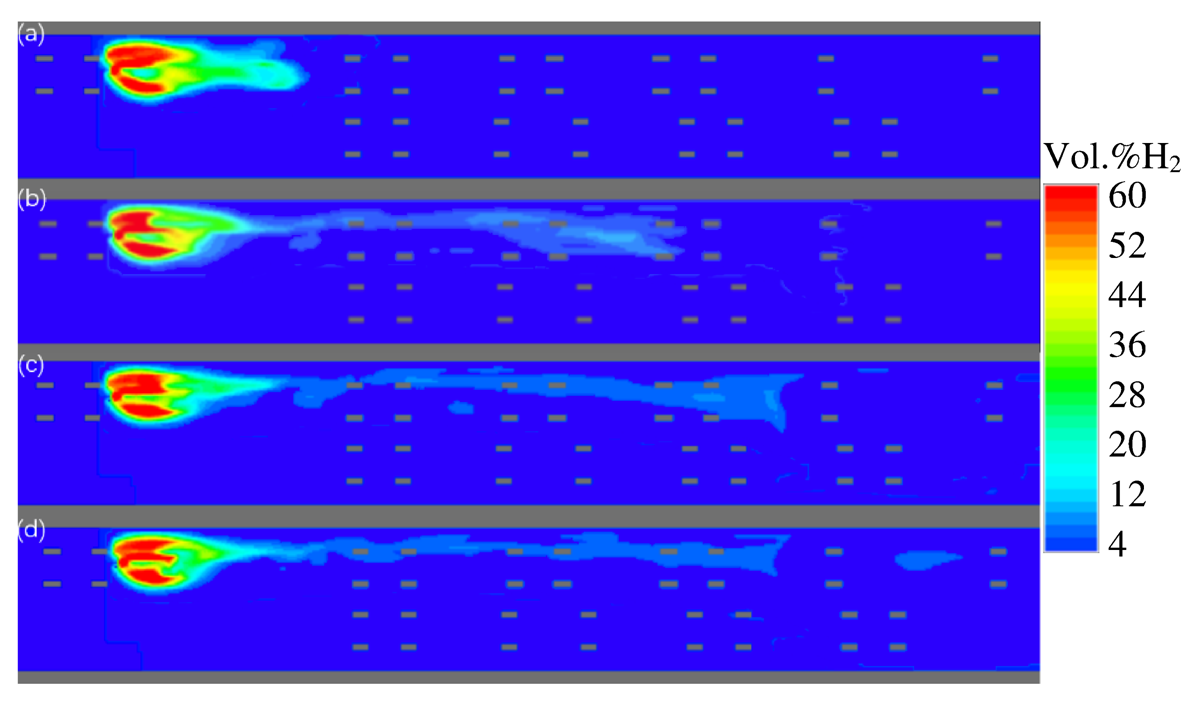
Figure 10
Hydrogen concentration contours in a horizontal view right below the chassis of the leaking vehicle with 2.4 m/s ventilation at t = (a) 2.5 s; (b) 5 s; (c) 7 s; (d) 9 s.
Table 2
Maximum overpressure for various cases.
| VENTILATION VELOCITY, m/s | MAXIMUM OVERPRESSURE, Pa | |||
|---|---|---|---|---|
| IGNITION TIME WITHOUT MIST, s | IGNITION TIME WITH MIST, s | |||
| 2.5 | 5.1 | 9.2 | 5.1 | |
| 0 | 2335 | 2075 | 1514 | 1413 |
| 1.25 | 4226 | 5305 | 3882 | 3058 |
| 2.40 | 4550 | 4909 | 4473 | 3294 |
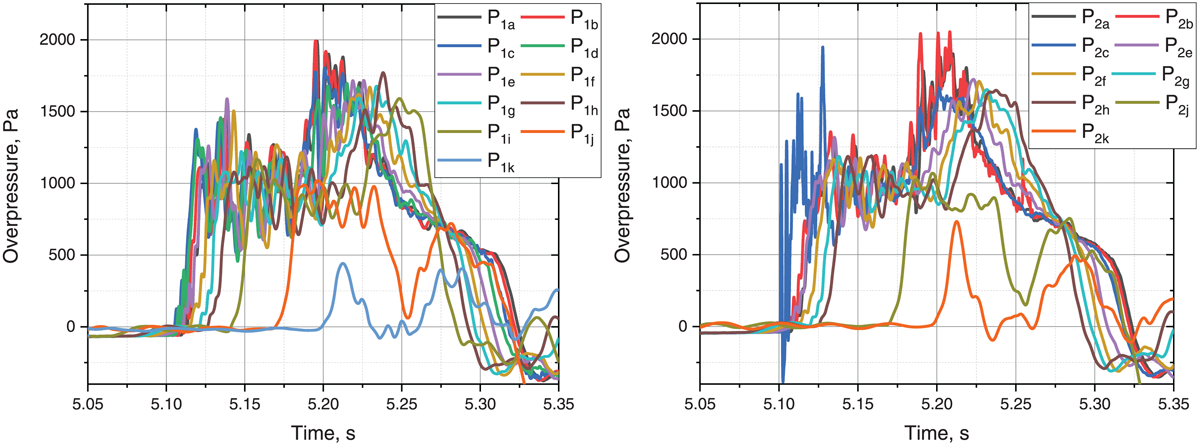
Figure 11
Overpressures in case of ignition time of 5.1 s without ventilation, without mist.
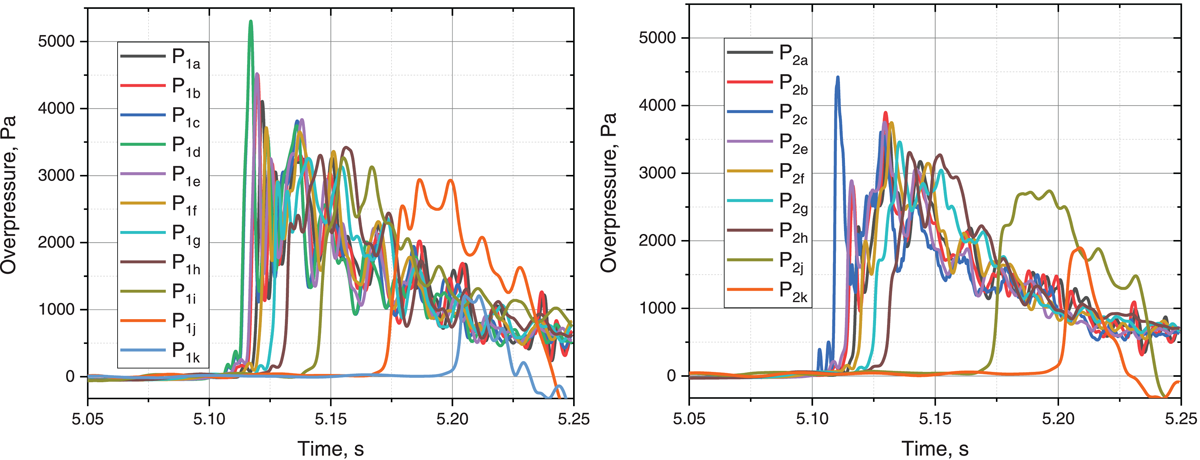
Figure 12
Overpressures in case of ignition time of 5.1 s with 1.25 m/s ventilation, without mist.
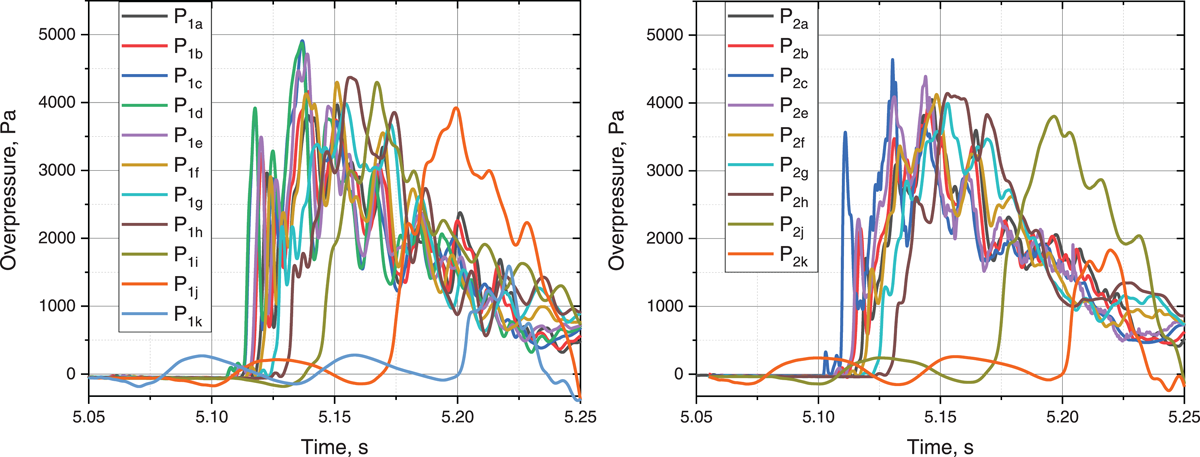
Figure 13
Overpressures in case of ignition time of 5.1 s with 2.4 m/s ventilation, without mist.
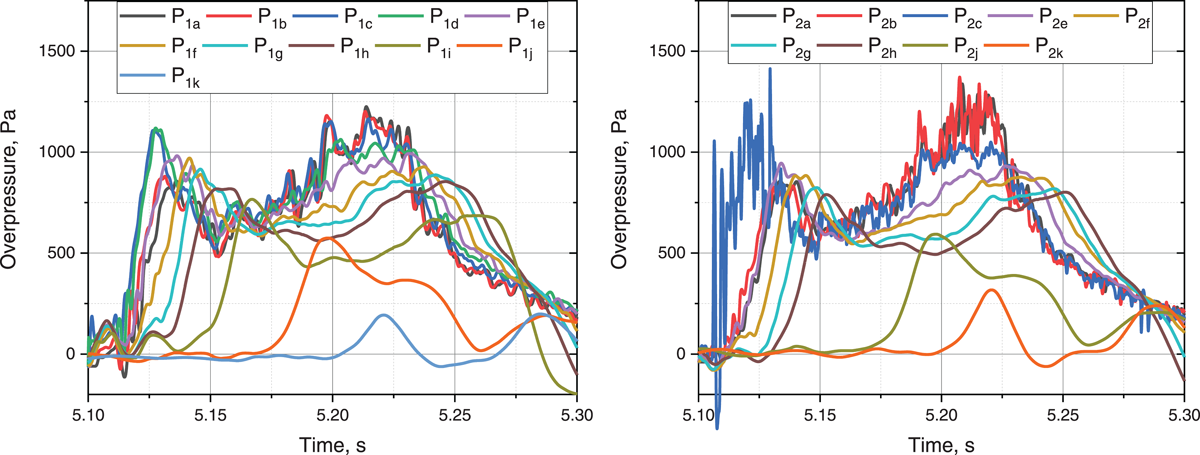
Figure 14
Overpressures in case of ignition time of 5.1 s without ventilation, with mist.
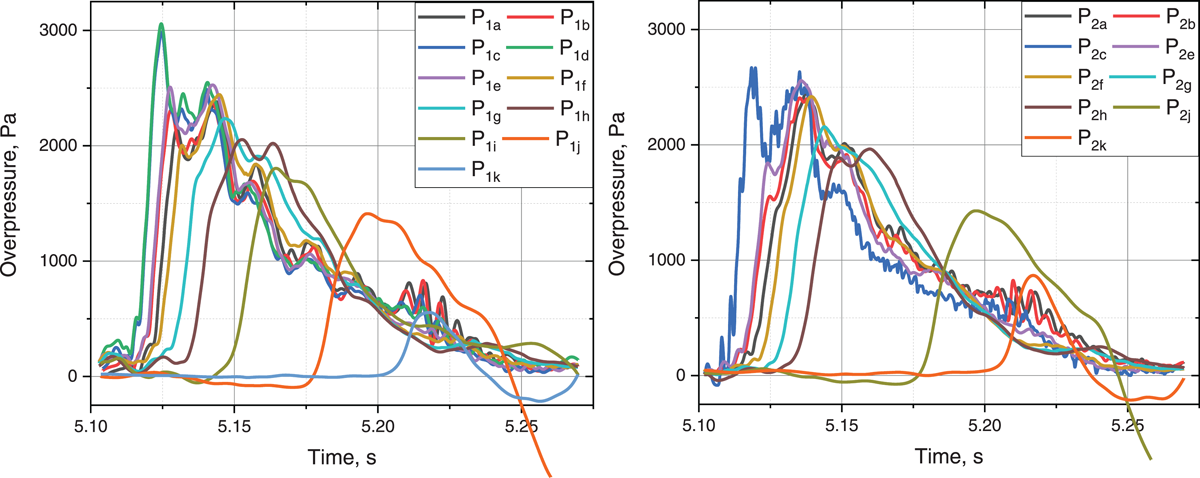
Figure 15
Overpressures in case of ignition time of 5.1 s with 1.25 m/s ventilation, with mist.
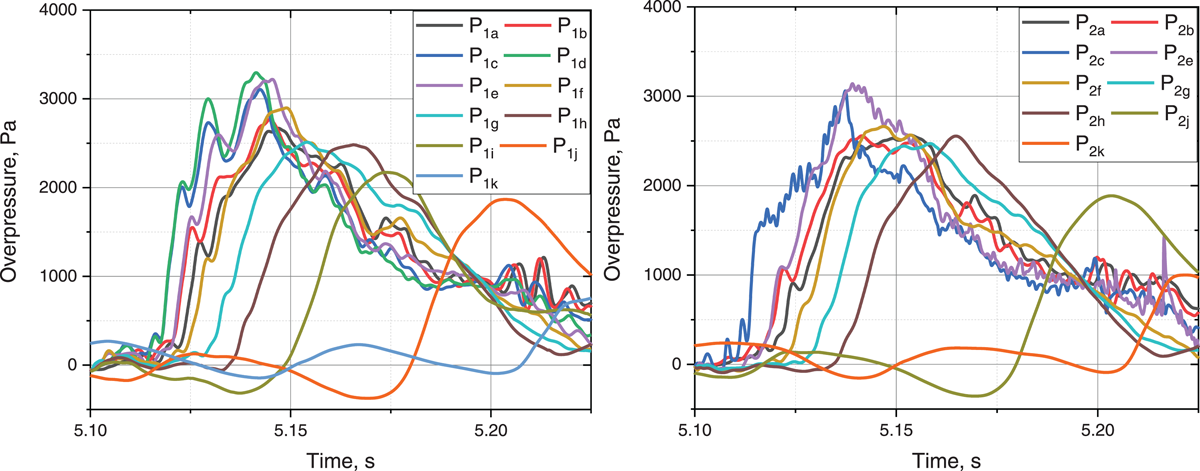
Figure 16
Overpressures in case of ignition time of 5.1 s with 2.4 m/s ventilation, with mist.