
1 Introduction
Tunnels are an increasingly important part of the traffic infrastructure, especially in territorially uneven mountain areas. They create challenges for the prevention and management of incidents/accidents, fire and explosion protection, and security against attacks or sabotage. The use of alternative fuels, including compressed gaseous hydrogen (CGH2) and cryogenic liquid hydrogen (LH2), in tunnels and similar confined spaces creates new challenges to the provision of life safety, property, and environment protection at an acceptable level of risk.
The confined feature of traffic tunnels may amplify the potential risk of hydrogen fuel cell vehicles (HFCVs) in accident scenarios. Due to the narrow space and auxiliary facilities and devices acting as blockages in tunnels, the tube might become an ideal place for hydrogen flame acceleration or even detonation if the hydrogen-related accidents are not properly mitigated. Ventilation systems in tunnels are traditionally designed to purify contaminants in air in normal operation and to control smoke in hydrogen-carbon fires caused by, e.g., conventional petroleum product-fueled vehicle accidents. In case of an HFCV accident, ventilation can also facilitate to disperse and exhaust unintentionally released hydrogen.
Another important mitigation measure is water spray or mist in tunnels, which can decrease fire growth, spread, and heat release rate of tunnel fires due to its cooling effect. It is an interesting topic to study the interaction between the distributed liquid droplets and hydrogen behaviours in tunnels.
Numerical modeling and CFD simulations of hydrogen distribution and combustion in tunnels or tunnel-like facilities were performed without water intervention, as reported in the literature (Baraldi et al., 2009; Breitung et al., 2000; Kumar et al., 2009; Middha and Hansen, 2009; Tolias et al., 2014). Physical and chemical mechanisms of micron-sized water mist affecting hydrogen flame structure, speed, and explosion pressure were investigated fundamentally by means of experiment in a closed chamber (Li et al., 2022). It is interesting that the phenomenon of an enhanced hydrogen explosion by mist-induced turbulence was observed in the tests. The mitigation effect of ultrafine water mist on the explosion of hydrogen–methane mixture was experimentally studied in an obstructed chamber by Wen et al. (2019). This study focuses on hydrogen deflagration suppressed by water mist in a tunnel facility.
2 Geometrical Models
The experimental tunnel modeled in this study is a 70 m long and 3.7 m diameter explosion testing facility located at the Health and Safety Executive’s (HSE) laboratory in the United Kingdom. The whole view of the tunnel model is shown in Figure 1. The tunnel has nominal dimensions of 70 m in length, 3.7 m in width, and 3.4 m in height. The circular profile of the cross-section of the tunnel structure has a diameter of 3.8 m in the model.
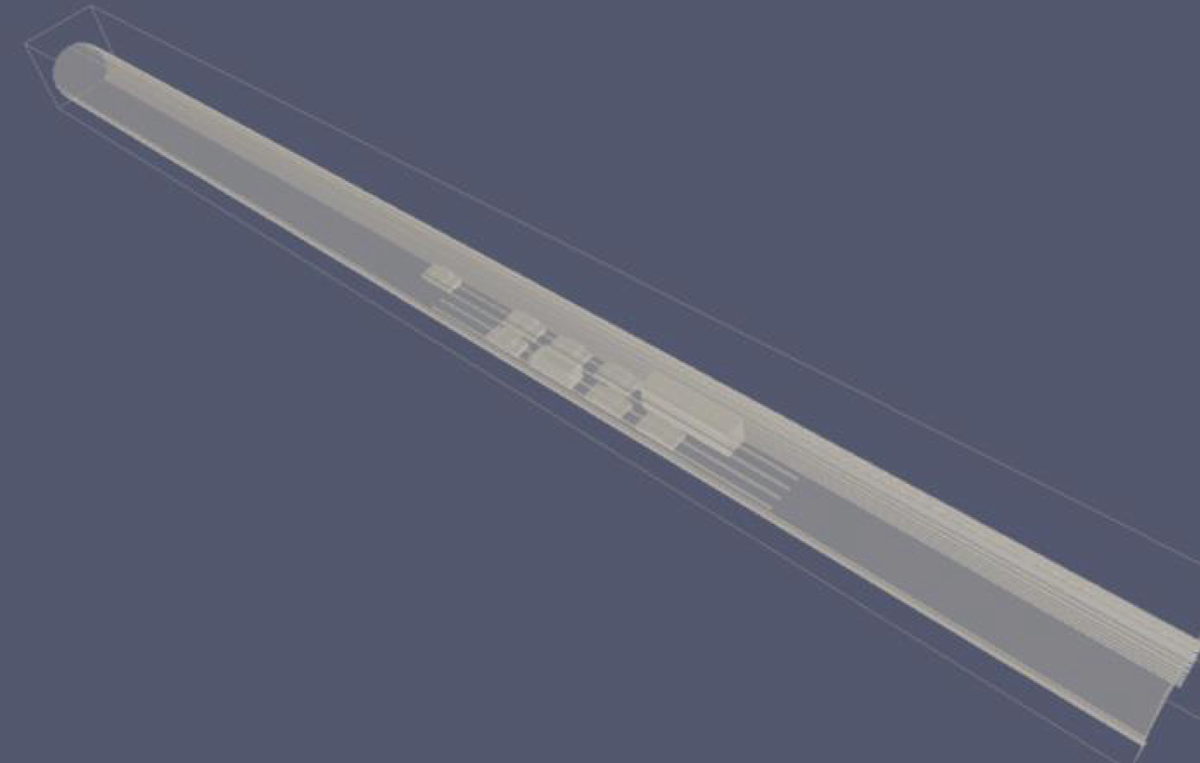
Figure 1
Geometrical model of tunnel facility with nine vehicles, including cars, a van, and a bus.
In total, nine properly scaled vehicles are modeled, including seven cars, a van, and a bus. They are arranged in two columns in the tunnel. Four cars are in one lane; the other three, together with the van and the bus, are in another lane. Each vehicle is located at the center of each lane with a uniform spacing distance of about 1 m, except the first car. It is assumed to be the failed HFCV, thus, has a larger distance to the second car behind. The dimensions of the car, the van, and the bus models are 2 × 0.9 × 0.6 m3, 2.4 × 0.9 × 1.1 m3, and 4.5 × 1.1 × 1.6 m3, respectively. For laboratory convenience, each column of vehicles is placed on two parallel rails, which are 0.1 m high and separated by 0.5 m. The hydrogen injection point is located beneath the chassis of the first car. The hydrogen release location is 35 m from the tunnel portal, namely, at the midpoint of the facility.
The calculation domain is discretized into 880,600 numerical cells with a uniform cell size of 0.1 m.
The layout of the vehicle models is further presented in Figure 2. To monitor the pressure evolution of hydrogen deflagration, two columns of pressure gauges are configured in simulations. The locations of the gauges in each column share the same height. The lower column is 1 m above the tunnel ground; the higher one is 3 m above the ground. Clearly, all the gauges are located above the hydrogen leaking point. The longitudinal x-coordinates of the pressure gauges are 32 m, 33 m, 35 m, 37 m, 39 m, 41 m, 43 m, 45 m, 50 m, 60 m, 70 m, respectively. The hydrogen leaking nozzle is beneath the first vehicle model, counted from the left-hand side, and is denoted as the small square in green in Figure 2. The ignition point is defined 0.8 m downstream from the leak and at 0.5 m above the tunnel ground, denoted as the dot in yellow in Figure 2(a).
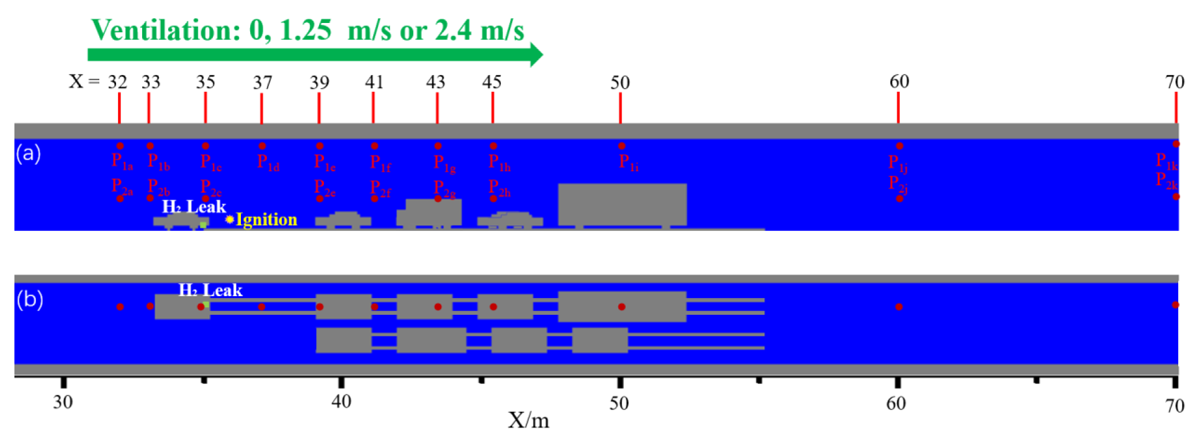
Figure 2
Computational domain views in a vertical cut (a) and in a horizontal cut (b), showing the layout of vehicle models and the positions of pressure gauges modelled in simulations.
The tunnel can be vented as needed by a longitudinal airflow from the left portal to the right. The ventilation flow velocity can be configured as 1.25 m/s or 2.4 m/s for the consideration of variant venting efficiencies.
3 Model Descriptions
3.1 COM3D code
The COMD3D code is a finite-difference code dedicated to simulate gas mixing and turbulent combustion, including explosions and detonations in complex large-scale industrial facilities. Based on well-established numerical practices, the compressible Navier–Stokes equations are solved in three-dimensional Cartesian space to reproduce flow field details. By solving the governing equations of momentum, total energy and mass, and transport equations of each species, the code offers 3D fluid dynamic distributions of species, velocity, density, turbulence, and discrete particles, and thermodynamic parameters of pressure and temperature (Kotchourko et al., 2021).
3.2 Simplified two-phase flow
Hydrogen deflagration and detonation are fast processes that always takes place in a relatively short time, e.g., less than 0.5 s in the studied case of deflagration in the tunnel model. According to the estimations of heat absorption by droplets (Mohacsi, 2020), thermal process and phase change are relatively slow compared to fast combustion processes, including deflagration and detonation. Therefore, vaporization or condensation is ignored in the study. It is assumed that the liquid droplets distribute uniformly in a computing cell. The liquid phase is treated like a normal gas species while solving the total energy equation. The treatment can be called a simplified homogeneous two-phase flow model.
3.3 Lagrangian particle model
According to the Lagrangian particle model assumptions, the liquid droplets are modeled as discrete entities, which can be entrained and transported by the accompanying gas flow. The aerodynamic drag force is the main contributor to entrain a particle. The particle momentum equation is shown as follows:
1
where
md: droplet or particle mass, kg,
: droplet velocity, m/s,
rd: droplet radius, m,
ρg: surrounding gas density, kg/m3,
CD: drag coefficient, which is a function of Reynolds number of droplet,
: droplet velocity relative to gas, m/s.
The liquid phase is transported in the form of droplets (particles) by solving the particle dynamic equations.
4 Simulations
4.1 Hydrogen source and ignition
It is assumed that hydrogen is released adiabatically from a scaled high-pressure storage tank, with a volume of 0.053 m3 at a pressure of 118 bar. Notional nozzle concept is applied to determine the hydrogen blowdown dynamics. The mass flow rate and the temperature of hydrogen source at the effective nozzle are shown in Figure 3, as a boundary condition for simulations. Such an assumption is equivalent to a nozzle diameter of 2.24 mm of a thermally-activated pressure relief device (TPRD). The direction of hydrogen injection is assumed downwards to the ground.
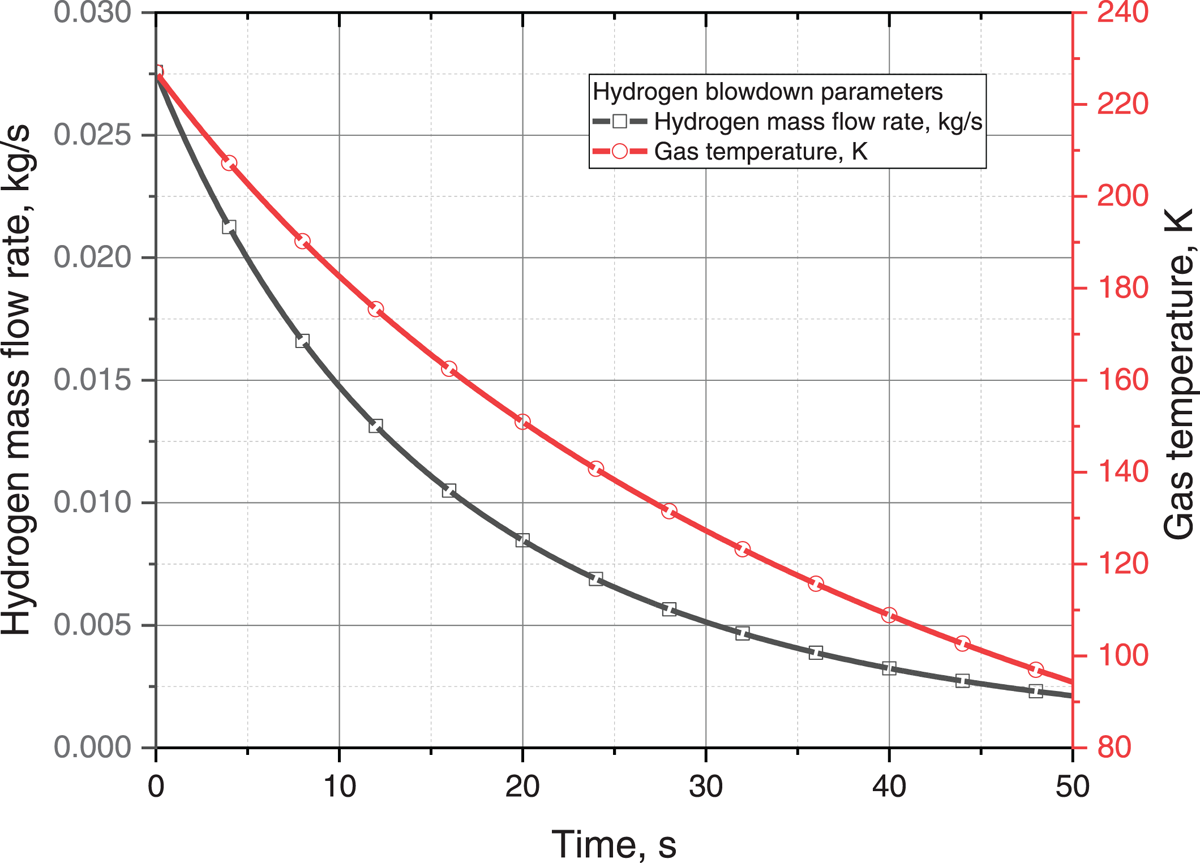
Figure 3
Adiabatic H2 blowdown parameters at effective nozzle: mass flow rate (kg/s) and temperature (K), approximately equivalent to H2 release through a TPRD nozzle diameter of 2.24 mm from a storage tank of 0.053 m3 at 118 bar.
As mentioned in Section 2, a numerical mesh of 0.1 m cell size is configured to model the 70 m-long tunnel, due to limited computational resources. Such a coarse mesh cannot reproduce the detailed features of a blowdown jet flow, e.g., with a partial loss of the jet momentum. However, the simplification does not influence the main task to study the deflagration of the dispersed hydrogen cloud, which is the main goal of the study.
The timing to ignite the dynamically developing hydrogen cloud is selected by considerations. It is defined with attempts to find the worst-case scenario as possible, when the ignited cloud may generate the highest overpressure of hydrogen deflagration. Due to the decaying character of the blowdown mass flux and the enhanced hydrogen dispersion by ventilation, it was found after many trails that the highest overpressure of combustion occurs neither with very early ignitions nor with very late ignitions. Thus, the timings for ignition are determined at 2.5 s, 5.1 s, or 9.2 s, with 0 s defined at the starting moment of hydrogen blowdown.
4.2 Water mist configuration
Water mist is configured to fill the whole gas volume of the tunnel section between the left end of the first vehicle to the right end of the last bus model, as shown in Figure 4. The configuration is certainly an idealized scenario mimicking a pre-misted region in the test facility. In a real tunnel operation, the misted region can be formed only after mist generators are activated by a detection signal of hydrogen release. A droplet diameter of 500 µm and a liquid phase (water) concentration of 10 kg/m3 are defined, which lead to 2.9 × 10¹⁰ real droplets in total. It is clearly not feasible to simulate every single droplet of such a huge number. Therefore, a model of droplet multiplication factor has been developed for the code. The factor determines the number of real droplets that are initialized in one cell and are calculated collectively. By specifying a droplet multiplication factor of 1.45 × 10⁶, only a number of 20,000 simulating droplets are calculated representatively. The droplets are still initially at a temperature of 298 K.

Figure 4
Misted region in the tunnel.
4.3 Boundary and initial conditions
Common boundary conditions for simulations are as follows: ambient temperature 298 K; ambient pressure 1.013 × 10⁵ Pa; gravity 9.81 m/s2; ventilation velocity (horizontally from left to right) 0 m/s, 1.25 m/s; and 2.4 m/s, respectively.
By considering the variables, a simulation case matrix is summarized in Table 1.
Table 1
Simulation cases with variant ventilations and ignition times with or without water mist.
| VENTILATION VELOCITY, m/s | IGNITION TIME WITHOUT MIST, s | IGNITION TIME WITH MIST, s | ||
|---|---|---|---|---|
| 2.5 | 5.1 | 9.2 | 5.1 | |
| 0 | A | B | C | J |
| 1.25 | D | E | F | K |
| 2.40 | G | H | I | L |
The 12 scenarios listed in Table 1 are simulated by using the COM3D code. Hydrogen concentrations and overpressures caused by hydrogen deflagration are computed to analyze the mitigation effect of ventilation and water mist under different configurations.
4.4 Results
4.4.1 Ventilation influence on hydrogen distribution
As the starting case, hydrogen distribution is simulated without ventilation. The growing hydrogen cloud at different evolution times is shown in Figure 5. Due to the downward injection of hydrogen, the jet flow impinges on the tunnel ground and loses most of its momentum. The released hydrogen then disperses beneath the vehicle chassis, as shown in Figure 6. Hydrogen then arises around the vehicle due to the dominated buoyancy, until the cloud front touches the tunnel ceiling, where it continues to spread in both directions. Hydrogen accumulates noticeably along the ceiling, forming a stratified and stable flammable mixture.
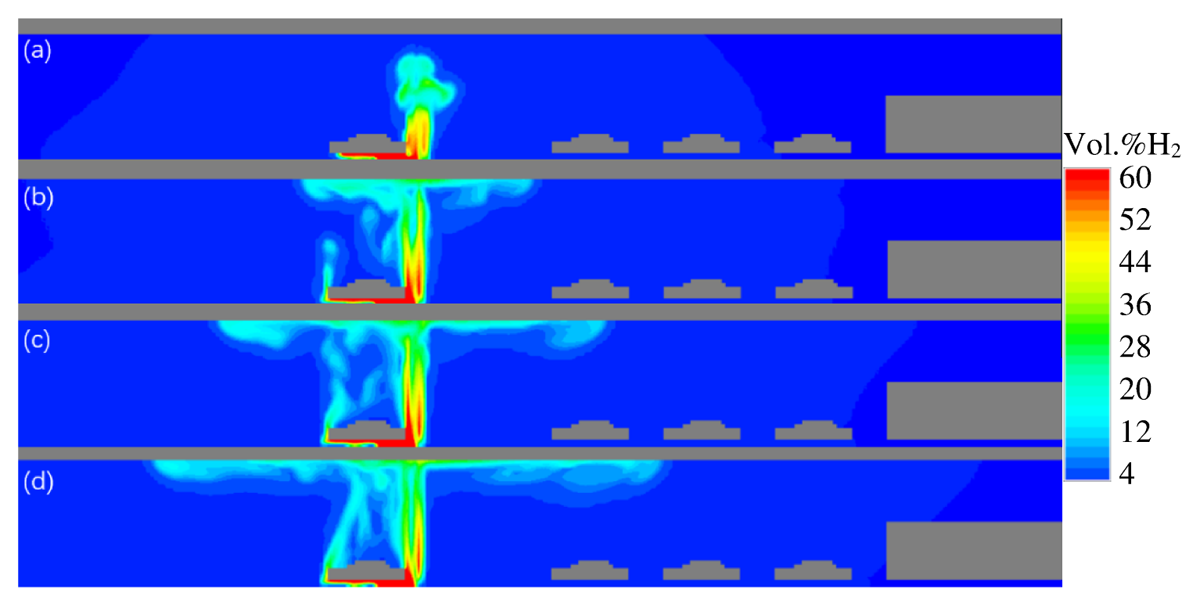
Figure 5
Hydrogen concentration contours in a longitudinal vertical cut through TPRD nozzle without ventilation at t = (a) 2.5 s; (b) 5 s; (c) 7 s; (d) 9 s.
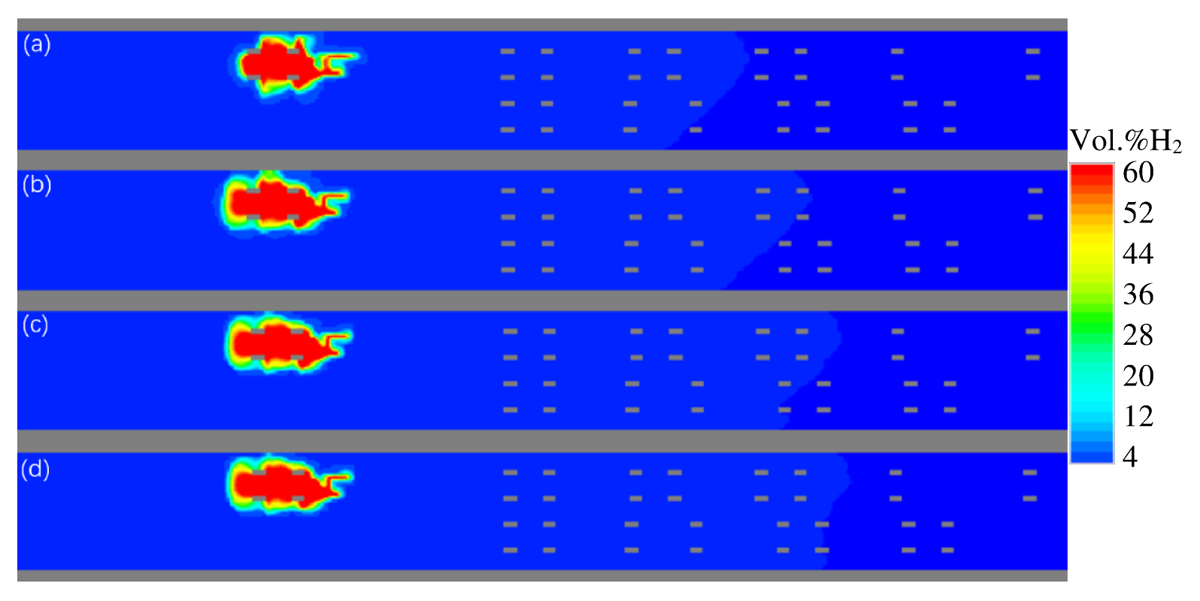
Figure 6
Hydrogen concentration contours in a horizontal view right below the chassis of the leaking vehicle without ventilation at t = (a) 2.5 s; (b) 5 s; (c) 7 s; (d) 9 s.
In case of the 1.25 m/s ventilation, the evolutional hydrogen concentration contour plots are shown in Figure 7. It shows that almost all the released hydrogen is blown to the downstream of the ventilation flow. The hydrogen distribution in the horizontal cut below the chassis, as shown in Figure 8, indicates the same tendency. Figure 7 shows that the hydrogen cloud arises because of its lighter density while it is entrained by the ventilation flow toward the downstream. Thus, the contacting point of hydrogen cloud on the ceiling is shifted by about 2.5 m downstream due to the ventilation. Figure 7(b, c, d) shows that only a small fraction of hydrogen diffuses backwards to upstream while the major cloud spreads along the ceiling to downstream. A continuous flammable hydrogen–air mixture is formed on the ceiling.
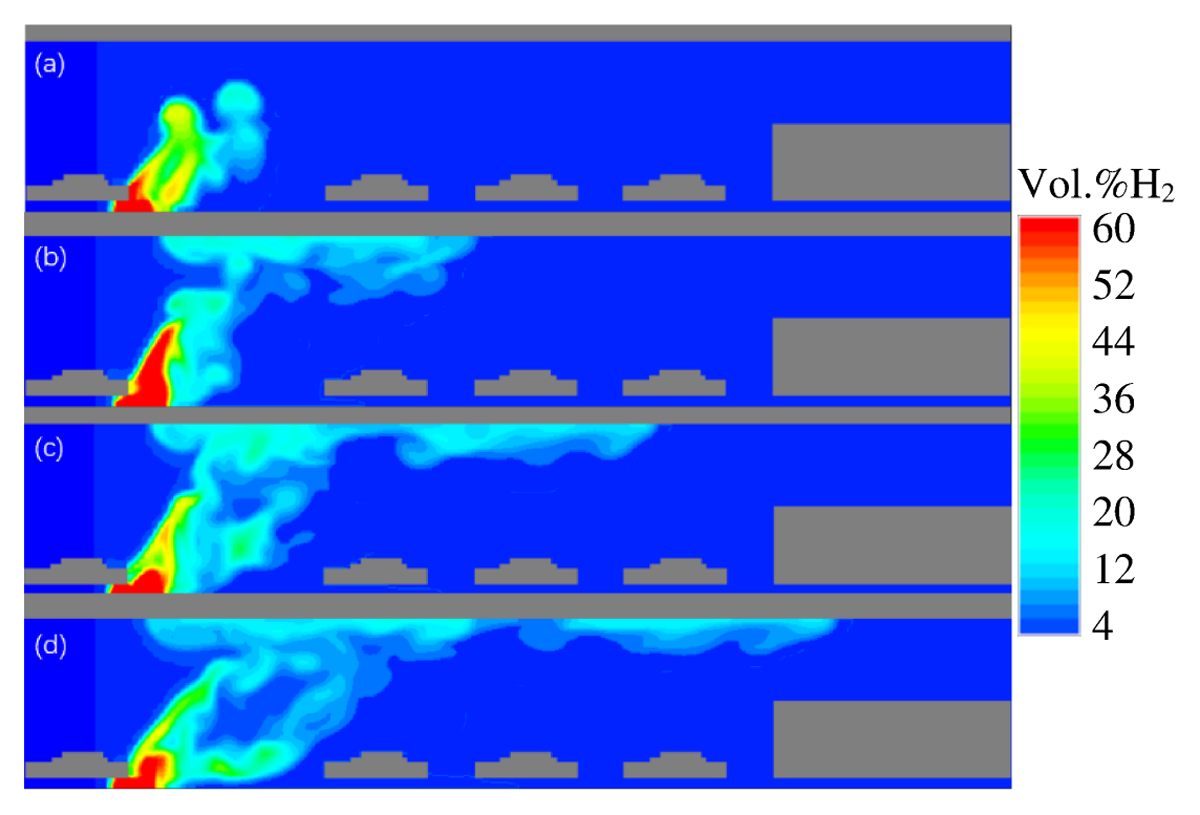
Figure 7
Hydrogen concentration contours in a longitudinal vertical cut through TPRD nozzle with 1.25 m/s ventilation at t = (a) 2.5 s; (b) 5 s; (c) 7 s; (d) 9 s.
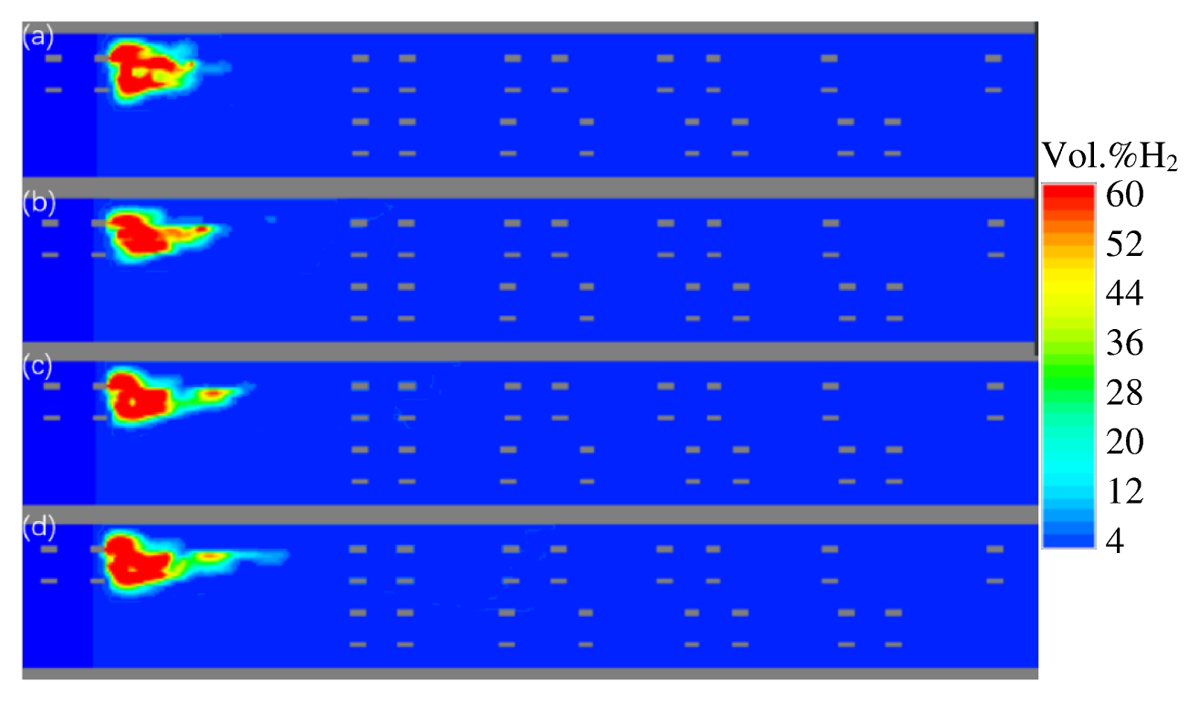
Figure 8
Hydrogen concentration contours in a horizontal view right below the chassis of the leaking vehicle with 1.25 m/s ventilation at t = (a) 2.5 s; (b) 5 s; (c) 7 s; (d) 9 s.
If the ventilation is enhanced to 2.4 m/s, the developing process of the hydrogen cloud is shown in Figure 9, and the hydrogen distribution in a horizontal cut below the chassis is shown in Figure 10. Due to the strong ventilation, the released hydrogen is dispersed effectively and the front profile of the hydrogen cloud is not stable. There is no serious accumulation of hydrogen on the ceiling. Figure 10 indicates that the leaking hydrogen cannot distribute beneath the chassis, instead it is vented away to the downstream and rises upwards.
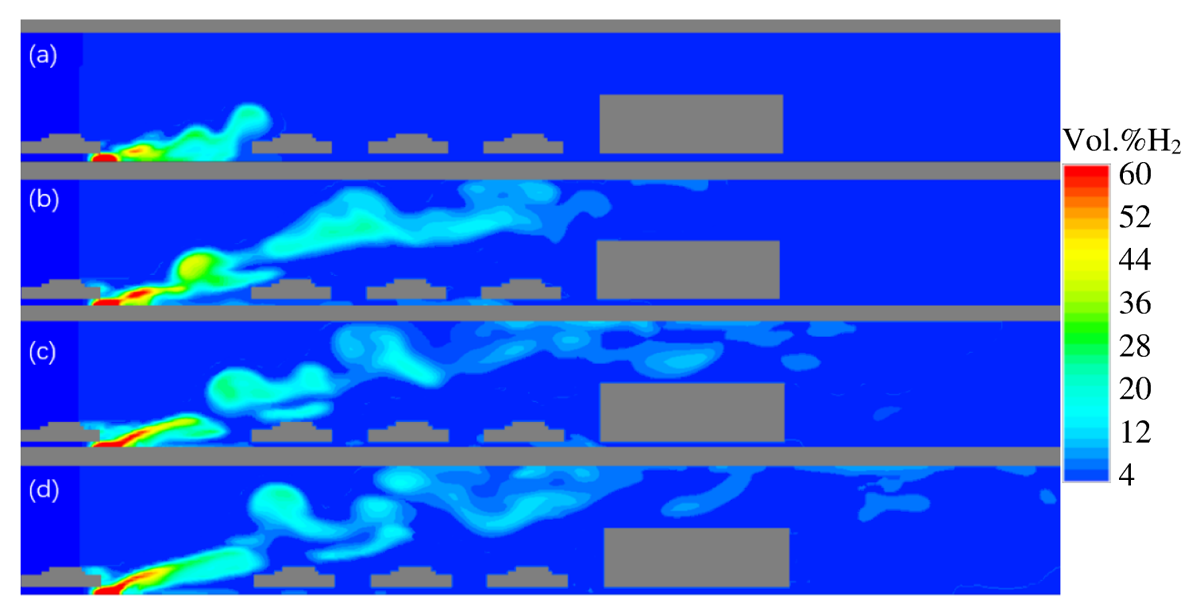
Figure 9
Hydrogen concentration contours in a longitudinal vertical cut through TPRD nozzle with 2.4 m/s ventilation at t = (a) 2.5 s; (b) 5 s; (c) 7 s; (d) 9 s.
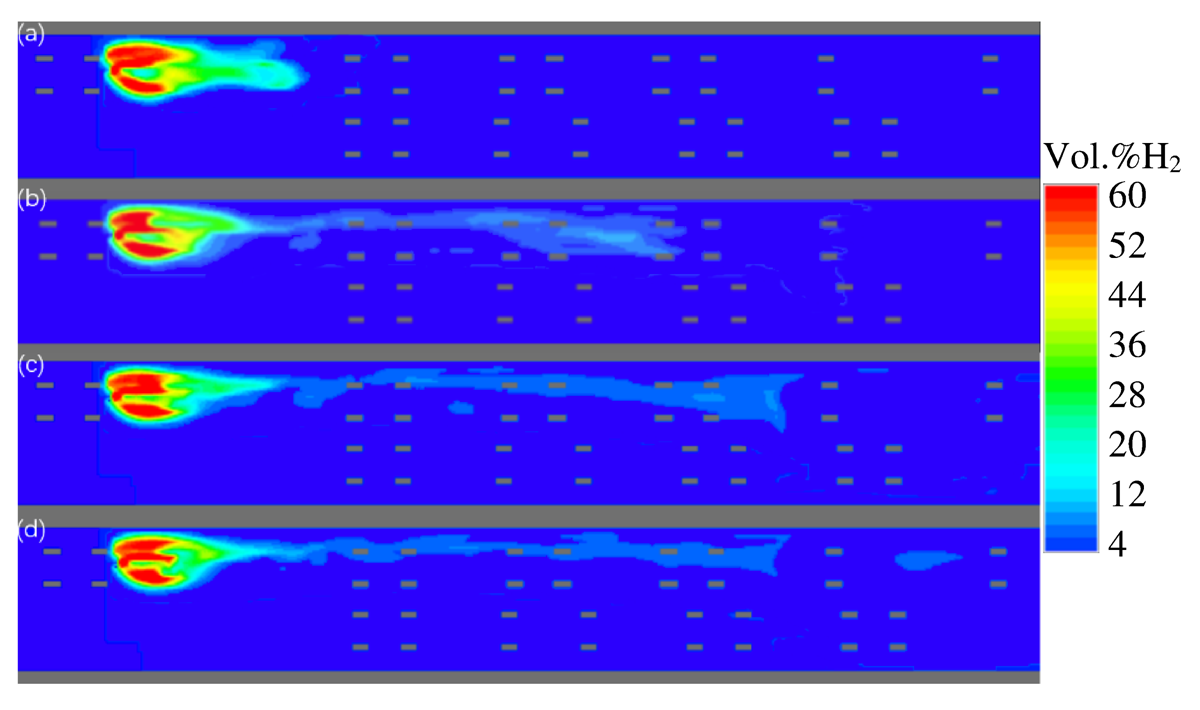
Figure 10
Hydrogen concentration contours in a horizontal view right below the chassis of the leaking vehicle with 2.4 m/s ventilation at t = (a) 2.5 s; (b) 5 s; (c) 7 s; (d) 9 s.
By comparing Figures 5 and 7, it seems that the dimension of the hydrogen cloud with concentrations, such as >30 vol.% H2, is greater in Figure 7 than in Figure 5. It can be explained that the hydrogen disperses only in one direction (downstream) in the tunnel in the case of ventilation, but the hydrogen disperses in both directions in the case of no ventilation. In other words, the hydrogen concentration in the downstream region may be doubled somehow by the ventilation. It is quite certain that the dimension of the hydrogen cloud with concentrations >30 vol.% H2 in Figure 9 is smaller than that of Figure 7, because of the stronger mixing caused by the enhanced ventilation in the case of Figure 9.
4.4.2 Hydrogen deflagration without mist
The distributed hydrogen cloud in the tunnel is ignited without the interference of water mist. The overpressures caused by hydrogen combustion are computed with a ventilation velocity of 0 m/s, 1.25 m/s, and 2.4 m/s, and an ignition time at 2.5 s, 5.1 s, and 9.2 s, respectively. The influence of ventilation on the hydrogen combustion overpressure is discussed in this subsection. Meanwhile, the results supply a base for comparison to the cases with water intervention addressed in the next subsection.
Attention is focused on the overpressure produced by the hydrogen combustion in different cases. The two columns of pressure gauges are defined in the model, as shown in Figure 2. They record the local pressure time histories in the combustion field. The peak overpressure is obtained among the recordings of the gauges.
The nine combinations of three ventilation efficiencies by three ignition times define nine simulation cases without mist. The hydrogen combustion overpressures in the nine cases are listed in Table 2. According to the table, the highest overpressure occurs in the cases with the ignition time of 5.2 s if ventilation is available. Therefore, the pressure evolutions are addressed in details for the three cases with the ignition time of 5.2 s.
Table 2
Maximum overpressure for various cases.
| VENTILATION VELOCITY, m/s | MAXIMUM OVERPRESSURE, Pa | |||
|---|---|---|---|---|
| IGNITION TIME WITHOUT MIST, s | IGNITION TIME WITH MIST, s | |||
| 2.5 | 5.1 | 9.2 | 5.1 | |
| 0 | 2335 | 2075 | 1514 | 1413 |
| 1.25 | 4226 | 5305 | 3882 | 3058 |
| 2.40 | 4550 | 4909 | 4473 | 3294 |
The overpressure histories are shown in Figures 11, 12, 13, for the ventilation air flow velocity of 0 m/s, 1.25 m/s, and 2.4 m/s, respectively. The plots show the peak overpressures of combustion and the pressure front propagations along the tunnel. For an instance, an overpressure of 2000 Pa is indicated in Figure 11, which is recorded by the gauge P1a located at X = 37 m and 3 m above the ground. A fast combustion can produce a pressure shock even if the flame speed is subsonic. The traveling process of the pressure front is clearly reproduced in Figure 11. For example, the peak pressure arrives at the gauge P1d (X = 37 m) at 5.1155 s, P1i (X = 50 m) at 5.1505 s, and P1k (X = 70 m) at 5.2071 s. The propagating speed is about 371 m/s from the gauge P1d to P1i, and 353 m/s from P1i to P1k, averagely 360 m/s from P1d to P1k. The speed manifests that only deflagration occurs in the tunnel without detonation, which features normally in a supersonic speed. Actually, the subsonic flame front decelerates a little, namely, from 371 to 353 m/s, because the hydrogen fraction decays along the distance from the leaking location. The maximum overpressure of 2075 Pa is recorded for the case without ventilation, by the gauge P2b, as shown by the red curve in the second plot of Figure 11.
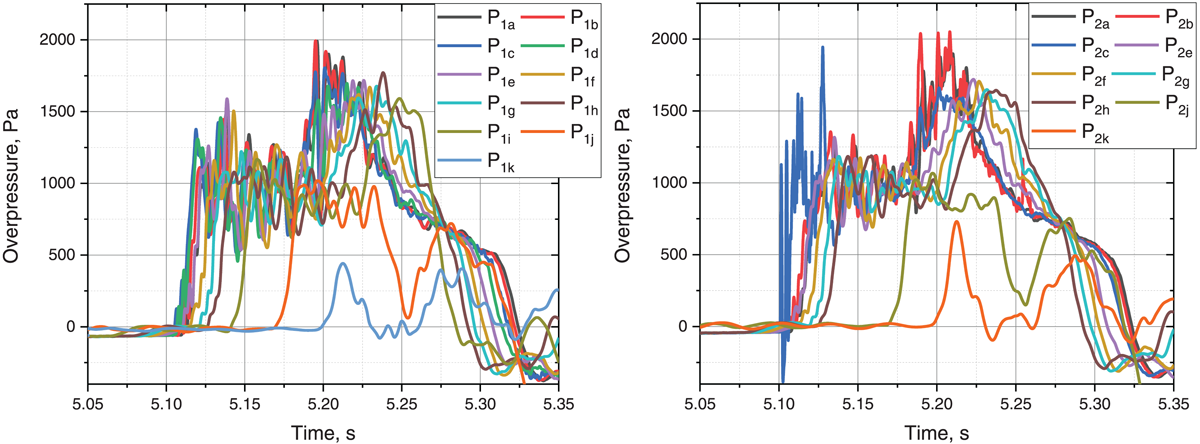
Figure 11
Overpressures in case of ignition time of 5.1 s without ventilation, without mist.
In the case of 1.25 m/s ventilation, as shown in Figure 12, the maximum overpressure is denoted by the gauge P1d as 5305 Pa. It is interesting that the peak overpressure is higher than that in the case without ventilation. It is consistent with the judgment made in Section 4.4.1 that a higher concentration of hydrogen cloud is formed due to the longitudinal ventilation. Therefore, its combustion produces a higher overpressure. The drawback of singular longitudinal ventilation measure for traffic tunnels can be eliminated practically by using a hybrid ventilation system combining both longitudinal jet fans and transverse venting ducts. Figure 12 also shows that the average flame speed is about 372 m/s from P1d to P1k. It is certainly subsonic in the deflagration regime.
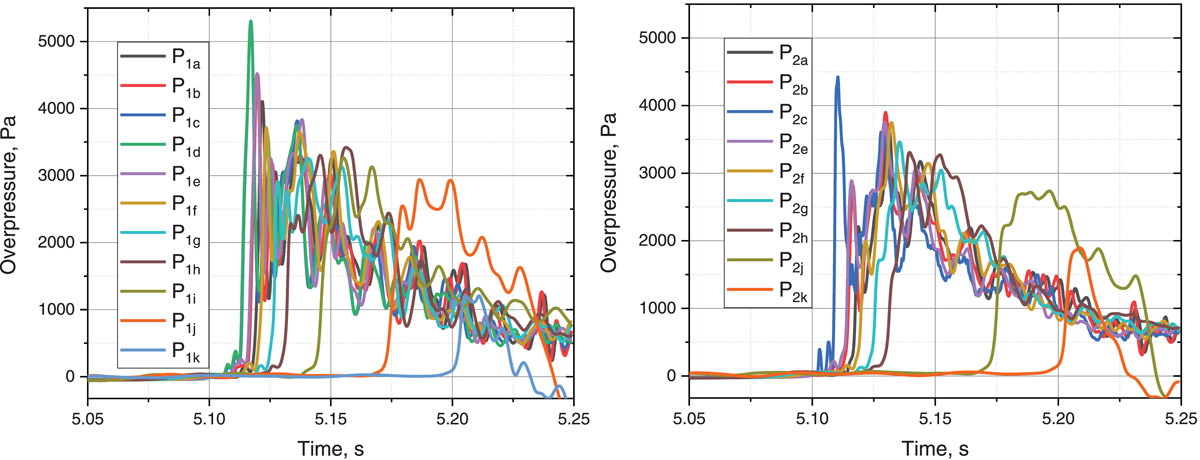
Figure 12
Overpressures in case of ignition time of 5.1 s with 1.25 m/s ventilation, without mist.
When the ventilation velocity is increased to 2.4 m/s, the predicted peak overpressure is 4909 Pa, recorded by the gauge P1c as shown in Figure 13. The stronger mixing between hydrogen and air brings a lower H2 concentration and a lower peak pressure. However, according to Figure 13, the traveling speed of the pressure front is coincidently the same (about 372 m/s) as that in the case of 1.25 m/s ventilation. This may be explained by the compromise between the intensified turbulence and the lowered H2 concentration. Both are the consequences of the stronger ventilation. However, the former promotes combustion and the latter suppresses. The result manifests the stochastic character of turbulent combustion process.
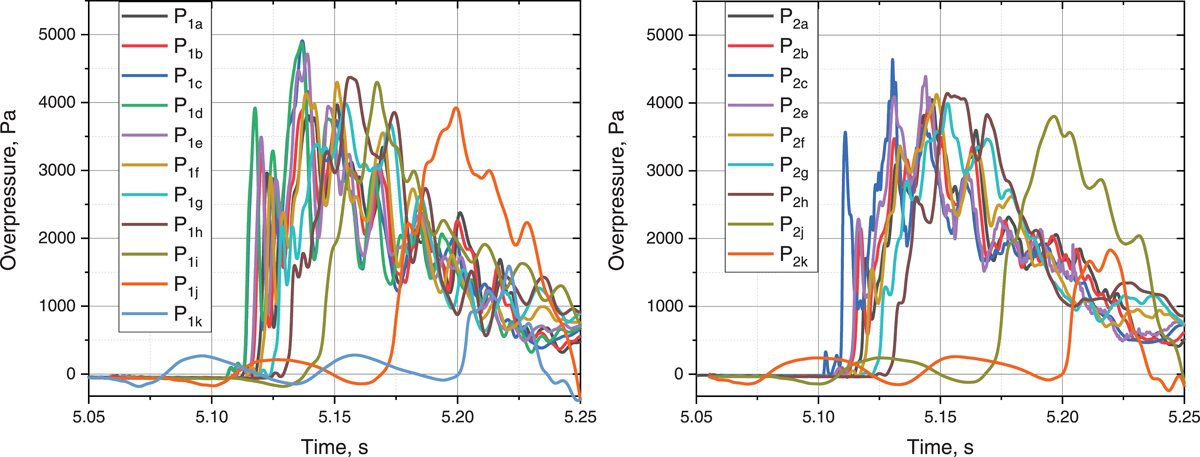
Figure 13
Overpressures in case of ignition time of 5.1 s with 2.4 m/s ventilation, without mist.
4.4.3 Mist influence on hydrogen deflagration
The mist is superimposed in the tunnel region with vehicle models at the igniting moment (5.2 s) for the three cases discussed in the last section, respectively, to mimic the firefighting action in a tunnel fire accident. The interaction between hydrogen deflagration and water mist is simulated. The results about overpressures are shown in Figures 14, 15, 16.
The maximum overpressures are summarized in Table 2, with the last column referring to the mist intervention cases. As shown in the figures and the table, the peak overpressures of combustion are 1413 Pa, 3058 Pa, and 3294 Pa for the cases of 0 m/s, 1.25 m/s, and 2.4 m/s ventilation, respectively. The overpressures are apparently lower than the corresponding values without mist, approximately by 32–42%. The suppression effect of water mist on hydrogen combustion is quite obvious, primarily due to the following two factors: the cooling effect of water on the hot gases of combustion, and the hydrodynamic effect of the heavier density of the two-phase flow (H2-air mixture plus liquid), which is about nine times heavier than normal air by considering the imposed mist density of 10 kg/m3.
The momentum suppression of the heavier two-phase fluid mixture is proved by the reduction in the propagation speeds of the pressure fronts in the three cases. According to the pressure records between the gauge P1d and P1k in Figures 14, 15, 16, the combustion pressure wave travels at a speed of about 356 m/s, 365 m/s, and 357 m/s, respectively, for the cases of 0 m/s, 1.25 m/s, and 2.4 m/s ventilation. All speeds are smaller, although slightly, than the corresponding values without mist analyzed in the last section.
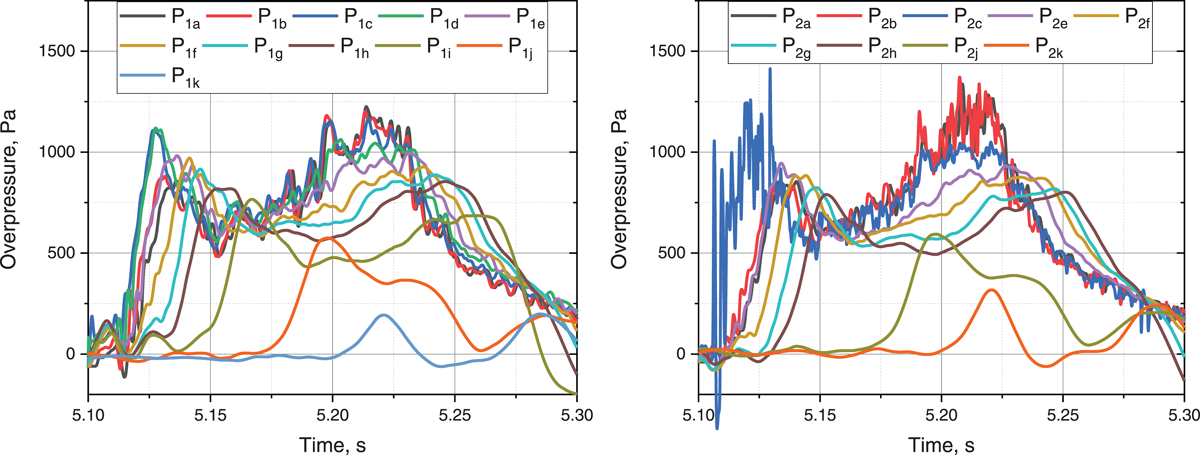
Figure 14
Overpressures in case of ignition time of 5.1 s without ventilation, with mist.
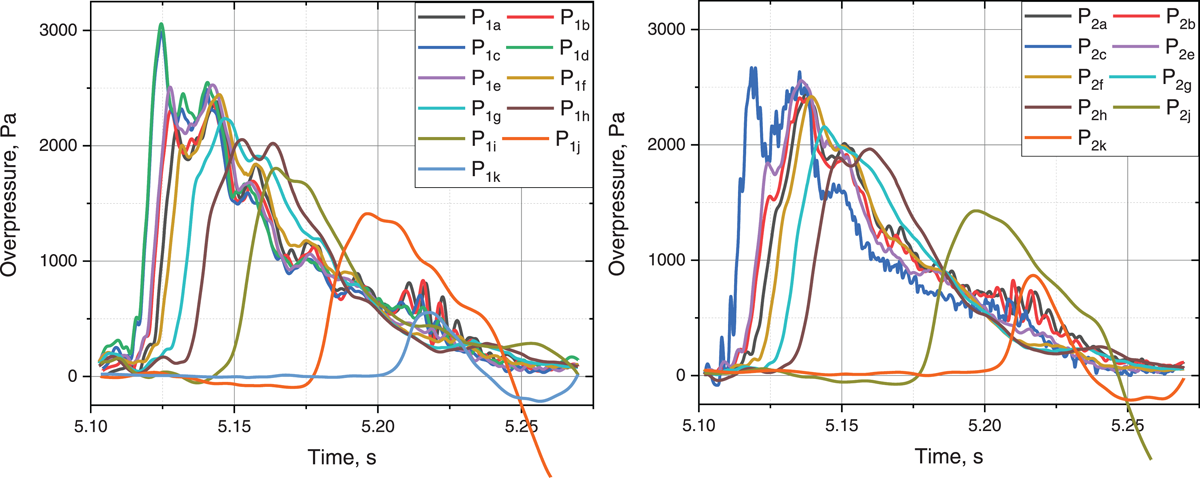
Figure 15
Overpressures in case of ignition time of 5.1 s with 1.25 m/s ventilation, with mist.
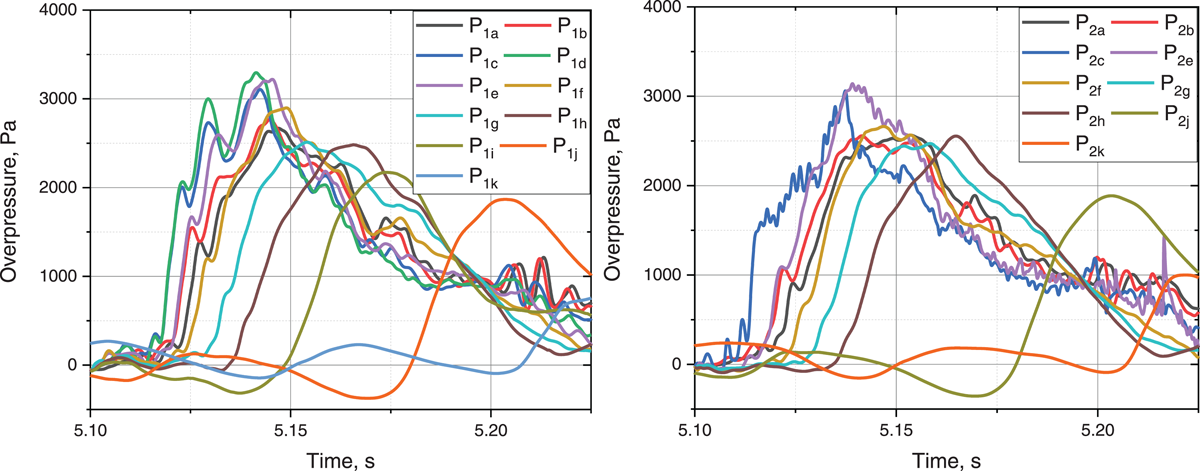
Figure 16
Overpressures in case of ignition time of 5.1 s with 2.4 m/s ventilation, with mist.
Due to the relatively small release rate of hydrogen, the overpressures listed in Table 2 do not pose a serious threat to humans. However, an overpressure of a few thousand Pa could bring a temporary ear threshold shift.
5 Conclusions and Outlooks
By applying a simplified water mist model to a computer code for turbulent combustion, the suppression effect of mist on hydrogen deflagration is studied for an experimental tunnel facility with different ventilation efficiencies and variant ignition times. The results of numerical simulations manifest that the overpressure of hydrogen combustion can be reduced by about 30–40% if water mist is injected in a hydrogen tunnel fire. The conclusion is logical from a thermodynamic perspective, although data are not yet available for verification. The suppression effect is mainly contributed by the cooling effect of liquid water and by the hydrodynamic effect of the heavier density of the two-phase atmospheric flow.
Sensitivity studies focusing on different injected water mist densities and droplet sizes are planned for next phase of this work. Hopefully, the relevant experiments would be performed to supply data to verify the numerical models.
Competing Interests
A Lagrangian particle model is applied in the COM3D computer code to simulate water mist droplets. The interaction between water mist and hydrogen combustion in a semi-confined tunnel facility is simulated numerically with or without tunnel ventilation. The maximum overpressure of hydrogen deflagration is mitigated by the injected water mist while hydrogen release accidentally occurs with ignition in traffic tunnels.