
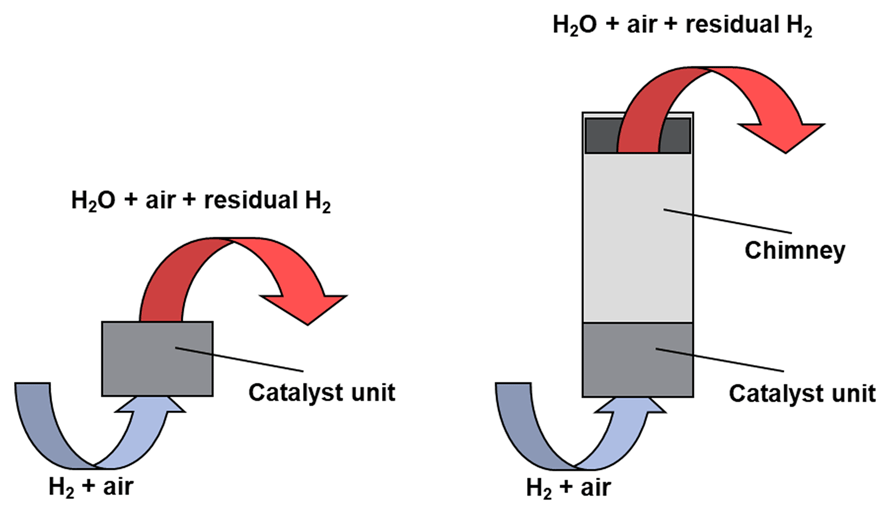
Figure 1
Functional principle of a catalytic recombiner with (right) and without (left) chimney.
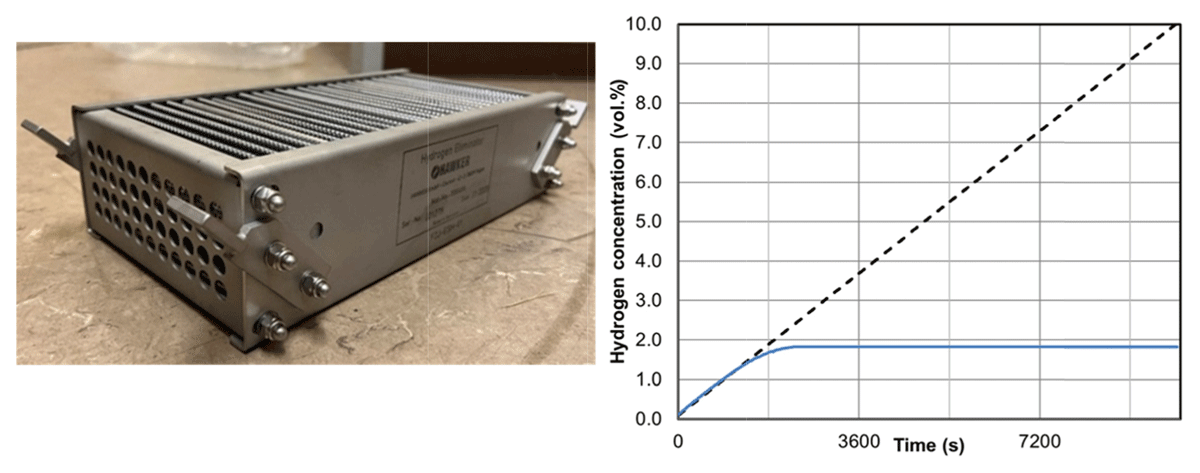
Figure 2
The Enersys-Hawker Hydrogen Eliminator (left) and principle of recombiner operation (right).
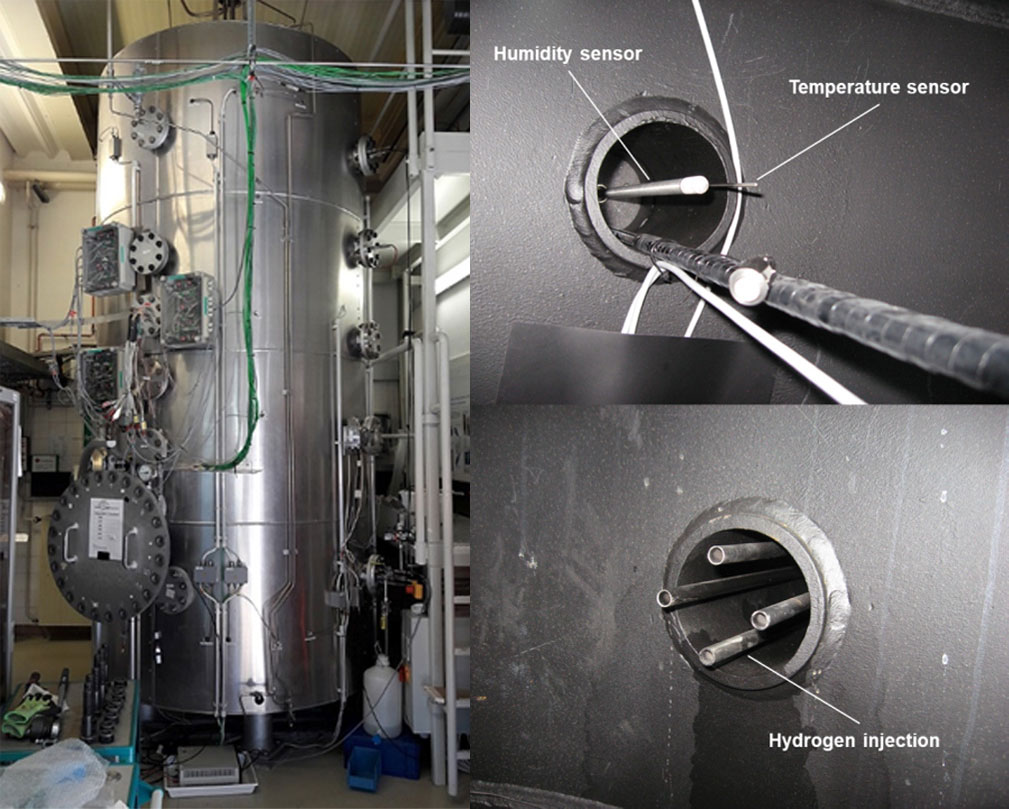
Figure 3
REKO-4 facility (left), gas injection lines and humidity sensor (right).
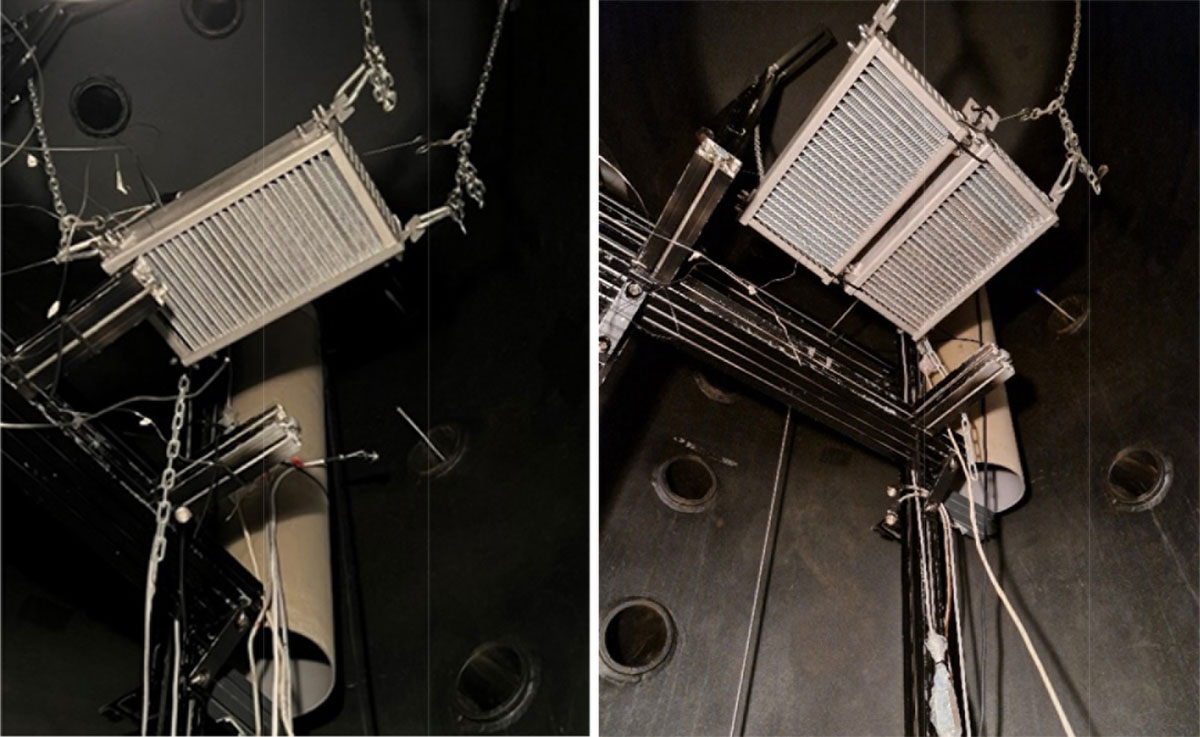
Figure 4
Recombiner installation next to the mixing fan: single recombiner (left), two recombiners (right).
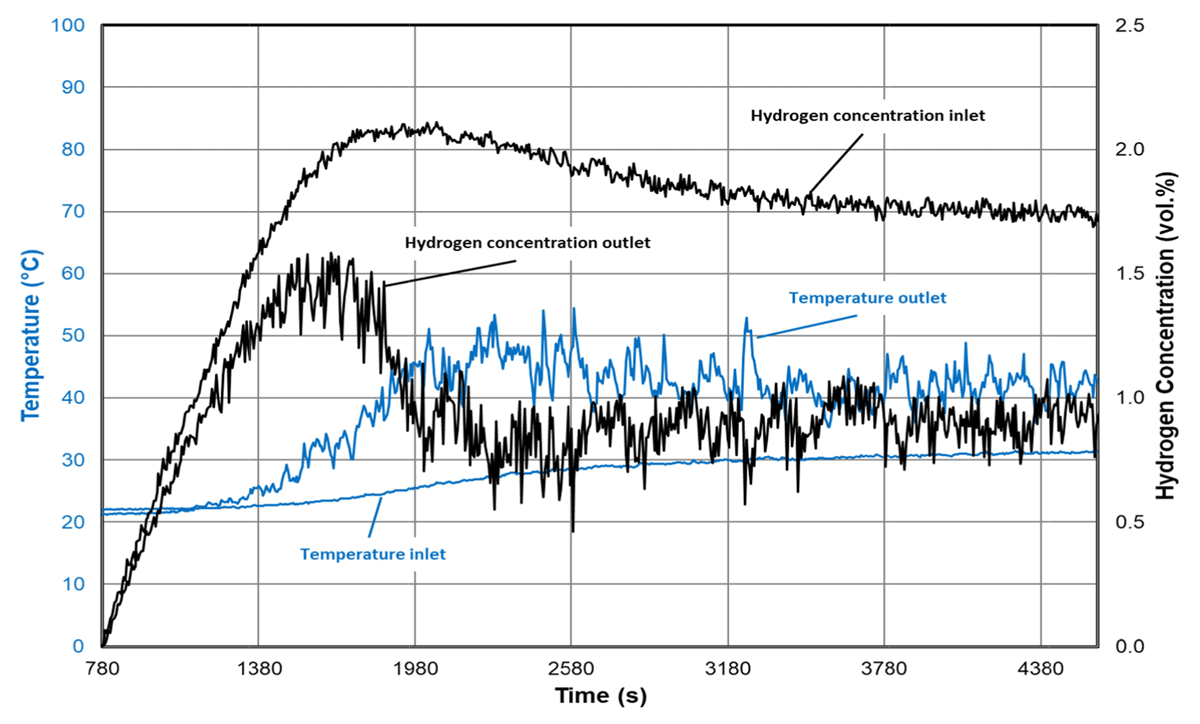
Figure 5
Measurements of gas temperature and hydrogen concentration during test 03 (hydrogen injection rate: 0.5 n-m3/h).
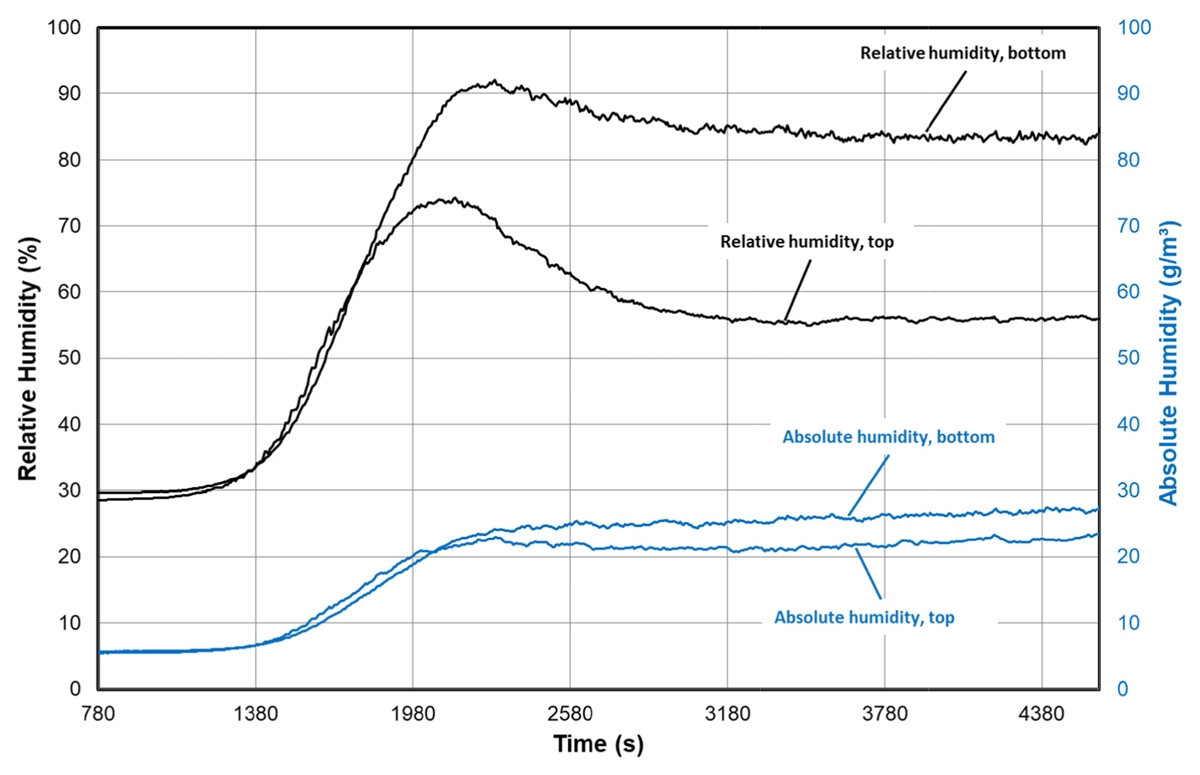
Figure 6
Measurements of humidity (relative and absolute) during test 03 (hydrogen injection rate: 0.5 n-m3/h).
Table 1
Test matrix.
| TEST NO. | NO. OF RECOMBINERS | BOTTOM VALVE | HYDROGEN INJECTION RATE (N-M3/H) | COMMENTS |
|---|---|---|---|---|
| 01 | 1 | open | 0.25 | |
| 0.20 | ||||
| 0.15 | ||||
| 0.10 | ||||
| 02 | 1 | open | 0.25 | |
| 0.20 | ||||
| 0.15 | ||||
| 0.10 | ||||
| 03 | 2 | open | 0.50 | |
| 04 | 2 | open | 0.10 | |
| 05 | 2 | closed | 0.50 | |
| 0.25 | ||||
| 0.10 | ||||
| 0.50 | Terminated due to lack of oxygen | |||
| 06 | 2 | closed | 0.50 | |
| 07 | 2 | closed | 0.40 | |
| 0.20 |
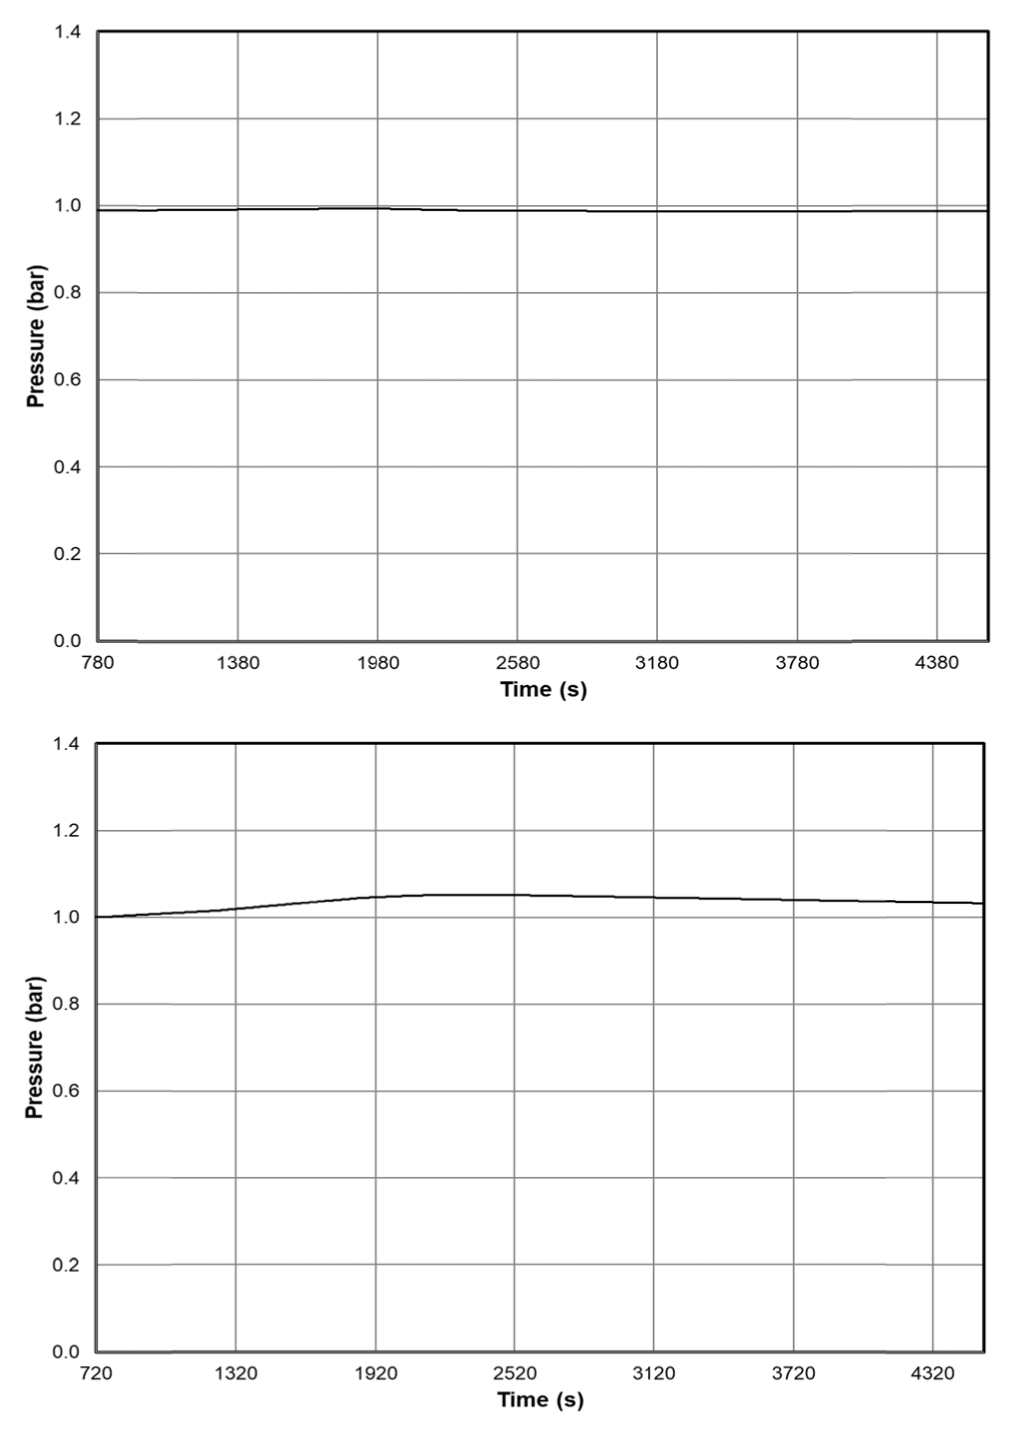
Figure 7
Pressure evolution during test 03 (left, bottom valve open) and test 06 (right, bottom valve closed).
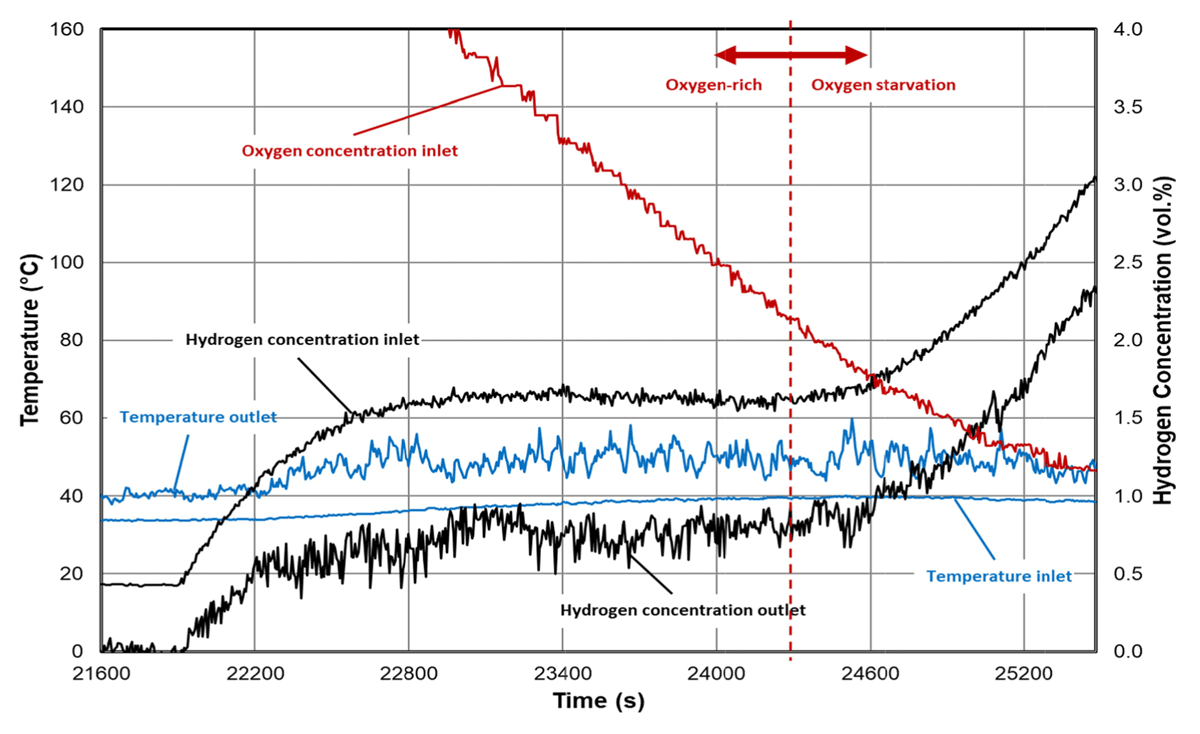
Figure 8
Oxygen starvation observed in test 05.
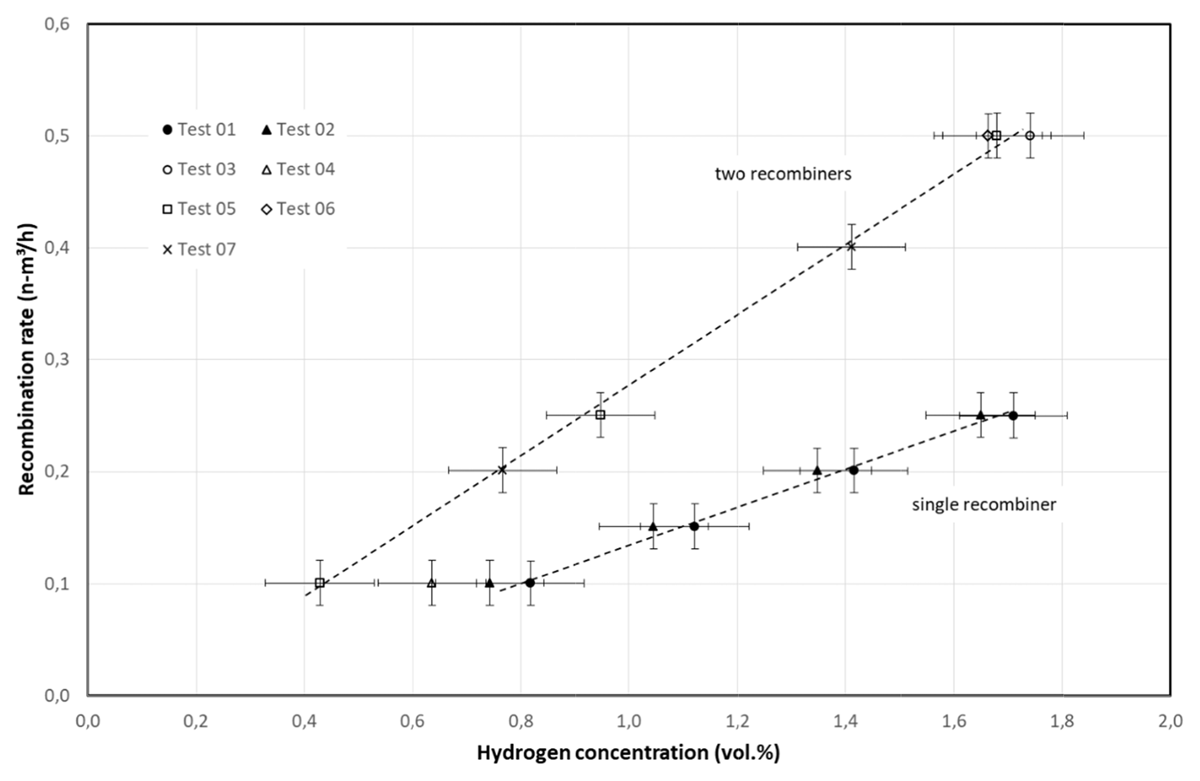
Figure 9
Steady-state recombination rates for different hydrogen concentrations for tests with one and two recombiners.
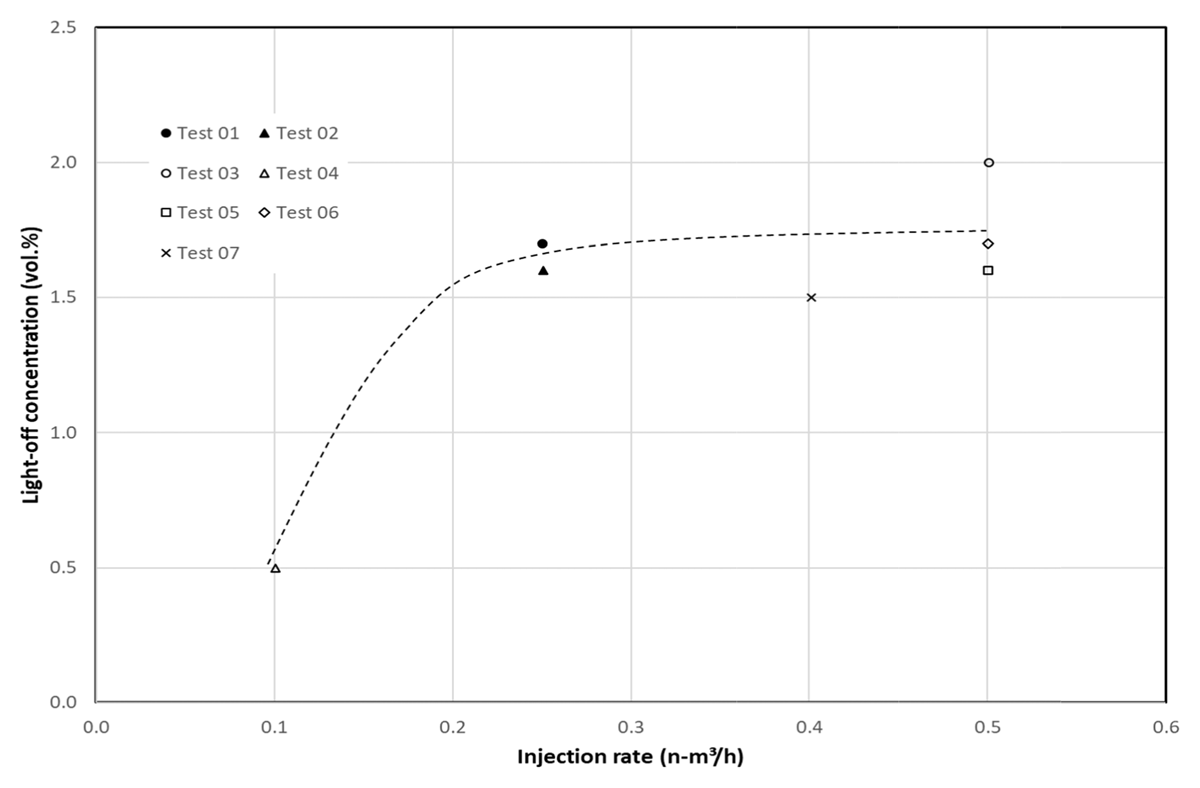
Figure 10
Observed light-off concentrations for different hydrogen injection rates.
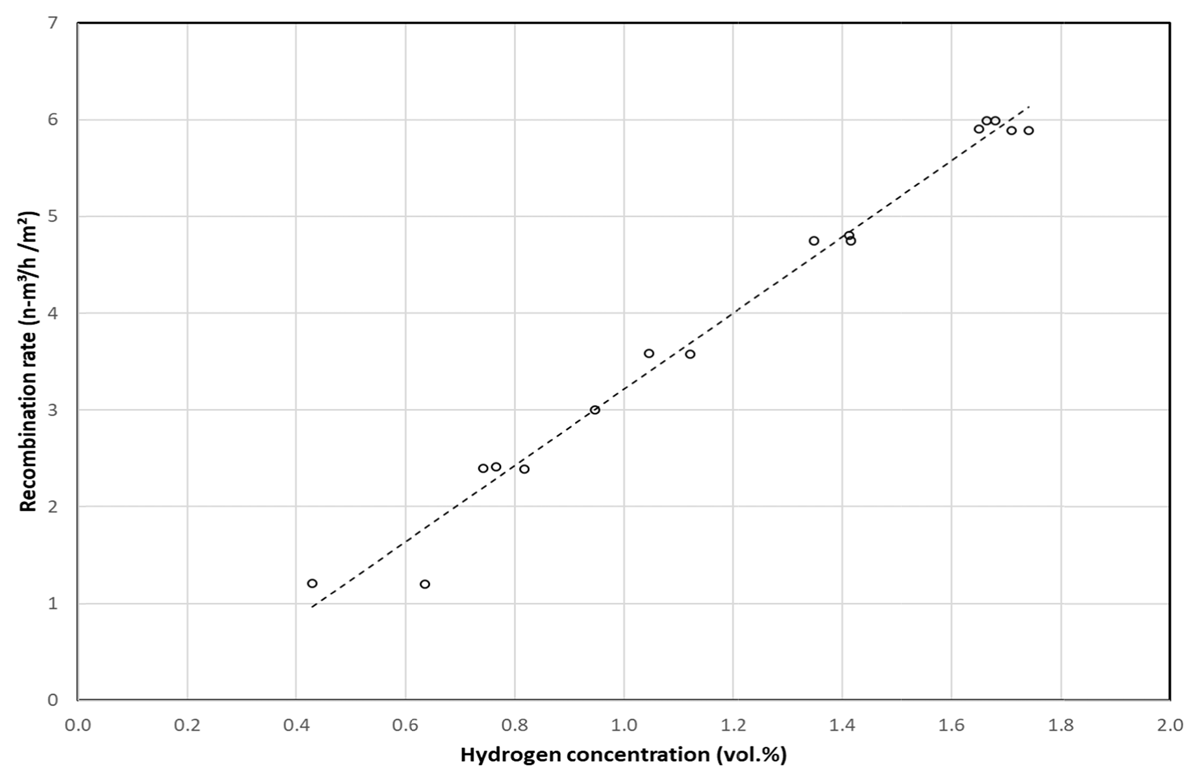
Figure 11
Recombination rate per inlet cross section as a function of the hydrogen concentration for both recombiner set-ups.