
1. Introduction
With the emerging global trend of significantly reducing the use of fossil energy sources for reasons of climate protection, the demand for so-called renewable energy sources is increasing. In most cases, their use is associated with fluctuating generation characteristics, which can only be adapted to the electricity demand with suitable short- and long-term energy storage systems. Here, hydrogen can play a key role. On the one hand, hydrogen can be produced in an environmentally friendly way by electrolysis utilizing electrical power from renewable energy sources (‘green’ hydrogen). On the other hand, hydrogen is versatile in application and can be used for energy storage, energy transportation, and both electricity generation (e.g. in fuel cells) and heat generation (in combustion processes).
However, when considering hydrogen as an energy carrier, its low specific energy density makes it economically disadvantageous. Technical solutions therefore involve storage tanks with high pressures of up to 1000 bar. In addition, the liquefaction of hydrogen is particularly favorable for large-scale transportation over long distances. Although the energy required to cool gaseous hydrogen to 20 K is immense, it is considered justifiable due to the considerable gain in energy density.
Hydrogen safety is one of the key aspects to enable the broad introduction of hydrogen technologies. Due to its extremely low density, hydrogen has a high likelihood of leaking, especially due to the high pressures used in many applications. Once it is released into air, the formation of flammable gas mixtures is easily achieved as a result of the very broad flammability range. The extremely low ignition energy required to ignite hydrogen-air mixtures makes combustion very likely, once the lower flammability limit has been reached. Finally, the fast flame speed in hydrogen combustion processes increases the likelihood of a deflagration-to-detonation transition ultimately resulting in a detonation. These risks are especially relevant for closed or confined rooms, which require sufficient ventilation rates to avoid the formation of flammable gas mixtures in the case of leakages.
Another option for dealing with hydrogen leakages in enclosed spaces is the installation of catalytic recombiners. Although they are a key element of the hydrogen mitigation strategy of nuclear power plants worldwide, they are still relatively unknown in the field of hydrogen technologies. Given the numerous safety challenges in emerging hydrogen applications, the use of catalytic recombiners could become more prominent in the future, either to support existing safety measures or to reduce flammable gases when venting is insufficient or even impossible.
In the following sections, the fundamental properties of catalytic recombiners are explained and a method for determining the recombination capacity is presented.
2. Passive Catalytic Recombiners
Catalytic recombiners are devices to reduce the accumulation of hydrogen in air. They are considered to be passive if they are self-starting and self-feeding without operator intervention or connection to an external power supply (Bachellerie et al., 2003).
Basic features of a passive catalytic recombiner are illustrated in Figure 1. The core of the device is a catalytic unit that is installed inside a rectangular box with openings at the top and at the bottom. Upon contact with the catalyst surface, hydrogen (H2) and oxygen (O2) react to form water (H2O) in an exothermic reaction according to
with a reaction heat released of 240 kJ/mol (Hanson and Boudart, 1978). As the reaction heat is transferred from the catalyst surface to the gas passing by, the gas density decreases and a buoyant flow establishes. The buoyant flow supports the release of the reacted gas at the top opening and feeds fresh gas into the inlet. Specifically in nuclear applications, the flow through the recombiner is usually significantly enhanced by applying a chimney on top of the catalyst (Bachellerie et al., 2003).
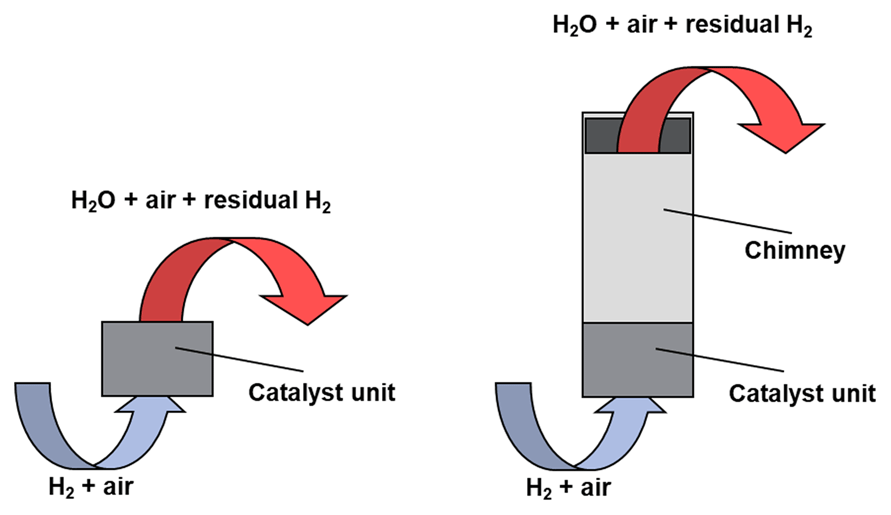
Figure 1
Functional principle of a catalytic recombiner with (right) and without (left) chimney.
The catalytic unit fulfills two functions: Firstly, it provides the largest possible reactive surface for the reaction of hydrogen with oxygen. Secondly, the pressure loss is kept as low as possible so as not to unnecessarily hinder the formation of the vertical buoyant flow. The catalyst usually consists of a combination of the carrier and the catalytically active material, typically platinum or palladium. The precious metals enable the catalytic reaction of hydrogen with oxygen to proceed even at room temperature by lowering the activation energy required for the reaction. In this way, the reaction can also take place outside the flammability limits of homogeneous hydrogen combustion (4–75 vol.%).
A numerical simulation of the operating behavior of a catalytic recombiner is used to support the implementation of recombiners in the safety concept of hydrogen applications. In this way, for example, the optimum positioning of recombiners can be determined and their effectiveness demonstrated. For example, Kelm et al. (2021) have used Computational Fluid Dynamics (CFD) simulations to demonstrate the applicability of different arrangements of recombiners in the engine room of a liquid hydrogen carrier in combination with natural ventilation.
There are various modeling approaches for simulating recombiner operation, ranging from engineering correlations to detailed physicochemical and fluid mechanical models. Engineering correlations are usually based on an equation to calculate the recombination rate (i.e. the hydrogen conversion rate) as a function of hydrogen concentration and the ambient pressure (Reinecke et al., 2010). The most widely used correlation model is provided by the manufacturer of the Framatome/Areva recombiner, as it can readily be implemented in scenario codes based on lumped-parameter or CFD approaches. Mechanistic models, such as REKO-DIREKT (Reinecke et al., 2016) and a model proposed by Rozen (2015), involve the numerical description of relevant heat and mass transfer processes to obtain more detailed results with regard to the conditions inside the recombiner and specifically at the outlet. PARUPM, a numerical model developed at the Technical University of Madrid, adds a surface chemistry model to capture effects related to the processes during heterogeneous catalysis (Domínguez-Bugarín et al., 2022). Several authors have proposed CFD-based recombiner models to better capture the flow phenomena inside and outside the recombiner box, e.g. Klauck et al. (2014), Park and Khor (2016), Shukla et al. (2021), and Kim et al. (2024). Recently, a 2D transient numerical recombiner model based on the numerical tool COMSOL Multiphysics was developed by Zanoni et al. (2024). The most complex recombiner model to date is the SPARK code developed by IRSN (Meynet and Bentaib, 2010); it includes fluid mechanics and both chemical surface and gas phase kinetics.
Some of the complex recombiner models are universally applicable but have to cope with long computing times. Correlation models are typically developed for specific types of recombiners, thus their applicability is limited to the respective design. On the other hand, correlation models are characterized by low numerical effort and ease of use, which is particularly advantageous for preliminary design calculations. In the present study, the experiments performed and described are used to derive a correlation model for the EnerSys-Hawker Hydrogen Eliminator (Figure 2, left). This is a commercial recombiner for which no computational model has been previously available.
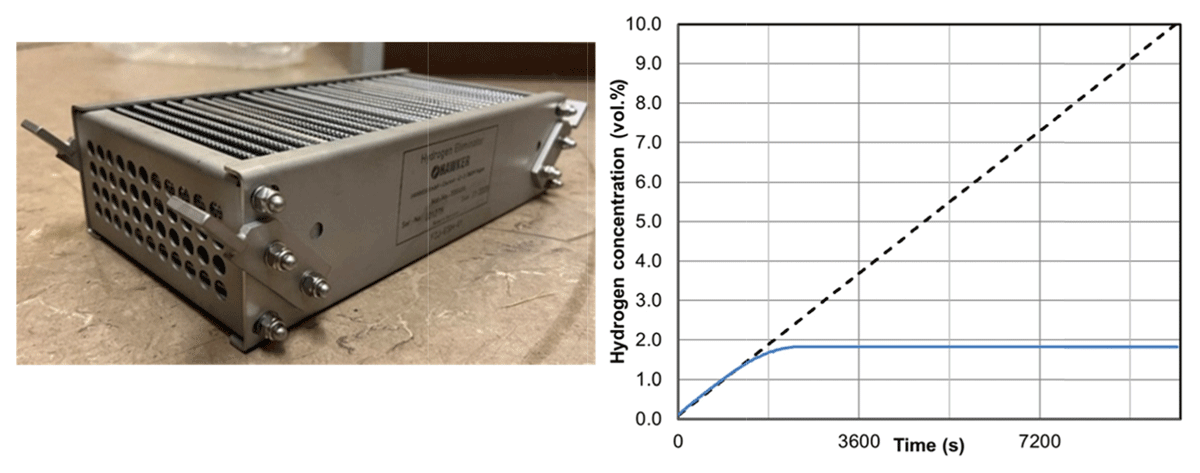
Figure 2
The Enersys-Hawker Hydrogen Eliminator (left) and principle of recombiner operation (right).
The EnerSys-Hawker Hydrogen Eliminator is typically installed inside battery rooms in maritime applications. It has a length of about 32 cm, a width of about 17 cm, and a height of about 8 cm. This recombiner does not require an additional chimney, resulting in a very compact design with a small space requirement. The gaps between 25 sheet-like catalytic elements promote buoyancy-driven flow. Further details on the catalyst material and design is proprietary information owned by the manufacturer. The manufacturer states in the technical documentation that the inlet concentration must not surpass 2 vol.% hydrogen.
The principle idea of recombiner operation is illustrated in Figure 2 (right). In case of the release of hydrogen in a continuous unmitigated flow into an enclosure with no ventilation or recombiner operation, hydrogen concentration increases continuously (black dotted line). However, in a mitigated release the recombiner operation sets in and the concentration is maintained at a (ideally) constant value (blue solid line), which depends on the recombiner conversion capacity, the room size, and the leak rate.
3. Experimental Setup
The experiments of this study were conducted in the REKO-4 facility (Figure 3, left), located in the Hydrogen Laboratory on the campus of Forschungszentrum Jülich GmbH, Germany. Since its establishment in 2009, the facility has been used for studying specific aspects of the operational behavior of scaled-down generic catalytic recombiners in the field of nuclear safety research. Since 2012, the facility has also been used for commercial catalyst and recombiner qualification.
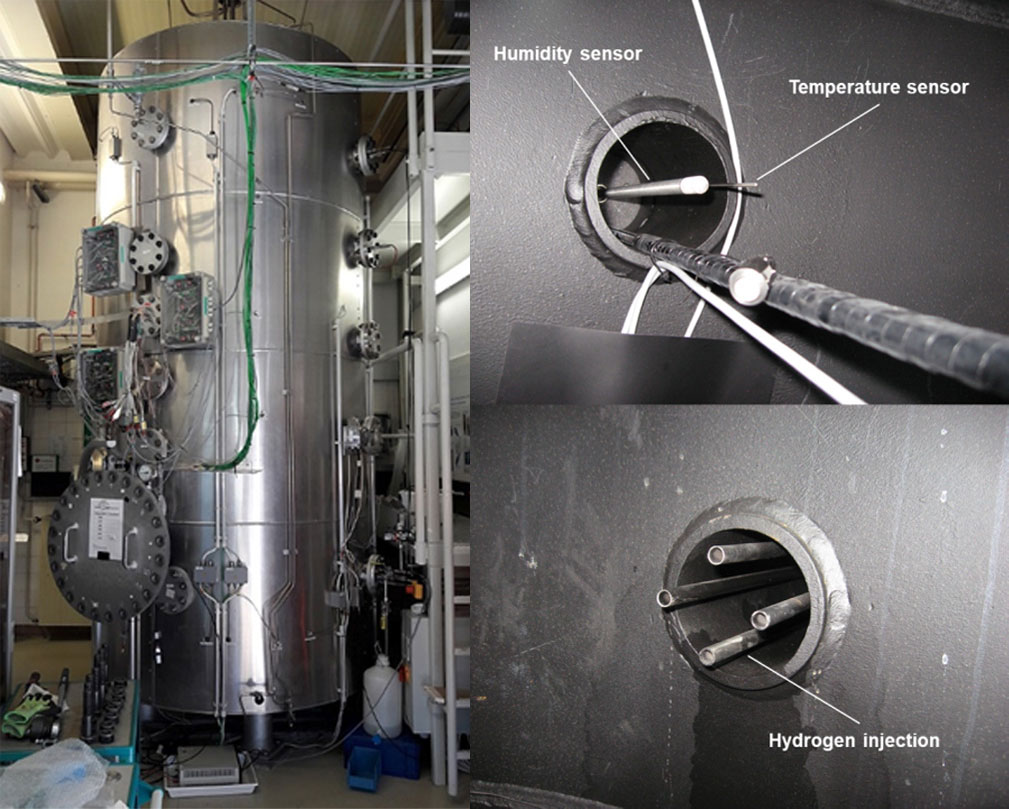
Figure 3
REKO-4 facility (left), gas injection lines and humidity sensor (right).
The steel pressure vessel, REKO-4, has an internal volume of 5.45 m3, an internal diameter of 1.4 m, an internal height of 3.7 m, and a design pressure of 25 bar @ 280°C. The vessel is equipped with a manhole for access and a grid platform at the base of the cylindrical section of the vessel. All vertical measurements refer to the elevation from the grid platform.
Hydrogen is injected through a horizontal pipe at a level of 20 cm (Figure 3, right). A mass flow controller enables a controlled definition of the injection rate in terms of n-m3/h with an uncertainty of +/– 1% of the control range. To obtain well-mixed conditions, which are required for calculating the recombination rate, a fan above the injection point can be operated.
3.1 Instrumentation
The instrumentation serves to monitor and control the boundary conditions during recombiner operation inside the vessel. It includes pressure sensors, thermocouples, two humidity sensors at elevations of 24 cm and 280 cm, and two oxygen sensors at elevations of 104 cm and 220 cm. Particularly during longer test sequences of several hours, it must be ensured that sufficient oxygen is available for optimum recombination performance. For that reason, air can be replenished when necessary.
The hydrogen volumetric fraction is measured by means of XEN-3880 thermal conductivity sensors in several positions inside the test vessel. As the thermal conductivity of the background gas is continuously changing during the recombination process due to the increase of humidity, an analytical correction of the signal needs to be performed. For this purpose, a correction curve determined in a separate test series was used. The offset Δy is calculated as a function of the absolute humidity φabs according to
with a = 5.64 10–5 and b = 4.91 10–3.
Due to the necessary humidity correction, the uncertainty of the sensor measurements is considered to be +/– 0.1 vol.%.
3.2 Recombiner mounting
The recombiners are suspended in the test vessel. For this purpose, four steel chains with carabiners at the ends are arranged in a square and hung from the top of REKO-4. In the four corners of the recombiner housing the carabiners are attached, suspending the recombiner. After it is hanging inside the vessel, the lower edge of the recombiner is at a height of approximately 140 cm. For the present study, two setups were used: First, tests were carried out with a single recombiner (Figure 4, left). In the second part of the test series, two recombiners were suspended next to each other (Figure 4, right).
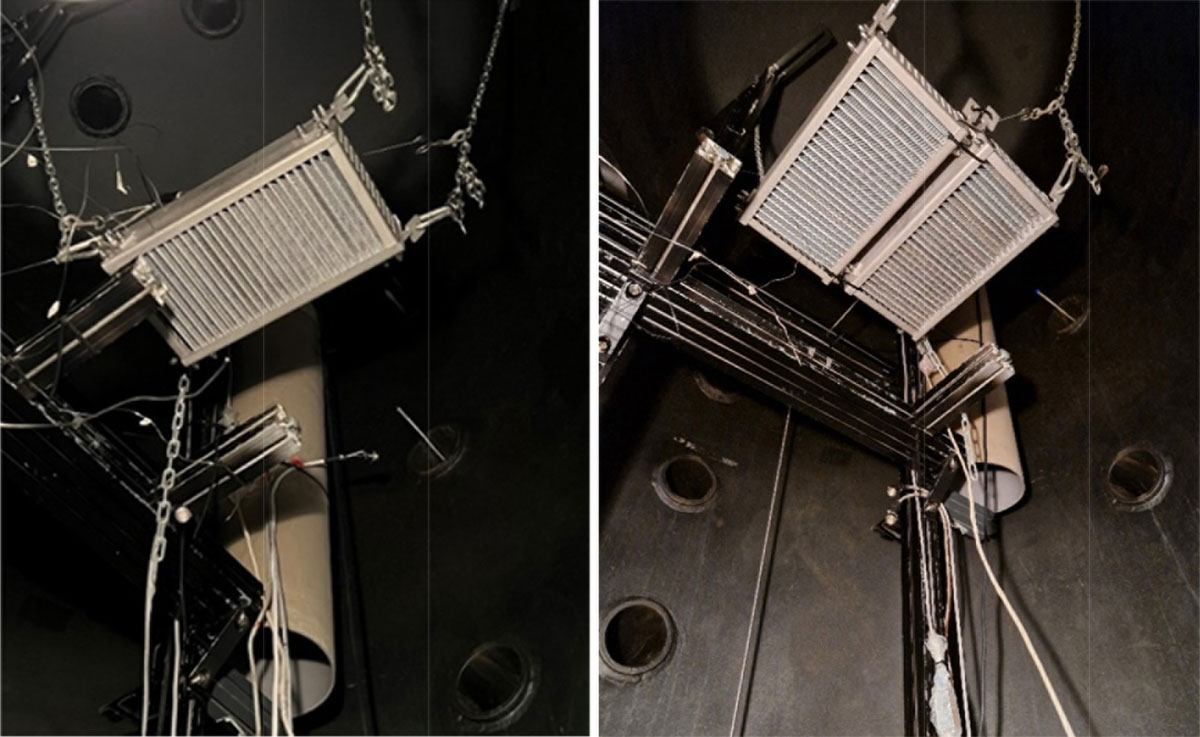
Figure 4
Recombiner installation next to the mixing fan: single recombiner (left), two recombiners (right).
A pair of sensors, a thermocouple and a hydrogen sensor are placed at the inlet and at the outlet of the recombiner. The thermocouples are Ni-CrNi (type K) with 1 mm in diameter. The hydrogen sensors are XEN-3880 thermal conductivity sensors. The pair of sensors located at the recombiner inlet is positioned adjacent to the direct inflow to reduce the influence of heat radiation from the catalytic surfaces. The hydrogen sensor above the recombiner outlet is significantly affected by the hot gas and the high humidity and is therefore only evaluated qualitatively.
3.3 Test procedure
Figure 5 illustrates the phenomena occurring during the test procedure. The measured hydrogen concentrations at the inlet and outlet are plotted in black (right vertical axis) while the measured gas temperatures at the inlet and outlet are shown in blue (left vertical axis).
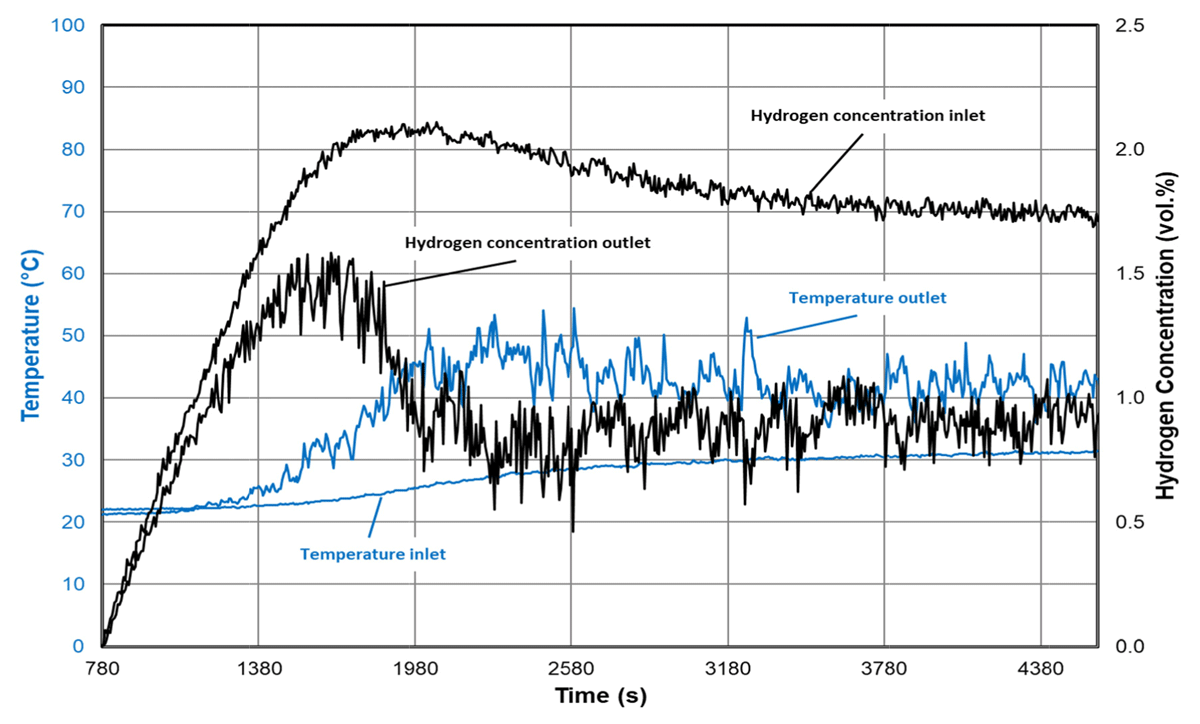
Figure 5
Measurements of gas temperature and hydrogen concentration during test 03 (hydrogen injection rate: 0.5 n-m3/h).
At 780 s the hydrogen injection starts with a rate of 0.5 n-m3/h. The hydrogen concentration at both inlet and outlet start to increase proportionally with time. At a hydrogen concentration of approximately 0.5 vol.%, both signals start to diverge. While the concentration at the recombiner inlet is still increasing at more or less the same rate, the outlet concentration increases more and more until it reaches a maximum at approximately 1600 s and then decreases until it reaches a stable value (despite strong fluctuations) between 0.75 and 1.0 vol.%. It is important to note that the absolute value indicated by the sensor at the recombiner outlet is strongly influenced by several factors, such as
– the exact distance from the catalyst;
– the horizontal position, i.e. above the catalyst or above the flow gap between;
– the hot outlet gas temperature; and
– the high humidity of the gas leaving the recombiner.
As a consequence, this signal is only considered qualitatively, which provides a good indication of recombiner operation. A second indicator of recombiner operation is the measured gas temperature at the outlet. Again, this value depends on the distance from the catalyst. The deviation from the inlet gas temperature starts to develop after 1000 s, which shows the catalytic activity of the exothermal reaction. In the steady state, the value fluctuates between 38 and 48°C.
The hydrogen concentration measured at the recombiner inlet increases until the recombiner operation equals/balances the hydrogen injection. The maximum value of 2.1 vol.% is reached at approximately 2000 s. At equilibrium, the hydrogen concentration reaches a final value of 1.75 vol.%.
The temperature measured at the recombiner inlet shows the general increase of the gas temperature inside the test vessel during the recombination process from 22°C to 31°C at the end of the hydrogen injection. Overall, the gas temperature in the upper region of the vessel is slightly higher, as can be seen from the humidity measurements (Figure 6). While the absolute humidity measured at the bottom and at the top of the vessel remain at very similar values between 23 and 27 g/m3, the relative humidity at the top is significantly lower (~56%) than at the bottom (~83%) due to a gas temperature at the top of 35°C.
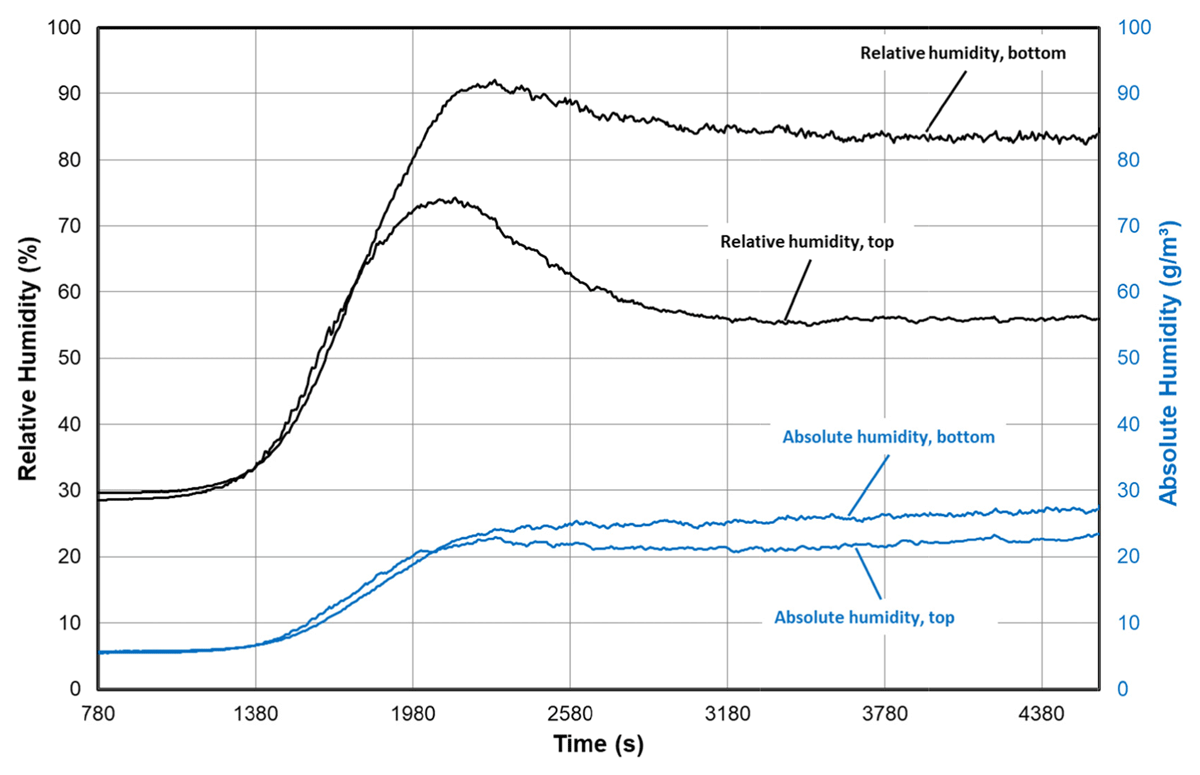
Figure 6
Measurements of humidity (relative and absolute) during test 03 (hydrogen injection rate: 0.5 n-m3/h).
After reaching a steady-state, measurement data were recorded and averaged over five minutes.
Table 1 gives an overview of the tests performed and indicates the steady-state values collected. Tests 01 to 04 were performed with the bottom valve of the vessel open to strictly maintain the vessel pressure at a constant value. Figure 7 shows the difference in the pressure evolution for test 03 (open bottom valve) and test 06 (closed bottom valve).
Table 1
Test matrix.
| TEST NO. | NO. OF RECOMBINERS | BOTTOM VALVE | HYDROGEN INJECTION RATE (N-M3/H) | COMMENTS |
|---|---|---|---|---|
| 01 | 1 | open | 0.25 | |
| 0.20 | ||||
| 0.15 | ||||
| 0.10 | ||||
| 02 | 1 | open | 0.25 | |
| 0.20 | ||||
| 0.15 | ||||
| 0.10 | ||||
| 03 | 2 | open | 0.50 | |
| 04 | 2 | open | 0.10 | |
| 05 | 2 | closed | 0.50 | |
| 0.25 | ||||
| 0.10 | ||||
| 0.50 | Terminated due to lack of oxygen | |||
| 06 | 2 | closed | 0.50 | |
| 07 | 2 | closed | 0.40 | |
| 0.20 |
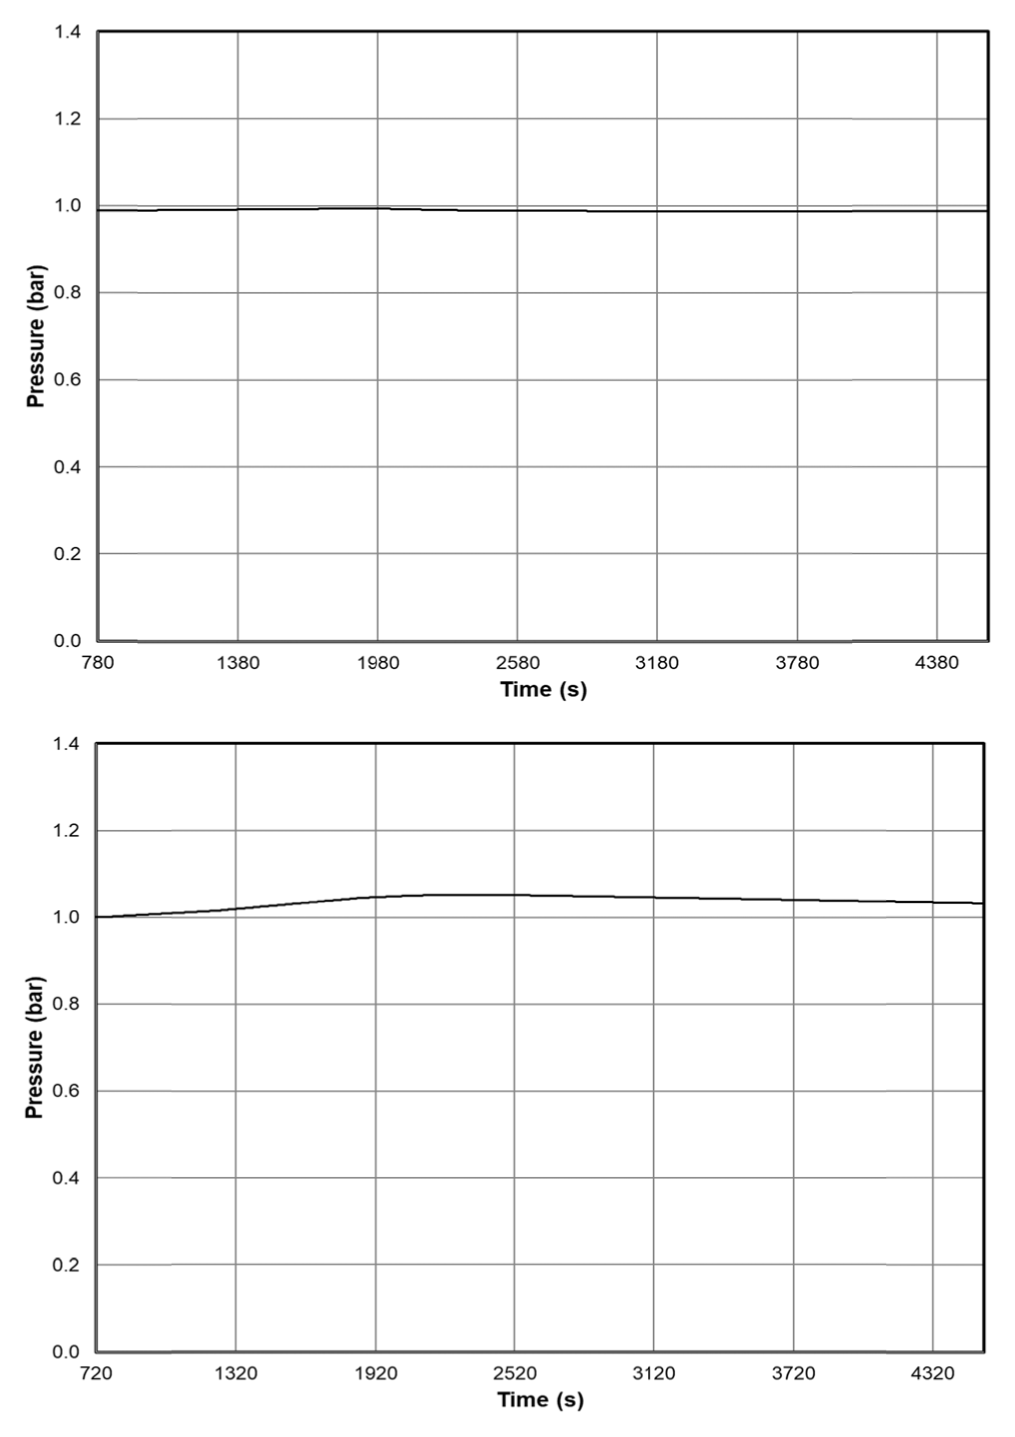
Figure 7
Pressure evolution during test 03 (left, bottom valve open) and test 06 (right, bottom valve closed).
For the single recombiner, injection rates between 0.1 n-m3/h and 0.25 n-m3/h with an increment of 0.05 n-m3/h were selected. The maximum injection rate was doubled for the tests with two recombiners, and further injection rates were selected accordingly to complete the test matrix.
During test 05, a state of oxygen starvation was reached (Figure 8). After changing the hydrogen injection rate from 0.1 n-m3/h to 0.5 n-m3/h (21,900 s), the measured values had almost reached equilibrium at approximately 24,300 s. However, it occurred that the oxygen present in the vessel’s atmosphere had already been largely consumed (blue line). At approximately 24,300 s, the effect of oxygen starvation leads to a continuous decrease of the recombination rate, which is shown by the significant increase in hydrogen concentration inside the vessel.
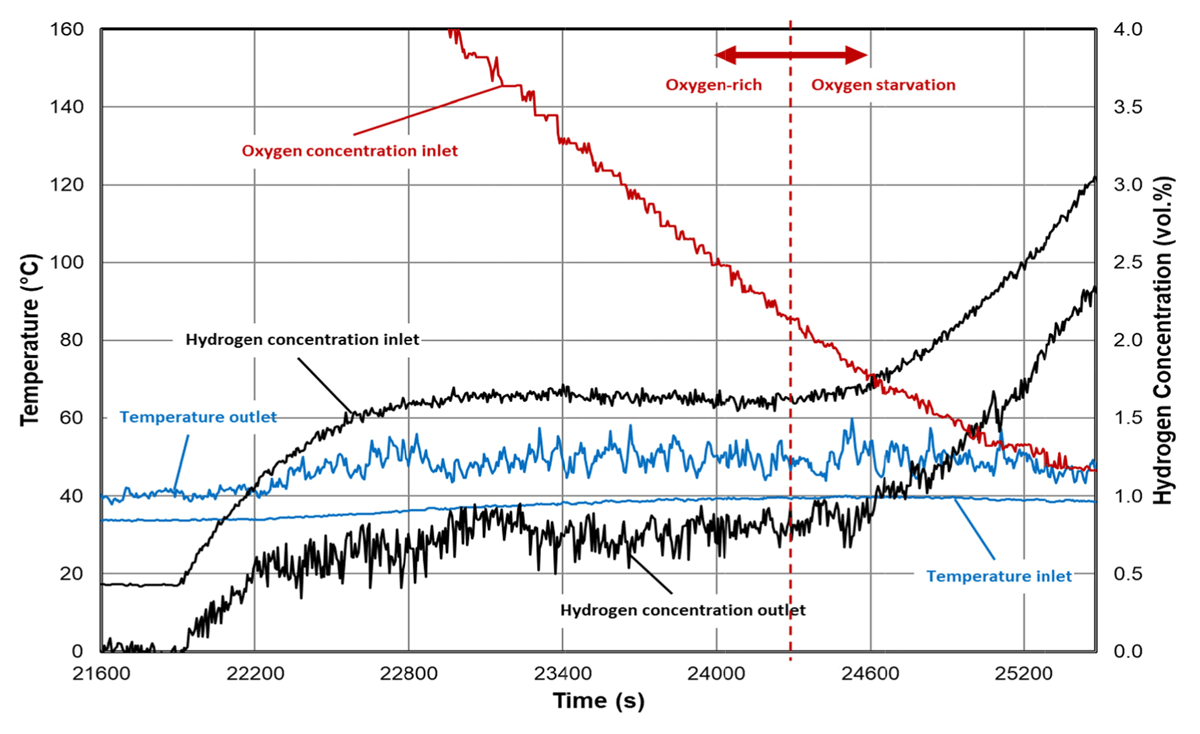
Figure 8
Oxygen starvation observed in test 05.
For the determination of the steady-state recombination rate, a molar hydrogen balance is introduced. Accordingly, the temporal change of the molar hydrogen supply inside the vessel is
where is the molar injection rate given by the mass flow controller and is the recombination rate and unknown. In steady-state conditions, the hydrogen concentration inside the vessel remains constant and the recombination rate can be determined directly from the feed rate:
For the experiments with the open bottom valve, the escaping hydrogen needs to be considered. Due to the well-mixed conditions, the leaking hydrogen rate can be expressed as
while the total rate of leaking gas is
With eq. (5) and eq. (6) in the molar hydrogen balance, the reaction rate for these experiments is
However, it should be noted that under the present conditions the deviation between the exact balance for the cases with the open bottom valve (eq. 7) and the balance for the cases with the closed vessel (eq. 4) is smaller than 1%.
The advantage of this method of determining the recombination rate is clearly that the uncertainty of the results can be directly taken from the mass flow controller and the sensor measurements, respectively. By this, complex error propagation can be avoided.
4. Results and Discussion
Figure 9 shows the recombination rates determined for the single recombiner (closed symbols) and for the two recombiners (open symbols) as function of the steady-state hydrogen concentrations. As one would expect, the rates are twice as high for the tests with the two recombiners.
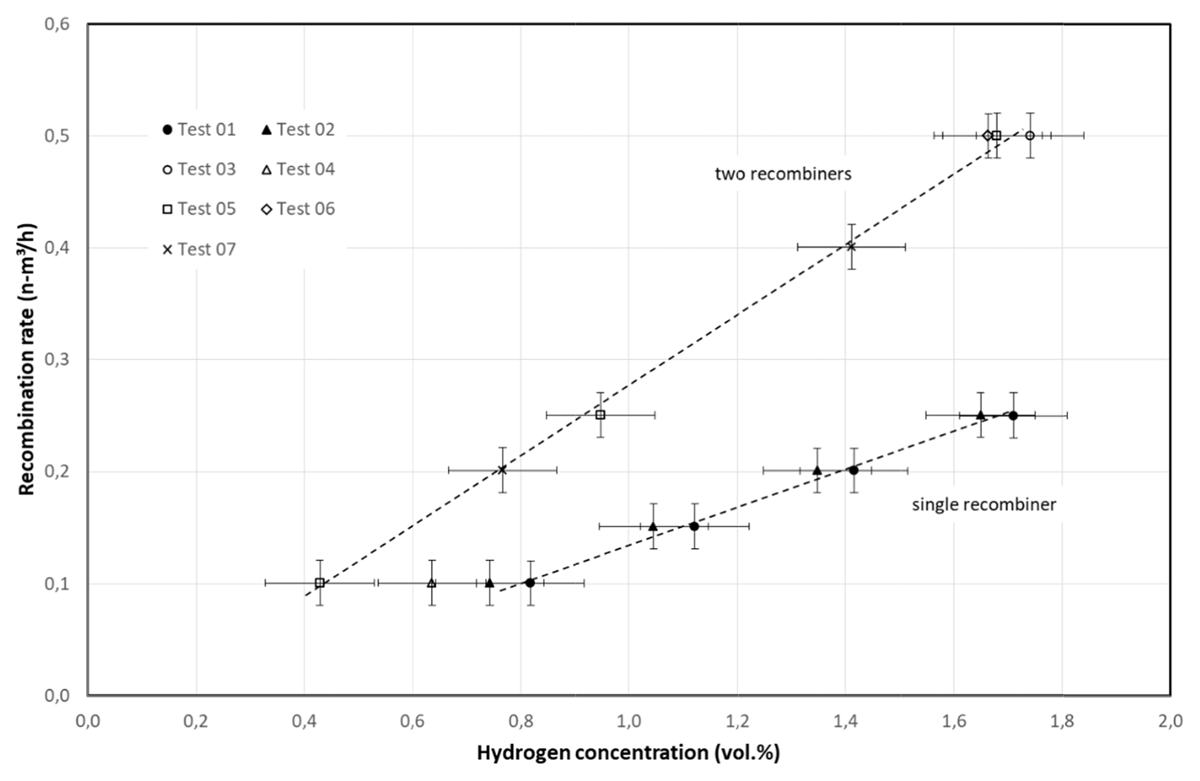
Figure 9
Steady-state recombination rates for different hydrogen concentrations for tests with one and two recombiners.
Ultimately, the observed deviations are within a reasonable range of the expected uncertainties. Only in test 04 the thermal equilibrium was visibly not reached, although the injection lasted for more than 5 h. This is the test with the lowest initial injection rate (see Table 1). In other tests, where the low rate of 0.1 n-m3/h was set later in operation, the recombiner was clearly already thermally developed and the equilibrium was reached at significantly lower concentration.
Start-up of the catalytic reaction was in all cases observed around 0.5 vol.%. However, catalytic light-off occurred in almost all tests between 1.5 vol.% and 2.0 vol.% (Figure 10). It may be expected that the injection rate influences the light-off concentration as concentration increases faster and leaves less time for the catalyst to light-off. In the present study, only the value for the slowest injection rate of 0.1 n-m3/h was significantly lower than the average value of 1.7 vol.%.
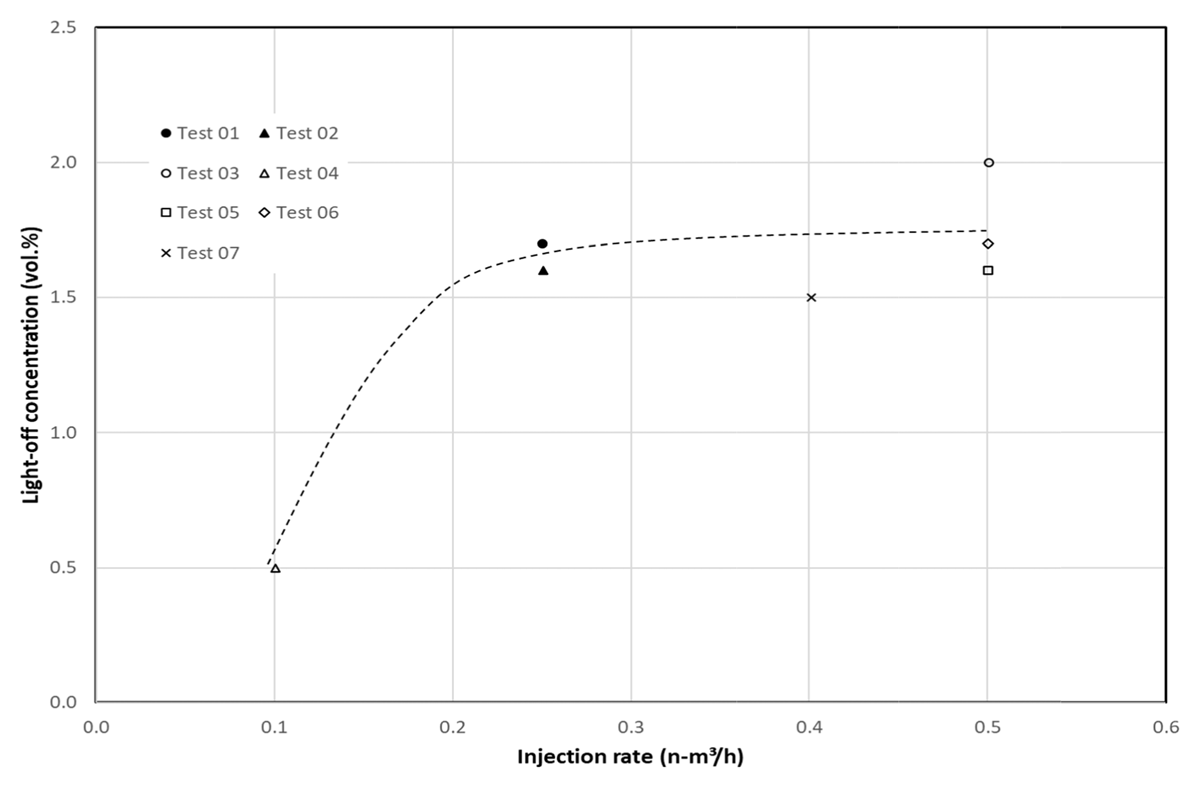
Figure 10
Observed light-off concentrations for different hydrogen injection rates.
Figure 11 shows the recombination rate per inlet cross section (418 cm² for a single recombiner) as a function of the hydrogen concentration. Results show a consistent trend over the entire range of measurements.
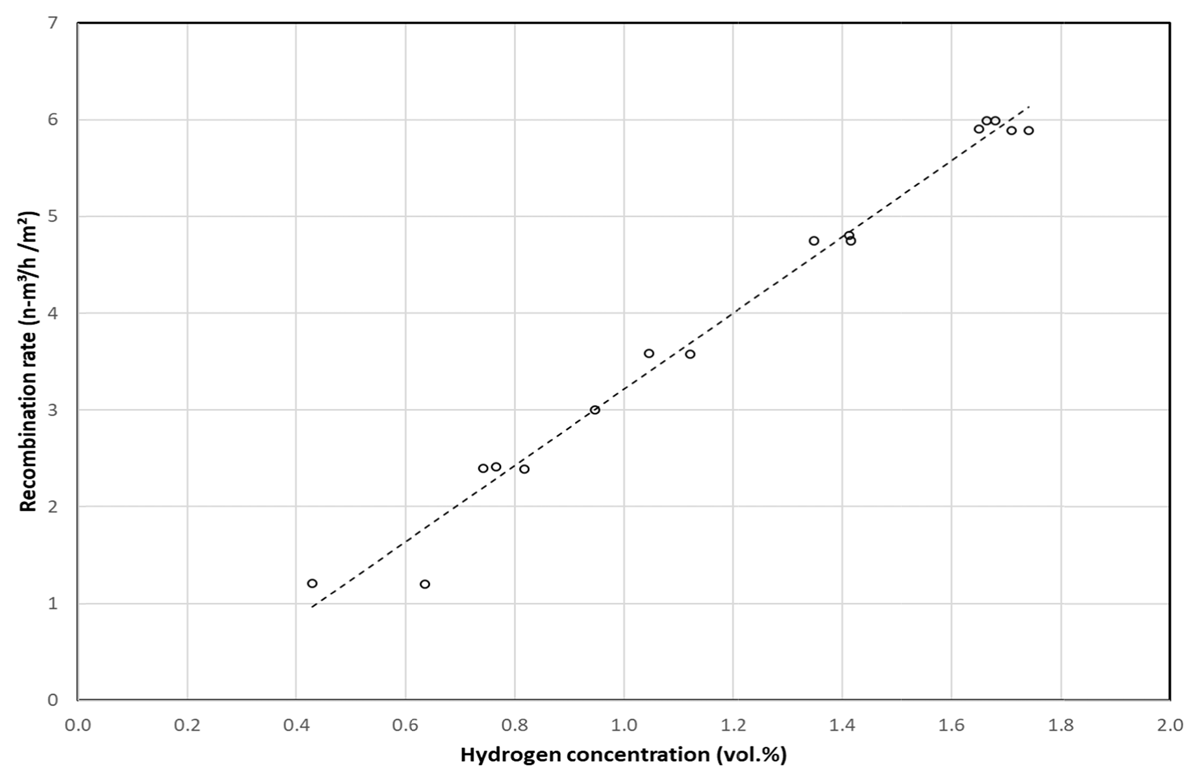
Figure 11
Recombination rate per inlet cross section as a function of the hydrogen concentration for both recombiner set-ups.
From the data the following correlation has been derived:
with a = – 0.73 and b = 3.94.
This correlation is considered to be valid for hydrogen concentrations between 0.5 vol.% and 2.0 vol.%. The full rate can be considered to be achieved once the light-off has occurred around 1.7 vol.%.
5. Conclusions and Outlook
The installation of catalytic recombiners is a suitable mitigation measure to reduce the risk of hydrogen accumulation in closed areas where venting is insufficient or even impossible. The goal of the present study was to determine the hydrogen conversion rate of a recombiner as a function of the hydrogen concentration at the inlet. For this purpose, experiments were performed with two arrangements of recombiners in the REKO-4 facility.
The obtained correlation is scalable and, as such, is applicable for first safety engineering estimations. It could be used to determine the quantity of recombiners that are needed for specific applications. In addition, the capacity of a recombiner installation could be assessed. Within this context, the implementation of the correlation in a CFD environment is recommended.
The correlation has a range of validity up to 2 vol.% hydrogen at ambient pressure and temperature as this is the acceptable limit in many applications. The boundary conditions in the presented study were room temperature and atmospheric pressure. Nonetheless, for specific applications future experimentation will require higher pressures and higher hydrogen concentrations. In addition, experimental programs could be run to expand the boundary conditions to oxygen starvation as well as the impact of catalyst poisoning, specifically with a focus on maritime conditions. However, research is ongoing for applications of recombiners for liquid hydrogen maritime transportation. In this case, future experimentation will require hydrogen/air mixtures at temperatures well below 0°C.
Competing Interests
Ernst-Arndt Reinecke is member of the Editorial Board of Hydrogen Safety. He was removed from all editorial processes in handling this paper. The authors have no other competing interests to declare.