
Table 1a
Descriptive Statistics for EBS-8 Items
| Item | Mean | M | SD | Skewness | Kurtosis |
|---|---|---|---|---|---|
| Item 1 | 4.244 | 4 | 1.476 | −.371 | −.971 |
| Item 2 | 4.154 | 4 | 1.457 | −.414 | −.815 |
| Item 3 | 3.997 | 4 | 1.476 | −.303 | −.910 |
| Item 4 | 4.130 | 4 | 1.506 | −.396 | −.943 |
| Item 5 | 4.097 | 4 | 1.500 | −.377 | −.934 |
| Item 6 | 4.074 | 4 | 1.533 | −.378 | −.966 |
| Item 7 | 3.766 | 4 | 1.543 | −.176 | −1.001 |
| Item 8 | 3.957 | 4 | 1.516 | −.188 | −1.078 |
Table 1b
Inter-Item Pearson Correlation Matrix for EBS-8 Items
Table 2
Internal Consistency Analysis of the EBS-8 Items
| Item | Scale Mean if Item Deleted | Scale Variance if Item Deleted | Corrected Item-Total Correlation | Cronbach's Alpha if Item Deleted |
|---|---|---|---|---|
| Item1 | 28.1739 | 98.768 | .910 | .979 |
| Item2 | 28.2642 | 98.336 | .940 | .978 |
| Item3 | 28.4214 | 98.352 | .926 | .979 |
| Item4 | 28.2876 | 97.266 | .946 | .978 |
| Item5 | 28.3211 | 97.131 | .956 | .977 |
| Item6 | 28.3445 | 96.884 | .941 | .978 |
| Item7 | 28.6522 | 97.328 | .917 | .979 |
| Item8 | 28.4615 | 99.800 | .844 | .983 |
Table 3
Total Variance Explained for the EBS-8 Factor Structure
| Component | Initial Eigenvalues | Extraction Sums of Squared Loadings | ||||
|---|---|---|---|---|---|---|
| Factor | Total | % of Variance | Cumulative % | Total | % of Variance | Cumulative % |
| 1 | 7.090 | 88.627 | 88.627 | 6.965 | 87.058 | 87.058 |
| 2 | .292 | 3.654 | 92.281 | — | — | — |
| 3 | .164 | 2.050 | 94.332 | — | — | — |
| 4 | .124 | 1.550 | 95.882 | — | — | — |
| 5 | .104 | 1.300 | 97.182 | — | — | — |
| 6 | .091 | 1.134 | 98.316 | — | — | — |
| 7 | .071 | .885 | 99.200 | — | — | — |
| 8 | .064 | .800 | 100.000 | — | — | — |
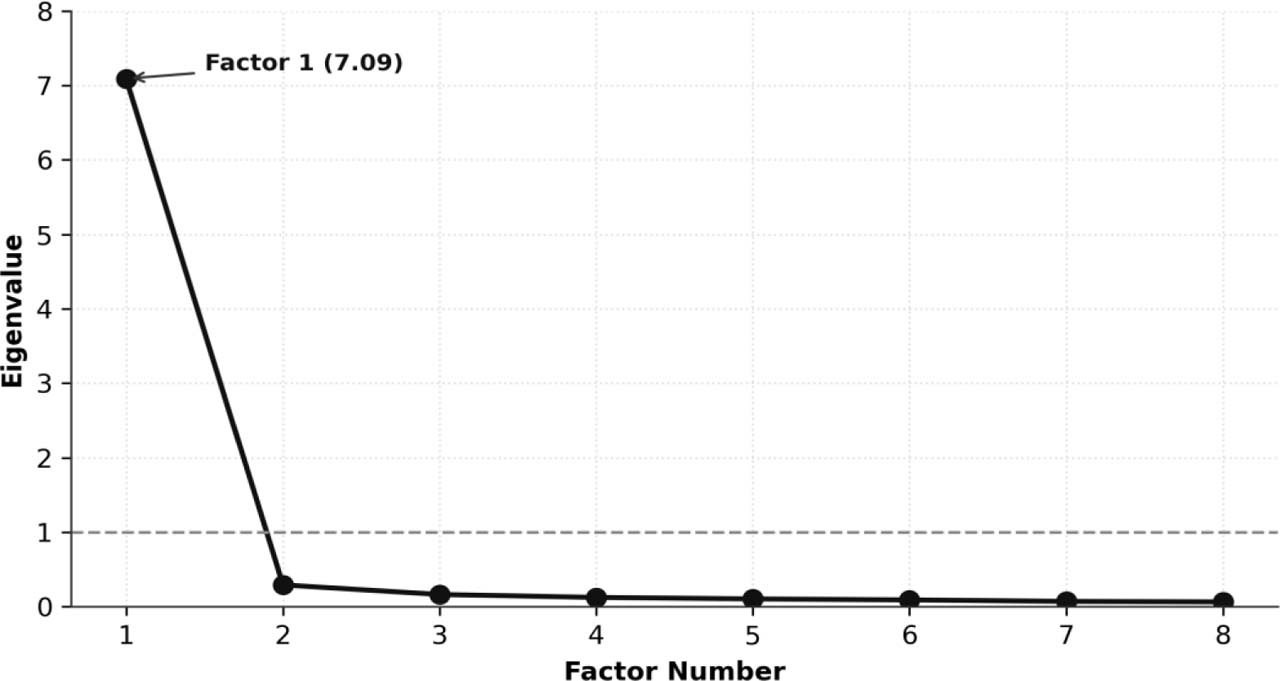
Figure 1
Scree Plot of the EBS-8 Items
Table 4
Factor Matrix for the EBS-8 Items
| Item | Factor 1 Loading |
|---|---|
| Item1 | .967 |
| Item2 | .957 |
| Item3 | .951 |
| Item4 | .951 |
| Item5 | .937 |
| Item6 | .926 |
| Item7 | .920 |
| Item8 | .850 |
Table 5
Goodness of Fit Indices for the EBS-8 Unifactorial Model
| Fit Index | Recommended Threshold / Criterion | Unifactorial Model Value |
|---|---|---|
| χ2 | Lower is better | 93.924 (df = 20) |
| χ2/df | < 3 | 4.70 |
| CFI | > 0.95 | 0.989 |
| TLI | > 0.95 | 0.985 |
| NNFI | > 0.95 | 0.985 |
| NFI | > 0.90 | 0.986 |
| RMSEA | < 0.08 | 0.081 [0.065–0.098] |
| SRMR | < 0.08 | 0.011 |
| AIC | Lower is better | 9,404.669 |
| BIC | Lower is better | 9,473.973 |
| GFI | > 0.90 | 0.959 |
| MFI | > 0.90 | 0.936 |
[i] Note. χ2 = Chi-square; df = degrees of freedom; CFI = Comparative Fit Index; TLI = Tucker-Lewis Index; NNFI = Non-Normed Fit Index; NFI = Normed Fit Index; RMSEA = Root Mean Square Error of Approximation [90% Confidence Interval]; SRMR = Standardized Root Mean Square Residual; AIC = Akaike Information Criterion; BIC = Bayesian Information Criterion; GFI = Goodness of Fit Index; MFI = McDonald's Fit Index.
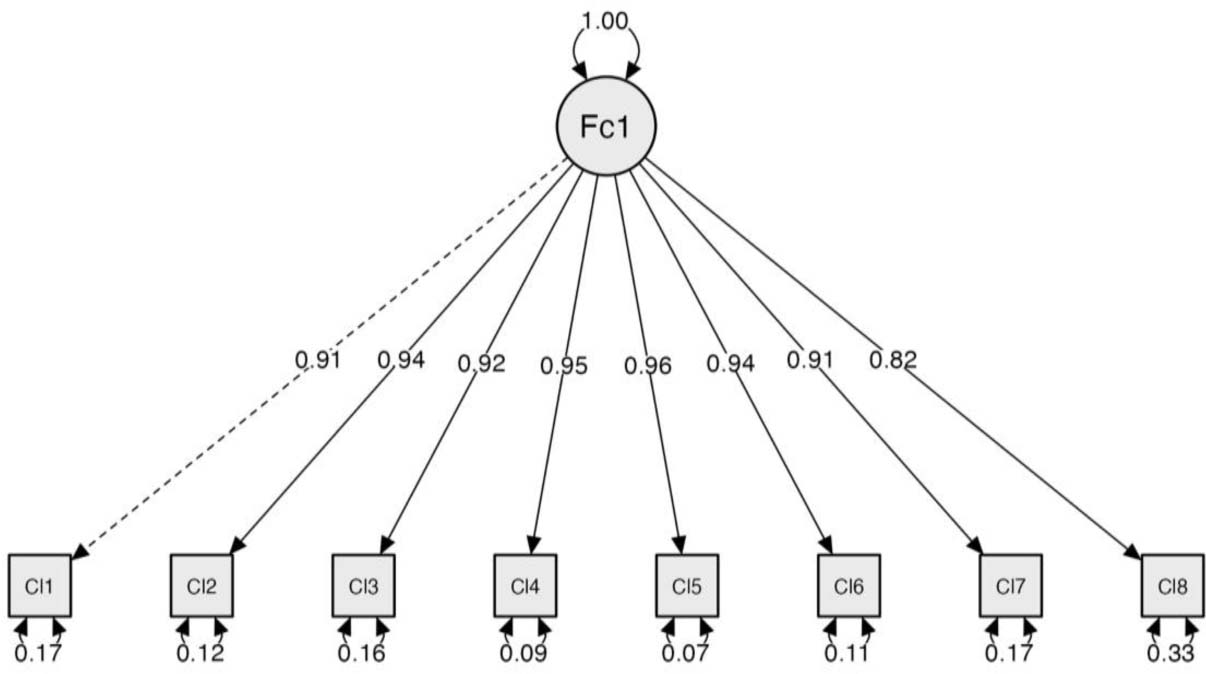
Figure 2.
Unifactorial Model of the EBS-8.
Table 6a
Measurement Invariance of EBS-8 Across Gender: Overall Model Fit Indices
| Invariance Level | χ2 | df | p (Model) | CFI | TLI | RMSEA |
|---|---|---|---|---|---|---|
| Configural | 128.773 | 40 | < .001 | .987 | .982 | .089 |
| Metric | 134.384 | 47 | < .001 | .987 | .985 | .081 |
| Scalar | 152.040 | 54 | < .001 | .985 | .985 | .080 |
| Strict | 174.945 | 62 | < .001 | .983 | .985 | .081 |
| Structural | 175.840 | 64 | < .001 | .983 | .986 | .079 |
Table 6b
Nested Model Comparisons Across Invariance Levels
| Invariance Level | Δχ2 | Δdf | p (Δχ2) | ΔCFI | ΔTLI | ΔRMSEA |
|---|---|---|---|---|---|---|
| Configural | — | — | — | — | — | — |
| Metric | 5.611 | 7 | .586 | .000 | +.003 | −.008 |
| Scalar | 17.656 | 7 | .014 | −.002 | .000 | −.001 |
| Strict | 22.905 | 8 | .003 | −.002 | .000 | +.001 |
| Structural | 0.895 | 2 | .639 | .000 | +.001 | −.002 |
[i] Note. χ2 = chi-square statistic; df = degrees of freedom; CFI = Comparative Fit Index; TLI = Tucker–Lewis Index; RMSEA = Root Mean Square Error of Approximation. p (Model) refers to the overall model chi-square test; p (Δχ2) refers to the chi-square difference test between successive nested models. ΔCFI, ΔTLI, and ΔRMSEA represent changes relative to the preceding model. Models were estimated using maximum likelihood (ML), treating the six-category items as continuous variables.
Table 7
Convergent Validity: Inter-Correlations Between DASS-21 Subscales and EBS-8