
Introduction
Subjective well-being (SWB) is a central construct in contemporary psychological research. It refers to how individuals evaluate their lives, combining cognitive judgments—such as global life satisfaction—with the affective experience of positive emotions (Diener et al., 2018; Maddux, 2024). These dimensions capture core aspects of daily psychological functioning and act as a protective resource. Higher SWB attenuates the impact of stress and supports adaptation in interpersonal and social contexts (Cheung & Lucas, 2014; Quiñonez Tapia & Vargas Garduño, 2023). Across adulthood, subjective well-being is also associated with psychological adjustment, social functioning, perceived health, and the capacity to cope with changing personal, family, and occupational demands (Kubzansky et al., 2023).
Subjective well-being is relevant across the adult life course because adulthood involves changing demands related to employment, family responsibilities, caregiving, health, financial security, and social participation. Higher levels of well-being are generally associated with better psychological adjustment, stronger social relationships, and more adaptive responses to stress. Conversely, lower subjective well-being tends to coexist with emotional distress, impaired daily functioning, social disconnection, and poorer perceived quality of life (Kubzansky et al., 2023). For this reason, its assessment is relevant not only in clinical psychology but also in public health, community, occupational, and social-service settings (World Health Organization, 2022). Besides, higher-education institutions increasingly treat SWB as a relevant factor in student development and campus climate (Liao & Li, 2025). Higher well-being scores are associated with better academic progression. Engaged students show stronger interpersonal networks and a lower risk of anxiety and depressive symptoms (Craig et al., 2025; Greco et al., 2025; Rani, 2025). Low SWB shows the opposite pattern. It is associated with poorer academic performance, mental health, and social integration (Pervaiz et al., 2025; Sánchez-Vincitore et al., 2025; Zhao, 2024).
Mental-health difficulties are highly relevant when examining subjective well-being in adults. Depression, anxiety, and stress can affect interpersonal relationships, occupational functioning, self-care, family life, and participation in the community. At the same time, subjective well-being should not be understood merely as the absence of psychological symptoms. It represents a positive dimension of functioning that captures how people evaluate and experience their lives. Assessing both distress and positive well-being therefore provides a more complete picture of adult mental health (Magalhães, 2024; Mason Stephens et al., 2023). Chilean institutions currently report a marked level of mental-health vulnerability in their adult students. Recent data show elevated rates of anxiety, depression, and stress in this population (Martínez-Líbano et al., 2023). These difficulties also have systemic consequences and contribute to the rising dropout rates observed nationwide (Martínez-Líbano et al., 2023). Untreated mental-health problems may have lasting effects on professional trajectories and long-term psychological functioning (Otieno, 2025; Zhang et al., 2024). In Chile, the assessment of adult mental health has often emphasized symptoms, risk, and psychological distress. Although these indicators are essential, less attention has been paid to brief measures of positive functioning that can be applied across diverse adult groups. A culturally appropriate measure of subjective well-being could support research and monitoring across community, clinical, occupational, and public health contexts (Chan, 2024; World Health Organization, 2022).
The assessment of well-being in adult populations also requires instruments that are brief, clear, and easy to administer. Adult samples are heterogeneous in age, educational background, health status, digital literacy, and familiarity with psychological questionnaires. Lengthy assessment protocols can increase fatigue, reduce concentration, generate missing responses, and discourage participation, particularly when instruments are administered repeatedly or alongside other health and sociodemographic measures. Brief scales can reduce respondent burden, improve feasibility, and facilitate their use in large surveys, primary care, community programs, workplaces, and longitudinal monitoring. However, brevity is useful only when it is accompanied by adequate evidence of validity, reliability, and measurement equivalence across relevant population groups (Mokkink et al., 2024).
Certain adult populations may be particularly exposed to contextual stressors that affect both psychological distress and subjective well-being. For example, adults enrolled in higher education face academic workloads, assessment pressure, financial demands, and difficulties balancing study with work and family responsibilities. These pressures may be associated with maladaptive coping strategies, including high caffeine intake, alcohol use, and tobacco consumption, with additional consequences for physical and emotional health (Alqawasmi et al., 2024; Chemagosi, 2024; Oluwole et al., 2024). Evidence from Chilean undergraduate samples indicates that more than 45% report symptoms of mood or anxiety disorders and nearly 12% report suicidal ideation (Barrera-Herrera & Martín, 2021; Martínez-Líbano et al., 2025). Similar patterns of stress, insomnia, and mood symptoms have been reported internationally (Akram et al., 2023; Ramón-Arbués et al., 2020). Although these findings cannot be generalized to all adults, they illustrate how contextual demands can place specific adult groups at heightened risk and reinforce the need for brief instruments that assess positive psychological functioning alongside distress. Governments and public institutions increasingly regard psychological well-being as an indicator of broader social and human development. This shift has encouraged the systematic monitoring of population-level well-being and the incorporation of positive mental-health indicators into research and policy (González-Díaz et al., 2021; Wong et al., 2024). Such monitoring requires instruments that are brief, psychometrically sound, culturally appropriate, and suitable for use across heterogeneous adult populations.
The original Subjective Well-Being Scale (EBS-20) addressed this measurement need by assessing life satisfaction and positive affect. However, its 20-item length may increase respondent burden when it is included in broader assessment protocols or administered repeatedly. The EBS-8 was developed to address this limitation. It condenses the original scale into a unidimensional eight-item measure, offering practical advantages for clinical, community, epidemiological, and population-based assessment (Calleja et al., 2022). Initial validation studies support its psychometric properties. Nevertheless, instruments cannot be assumed to function equivalently across cultural contexts and population groups. Local validation is therefore required before the EBS-8 can be recommended for assessing Chilean adults.
The present study addresses this gap by examining the psychometric properties and measurement invariance of the EBS-8 in a heterogeneous sample of Chilean adults. The analyses focus on its factorial structure, internal consistency, convergent validity, and measurement equivalence across relevant demographic groups. Establishing these psychometric properties is necessary to assess the instrument’s suitability for research and for measuring subjective well-being among Chilean adults. Its potential use as a screening tool will require additional studies to examine its diagnostic accuracy and establish validated cut-off points.
Purpose
The purpose of this quantitative study is to examine the psychometric properties and measurement invariance of the Subjective Well-Being Scale (EBS-8) in Chilean adults. The study focuses specifically on the structural validity, internal consistency, and measurement invariance of the short form across gender, with the aim of evaluating the extent to which scores may be considered comparable between men and women.
This focus is directly relevant to psychometric methodology and applied assessment. Robust psychometric evidence is a prerequisite for considering a brief instrument for large-scale, time-constrained, and repeated assessments. However, its suitability for clinical screening or individual classification requires additional evidence regarding diagnostic accuracy, predictive validity, and validated cut-off scores. The broader social context is the need for accessible and culturally appropriate tools to support the assessment of positive psychological functioning in clinical, community, occupational, educational, and public health settings.
The central phenomenon under study is subjective well-being, as operationalized by the EBS-8, together with its factorial structure, reliability, gender-specific measurement invariance, and convergent validity with the DASS-21. The study is guided by the following questions: Does the EBS-8 retain a unidimensional structure in Chilean adults? Is it reliable and invariant across gender? And does it relate to depression, anxiety, and stress in the theoretically expected direction?
Methodology
Study Design and Setting
This study had a quantitative design (Ato et al., 2013). The study was conducted in Chile using a digitally administered survey accessible to adults across community, occupational, educational, and social settings. Data were collected through a cross-sectional survey (Creswell & Clark, 2017). The protocol followed current psychometric validation guidelines for the educational and psychological sciences (López-Pina & Veas, 2024). This design allows for the evaluation of the factorial dimensionality, internal consistency, and construct validity of the EBS-8 among adults.
Participants and Sampling
Participants were eligible if they were 18 years of age or older, resided in Chile at the time of data collection, could read and understand Spanish, and could understand the study procedures and provide informed consent independently. No upper age limit was established, and participation was open to all adults regardless of educational level, employment status, or current enrollment in higher education. Participants were excluded if they submitted incomplete questionnaires that prevented calculation of scale scores or if they generated duplicate or clearly invalid response records. However, no incomplete questionnaires or missing values were identified in the variables analyzed; therefore, it was not necessary to exclude participants for these reasons or to apply data imputation procedures. The sample size was determined by the requirements for parameter estimation. The psychometric literature recommends 5 to 10 respondents per estimated parameter, with a minimum of around 200 cases for models with strong factor loadings (Lorenzo-Seva & Ferrando, 2024; MacCallum et al., 1999). Confirmatory factor analysis (CFA) imposes stricter requirements, with at least 300 participants generally recommended to obtain stable parameter estimates (Black & Babin, 2019; Hair, 2025).
A total sample of 861 participants was obtained using a non-probabilistic snowball sampling procedure. Subsequently, the total sample was divided into two mutually exclusive analytical subsamples for exploratory and confirmatory factor analysis. The first subsample (n = 299) was used for exploratory factor analysis (EFA), while the second (n = 562) was used for confirmatory factor analysis (CFA). This methodological strategy made it possible to first examine the factor structure of the Subjective Well-Being Scale (EBS-8) and subsequently evaluate the fit of the identified model using data from participants other than those included in the exploratory phase. The use of subsamples with no overlapping participants made it possible to avoid using the same data in both analytical stages, helping to reduce the risk of capitalizing on chance and providing a more rigorous assessment of the stability of the proposed factor structure.
Gender was assessed through a self-reported sociodemographic question with three response options: male, female, and other. In the final analytic sample, all 861 participants were recorded in the male or female categories. Sample 1 for the Exploratory Factor Analysis (EFA) (n = 299) included 207 participants in the female category (69.2%) and 92 in the male category (30.8%). Ages ranged from 18 to 61 years, with a mean of 26 (SD = 8.84). Sample 2 for the Confirmatory Factor Analysis (CFA) (n = 562) showed a similar distribution. Female respondents accounted for 67.6% (n = 380) and male respondents for 32.4% (n = 182). The mean age was again 26 years (SD = 9.14).
Data were collected through digital snowball sampling. Initial recruitment took place across community networks, workplaces, educational institutions, social organizations, and digital platforms. Peer-to-peer diffusion expanded the sample's reach. The survey was hosted in Google Forms and required informed consent before access. The consent screen described the study aims, data-handling procedures, and participant rights. Participants had to provide active digital consent; refusal ended the session. Since there were no incomplete responses, it was not necessary to apply procedures for removing cases with missing data.
Measures and Instrumentation
Calleja and Mason originally developed the Subjective Well-Being Scale (EBS-20) as a 20-item, two-factor instrument (Calleja & Mason, 2020). This initial structure separated life satisfaction (cognitive component) from positive affect (emotional component). Subsequent psychometric studies, however, showed high multicollinearity between the two domains. This overlap led the authors to reformulate the scale as a single well-being dimension (Calleja et al., 2022).
The resulting EBS-8 reduces the scale to eight items, drawn equally from the cognitive and emotional item pools. Sample items include “I like my life,” “I am a happy person,” and “My life brings me joy.” Response format uses a six-point Likert scale for agreement, anchored at 1 (Strongly disagree) and 6 (Strongly agree).
This shorter format addresses the practical limitations of the EBS-20. The EBS-8 retains adequate psychometric properties while reducing response burden. This brevity is useful in extended assessment batteries and in time-constrained clinical, community, occupational, educational, and population-based settings.
We administered the Depression, Anxiety, and Stress Scale (DASS-21) to assess convergent validity (Lovibond & Lovibond, 1995) The 21-item inventory is a shortened version of the original 42-item inventory and assesses three negative emotional states, each assessed with seven items. The Depression subscale captures anhedonia, dysphoria, and loss of motivation. The Anxiety subscale assesses autonomic arousal, situational anxiety, and skeletal muscle tension. The Stress subscale measures persistent nervous arousal, irritability, and cognitive overload. Respondents rate symptom frequency on a 4-point scale (0 = "Did not apply to me at all" to 3 = "Applied to me very much, or most of the time"). Subscale sums yield severity categories aligned with established clinical thresholds (mild, moderate, severe, extremely severe).
Statistical Analysis
Statistical analyses were performed using IBM SPSS Statistics, version 30.0 (IBM, 2025) and JASP, version 0.19.3 (JASP Team, 2025). SPSS was used for descriptive analyses, the assessment of internal consistency, and exploratory factor analysis, while JASP was used for confirmatory factor analysis and tests of measurement invariance between men and women.
The analysis proceeded in several stages. We first computed descriptive statistics for each item, including measures of central tendency and dispersion. Univariate normality was examined through skewness and kurtosis. An inter-item correlation matrix was inspected to evaluate the structural suitability of the data. The Kaiser-Meyer-Olkin (KMO) index and Bartlett's test of sphericity were used to assess sampling adequacy and factorability. Exploratory factor analysis (EFA) was then conducted. Extraction was performed with Principal Axis Factoring. Because a unidimensional solution was expected, no rotation was applied. This step identified the scale’s primary latent structure.
Confirmatory factor analysis (CFA) was then used to test the unidimensional model obtained from the EFA. The CFA used Maximum Likelihood estimation. Global model fit was evaluated with a set of indices: Comparative Fit Index (CFI), Tucker-Lewis Index (TLI), Root Mean Square Error of Approximation (RMSEA), and Standardized Root Mean Square Residual (SRMR). The Akaike (AIC) and Bayesian (BIC) Information Criteria were used for model comparison. Invariance was assessed using progressively more restrictive nested models, considering both chi-square difference tests (Δχ2) and changes in the incremental and absolute fit indices (ΔCFI and ΔRMSEA). The thresholds of |ΔCFI| ≤ .010 and |ΔRMSEA| ≤ .015 (Chen, 2007) were used as guiding criteria. The interpretation took these indicators into account collectively, avoiding conclusions based exclusively on the statistical significance of Δχ2. Convergent validity was assessed with Pearson correlation coefficients. We examined the bivariate associations between the EBS-8 total score and the three DASS-21 subscales. As a supplementary practical resource, the authors proposed five descriptive score ranges based on the EBS-8 theoretical total score range of 8 to 48 points: very low (8–16), low (17–24), moderate (25–33), high (34–41), and very high (42–48) subjective well-being. These ranges were defined solely on the basis of possible total scores, rather than empirical percentiles, population norms, or external validation criteria. They are intended to facilitate descriptive communication of scores and are not presented as validated interpretive thresholds.
Ethical considerations
Ethical approval for this study was obtained from the Central Bioethics Committee of Universidad Andrés Bello (Registry No. 024/2022). The study was conducted in accordance with the ethical principles for research involving human participants set out in the Declaration of Helsinki and with the local regulations governing scientific research in Chile. Written/digital informed consent was obtained from all participants prior to their involvement in the study. Participation was voluntary, and no financial or academic compensation was offered. No personally identifiable information was recorded.
Declaration of Generative AI and AI-Assisted Technologies in the Writing Process
Generative AI-assisted tools were used to support language refinement and editorial preparation of the manuscript. These tools were not used to generate, alter, or fabricate research data, perform the statistical analyses, or determine the scientific conclusions. All AI-assisted content was critically reviewed and verified by the authors, who take full responsibility for the final manuscript.
Results
Descriptive Statistics and Correlations
Item means for the EBS-8 (Table 1a) ranged from 3.77 (Item 7) to 4.24 (Item 1). Standard deviations were similar across items, ranging from 1.457 (Item 2) to 1.543 (Item 7). Distributional indices supported univariate normality. Skewness values were within acceptable limits (−0.414 to −0.176). Kurtosis values were also within acceptable limits (−1.078 to −0.815). These values meet the distributional assumptions of maximum likelihood estimation. Inter-item correlations (Table 1b) were all positive and statistically significant (p < .01). The magnitude of these correlations was substantial. Coefficients ranged from r = .767 (Items 1 and 8) to r = .930 (Items 2 and 5). This pattern indicates that the items measure the same underlying construct.
This level of interrelation indicates strong baseline consistency across items. The data are therefore suitable for the exploratory and confirmatory analyses that follow.
Table 1a
Descriptive Statistics for EBS-8 Items
| Item | Mean | M | SD | Skewness | Kurtosis |
|---|---|---|---|---|---|
| Item 1 | 4.244 | 4 | 1.476 | −.371 | −.971 |
| Item 2 | 4.154 | 4 | 1.457 | −.414 | −.815 |
| Item 3 | 3.997 | 4 | 1.476 | −.303 | −.910 |
| Item 4 | 4.130 | 4 | 1.506 | −.396 | −.943 |
| Item 5 | 4.097 | 4 | 1.500 | −.377 | −.934 |
| Item 6 | 4.074 | 4 | 1.533 | −.378 | −.966 |
| Item 7 | 3.766 | 4 | 1.543 | −.176 | −1.001 |
| Item 8 | 3.957 | 4 | 1.516 | −.188 | −1.078 |
Table 1b
Inter-Item Pearson Correlation Matrix for EBS-8 Items
| Item | 1 | 2 | 3 | 4 | 5 | 6 | 7 | 8 |
|---|---|---|---|---|---|---|---|---|
| 1. Item 1 | — | |||||||
| 2. Item 2 | .900** | — | ||||||
| 3. Item 3 | .888** | .896** | — | |||||
| 4. Item 4 | .875** | .916** | .889** | — | ||||
| 5. Item 5 | .896** | .930** | .910** | .926** | — | |||
| 6. Item 6 | .858** | .890** | .890** | .916** | .915** | — | ||
| 7. Item 7 | .831** | .864** | .865** | .874** | .891** | .900** | — | |
| 8. Item 8 | .767** | .795** | .770** | .826** | .811** | .823** | .829** | — |
Factor Structure
The Kaiser-Meyer-Olkin index indicated excellent suitability of the data for factor analysis (KMO = 0.961). Likewise, Bartlett’s sphericity test was statistically significant (χ2(28) = 3895.417; p < 0.001), allowing us to reject the null hypothesis that the correlation matrix is an identity matrix. Taken together, these results supported the appropriateness of conducting exploratory factor analysis. Principal axis factoring yielded a unidimensional solution. Corrected item-total correlations supported this single-factor solution and ranged from .844 (Item 8) to .956 (Item 5).
Reliability estimates were consistent with this structure (Table 2). The eight items yielded a Cronbach’s alpha of α = .981. Item-deletion analyses produced only minor changes, with alpha values between .977 and .983. Item-deletion analyses indicated that removing Item 8 would produce only a negligible increase in Cronbach’s alpha, from .981 to .983. Given the small magnitude of this difference, retention of all eight items was considered appropriate. These results support the measurement precision of the EBS-8, with each item contributing to the well-being construct.
Table 2
Internal Consistency Analysis of the EBS-8 Items
| Item | Scale Mean if Item Deleted | Scale Variance if Item Deleted | Corrected Item-Total Correlation | Cronbach's Alpha if Item Deleted |
|---|---|---|---|---|
| Item1 | 28.1739 | 98.768 | .910 | .979 |
| Item2 | 28.2642 | 98.336 | .940 | .978 |
| Item3 | 28.4214 | 98.352 | .926 | .979 |
| Item4 | 28.2876 | 97.266 | .946 | .978 |
| Item5 | 28.3211 | 97.131 | .956 | .977 |
| Item6 | 28.3445 | 96.884 | .941 | .978 |
| Item7 | 28.6522 | 97.328 | .917 | .979 |
| Item8 | 28.4615 | 99.800 | .844 | .983 |
Explained Variance and Factor Loadings
Inspection of the scree plot (Figure 1) showed a clear inflection after the first component. This pattern is consistent with a single-factor solution. Kaiser’s criterion agreed with this evidence. The first factor produced an eigenvalue of 7.09, accounting for 88.63% of the unrotated variance. After extraction, this factor retained 87.06% of the variance. This indicates a unitary latent construct underlying the EBS-8. Subsequent components were negligible. All remaining eigenvalues fell well below 1.0 and contributed little additional variance. Table 3 reports these extraction values. Together, these results do not support a multidimensional solution.
Item-level analyses supported this unidimensional structure. All eight items loaded on the extracted factor (Table 4). Factor loadings were high, ranging from .850 (Item 8) to .967 (Item 1). These loadings support the factorial structure of the EBS-8 as a measure of subjective well-being in Chilean adults.
Table 3
Total Variance Explained for the EBS-8 Factor Structure
| Component | Initial Eigenvalues | Extraction Sums of Squared Loadings | ||||
|---|---|---|---|---|---|---|
| Factor | Total | % of Variance | Cumulative % | Total | % of Variance | Cumulative % |
| 1 | 7.090 | 88.627 | 88.627 | 6.965 | 87.058 | 87.058 |
| 2 | .292 | 3.654 | 92.281 | — | — | — |
| 3 | .164 | 2.050 | 94.332 | — | — | — |
| 4 | .124 | 1.550 | 95.882 | — | — | — |
| 5 | .104 | 1.300 | 97.182 | — | — | — |
| 6 | .091 | 1.134 | 98.316 | — | — | — |
| 7 | .071 | .885 | 99.200 | — | — | — |
| 8 | .064 | .800 | 100.000 | — | — | — |
Factor Loadings and Internal Consistency
Principal axis factoring identified a single dominant dimension underlying the EBS-8 (Table 4). Standardized loadings on this factor were high. Coefficients ranged from .850 (Item 8) to .967 (Item 1). Each item contributed directly to the latent well-being construct. Communalities supported this structure. Extracted variance estimates were uniformly high across items. The latent factor accounted for most of the variance in each item. This result is consistent with the unidimensional model hypothesized for the instrument. Reliability estimates were consistent with this structure. The scale yielded Cronbach’s alpha = .981 and McDonald’s omega = .983. Both values exceed the conventional .80 threshold and indicate high internal consistency. Together, these extraction and reliability results support the EBS-8 as a precise measure of subjective well-being in Chilean adults.
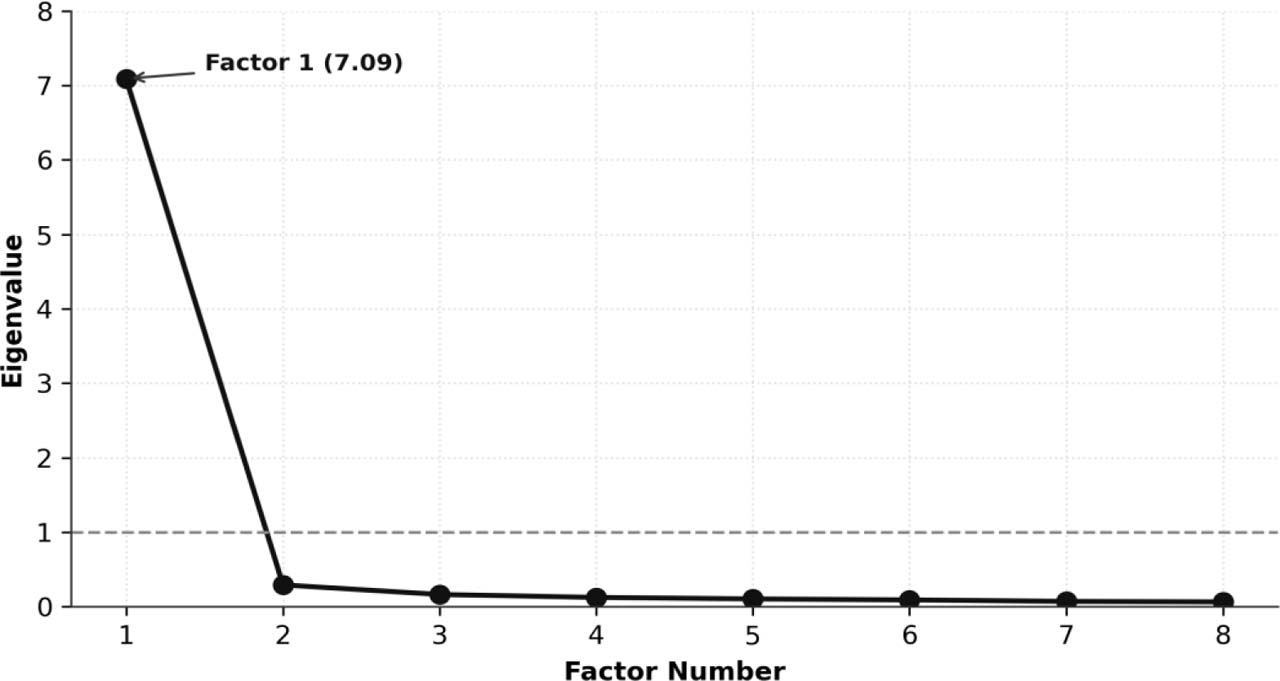
Figure 1
Scree Plot of the EBS-8 Items
Confirmatory Factor Analysis
Confirmatory factor analysis (CFA) was then used to test this unidimensional structure. Table 5 reports the global fit indices for the EBS-8. The one-factor model showed acceptable fit. As is common with large samples, the chi-square statistic was significant (χ2 (20) = 93.924). The normed chi-square (χ2/df = 4.70) exceeded the conservative cutoff of 3.0, suggesting some degree of model misfit. Incremental fit indices were favorable. The Comparative Fit Index (CFI = .989), Tucker-Lewis Index (TLI = .985), Non-Normed Fit Index (NNFI = .985), and Normed Fit Index (NFI = .986) all exceeded the .95 criterion. These incremental indices support a favorable model fit, although their interpretation must be supplemented with absolute fit indicators.
The results for the absolute fit indices were more mixed. The Root Mean Square Error of Approximation (RMSEA) was .081 (90% CI [.065, .098]). This value is slightly above the conventional threshold of .08, suggesting an acceptable, though not optimal, fit. The Standardized Root Mean Square Residual (SRMR) was .011, well below the cutoff of .08, indicating a favorable fit according to this specific measure. The Goodness of Fit Index (GFI = .959) and the McDonald-Wright Fit Index (MFI = .936) also indicated a satisfactory model fit.
In terms of information criteria, the Akaike Information Criterion (AIC = 9,404.67) and the Bayesian Information Criterion (BIC = 9,473.97) serve as descriptive indicators that allow for the comparison of alternative models, but do not in and of themselves constitute evidence of an adequate fit for the evaluated model. Overall, the CFA results suggest that the one-factor model of the EBS-8 exhibits generally acceptable fit in this sample of Chilean adults. This interpretation considers the incremental and absolute fit indices jointly, while acknowledging that the RMSEA indicates some limitations in model fit.
Figure 2 presents the path diagram for the unifactorial model. In this model, a single latent factor (Fc1) explains all eight items (CI1–CI8), with standardized factor loadings ranging from 0.82 (CI8) to 0.96 (CI5). All loadings are substantial, indicating that each item is strongly associated with the underlying construct measured by the scale.
The residual variances for the items range from 0.07 (CI5) to 0.33 (CI8), suggesting that while most of the variance in each item is explained by the latent factor, some items (such as CI8) retain a higher proportion of unexplained variance. This pattern indicates that the unifactorial model captures the common variance among items effectively, but there may be specific aspects of certain items that are not fully accounted for by the single factor.
Overall, these results provide strong support for the unidimensional structure of the scale, with all items demonstrating high factor loadings and relatively low residual variances. The model is conceptually coherent, with a single latent factor adequately representing the shared variance among the observed variables.
Table 5
Goodness of Fit Indices for the EBS-8 Unifactorial Model
| Fit Index | Recommended Threshold / Criterion | Unifactorial Model Value |
|---|---|---|
| χ2 | Lower is better | 93.924 (df = 20) |
| χ2/df | < 3 | 4.70 |
| CFI | > 0.95 | 0.989 |
| TLI | > 0.95 | 0.985 |
| NNFI | > 0.95 | 0.985 |
| NFI | > 0.90 | 0.986 |
| RMSEA | < 0.08 | 0.081 [0.065–0.098] |
| SRMR | < 0.08 | 0.011 |
| AIC | Lower is better | 9,404.669 |
| BIC | Lower is better | 9,473.973 |
| GFI | > 0.90 | 0.959 |
| MFI | > 0.90 | 0.936 |
[i] Note. χ2 = Chi-square; df = degrees of freedom; CFI = Comparative Fit Index; TLI = Tucker-Lewis Index; NNFI = Non-Normed Fit Index; NFI = Normed Fit Index; RMSEA = Root Mean Square Error of Approximation [90% Confidence Interval]; SRMR = Standardized Root Mean Square Residual; AIC = Akaike Information Criterion; BIC = Bayesian Information Criterion; GFI = Goodness of Fit Index; MFI = McDonald's Fit Index.
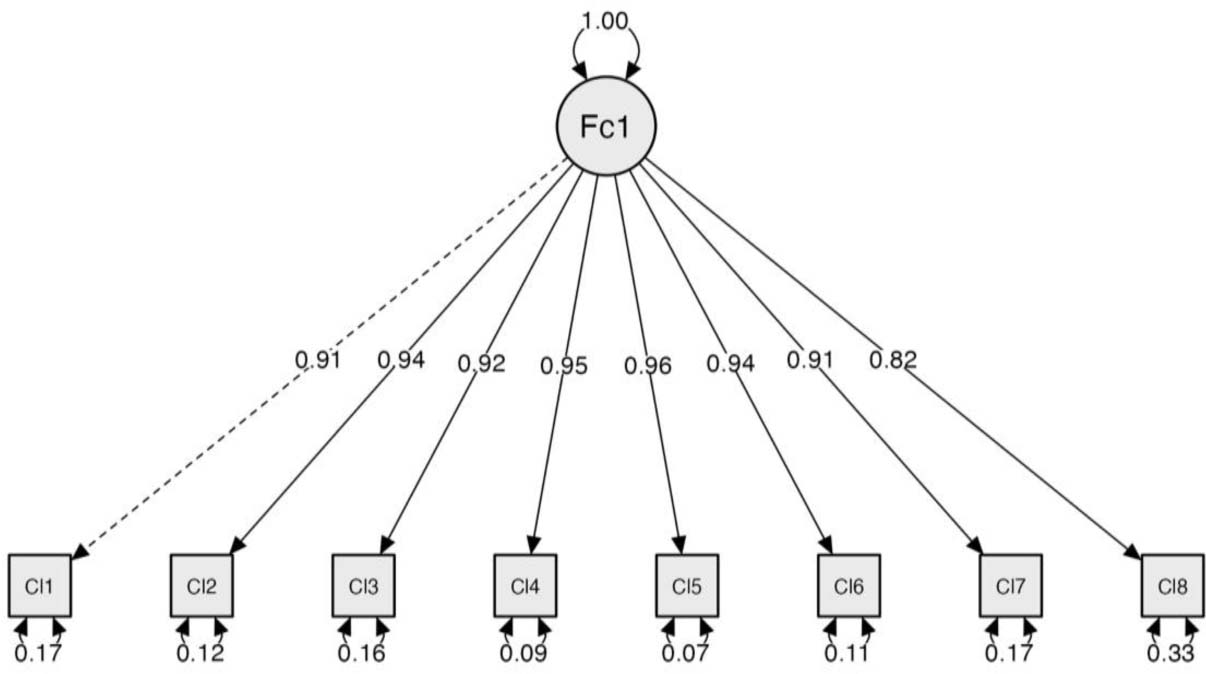
Figure 2.
Unifactorial Model of the EBS-8.
Invariance of the EBS-8 Across Gender
A multi-group invariance analysis was conducted to evaluate the measurement invariance of the scale across gender. The results are presented in Tables 6a and 6b. The configural invariance model showed favorable incremental fit indices (χ2(40) = 128.773, CFI = .987, TLI = .982), providing evidence of a comparable factor structure between men and women. However, the RMSEA of .089 indicated some limitations in absolute model fit. Subsequent models tested increasingly restrictive constraints.
The metric invariance model (χ2 = 134.384, df = 47) did not show a statistically significant deterioration compared to the configural model (Δχ2 = 5.611, Δdf = 7, p = .586; ΔCFI = .000; ΔTLI = +.003; RMSEA = .081; ΔRMSEA = −.008), which supports the equivalence of the factor loadings between the two groups.
The scalar invariance model (χ2 = 152.040, df = 54) showed a statistically significant difference from the metric model (Δχ2 = 17.656, Δdf = 7, p = .014). However, the changes in the fit indices were small (ΔCFI = −.002; ΔTLI = .000; RMSEA = .080; ΔRMSEA = −.001), remaining within the criteria commonly used to assess measurement invariance. These results provide favorable evidence of scalar invariance based on the changes in the fit indices, although the chi-square difference test does not fully support the equality of intercepts between men and women.
The strict invariance model (χ2 = 174.945, df = 62) also showed a statistically significant increase in the chi-square value compared to the scalar model (Δχ2 = 22.905, Δdf = 8, p = .003). However, the changes in the fit indices remained small (ΔCFI = −.002; ΔTLI = .000; RMSEA = .081; ΔRMSEA = +.001), suggesting that imposing restrictions on the residual variances did not result in a substantial deterioration of the overall fit as measured by these indicators.
Finally, the structural invariance model (χ2 = 175.840, df = 64) showed no statistically significant differences from the strict model (Δχ2 = 0.895, Δdf = 2, p = .639) and exhibited minimal changes in the fit indices (ΔCFI = .000; ΔTLI = +.001; RMSEA = .079; ΔRMSEA = −.002).
Table 6a
Measurement Invariance of EBS-8 Across Gender: Overall Model Fit Indices
| Invariance Level | χ2 | df | p (Model) | CFI | TLI | RMSEA |
|---|---|---|---|---|---|---|
| Configural | 128.773 | 40 | < .001 | .987 | .982 | .089 |
| Metric | 134.384 | 47 | < .001 | .987 | .985 | .081 |
| Scalar | 152.040 | 54 | < .001 | .985 | .985 | .080 |
| Strict | 174.945 | 62 | < .001 | .983 | .985 | .081 |
| Structural | 175.840 | 64 | < .001 | .983 | .986 | .079 |
Table 6b
Nested Model Comparisons Across Invariance Levels
| Invariance Level | Δχ2 | Δdf | p (Δχ2) | ΔCFI | ΔTLI | ΔRMSEA |
|---|---|---|---|---|---|---|
| Configural | — | — | — | — | — | — |
| Metric | 5.611 | 7 | .586 | .000 | +.003 | −.008 |
| Scalar | 17.656 | 7 | .014 | −.002 | .000 | −.001 |
| Strict | 22.905 | 8 | .003 | −.002 | .000 | +.001 |
| Structural | 0.895 | 2 | .639 | .000 | +.001 | −.002 |
[i] Note. χ2 = chi-square statistic; df = degrees of freedom; CFI = Comparative Fit Index; TLI = Tucker–Lewis Index; RMSEA = Root Mean Square Error of Approximation. p (Model) refers to the overall model chi-square test; p (Δχ2) refers to the chi-square difference test between successive nested models. ΔCFI, ΔTLI, and ΔRMSEA represent changes relative to the preceding model. Models were estimated using maximum likelihood (ML), treating the six-category items as continuous variables.
Convergent Validity
The convergent validity of the EBS-8 was assessed using the Depression, Anxiety, and Stress Scale (DASS-21) (See table 7). Significant negative correlations (p < .001) were found between the EBS-8 and the DASS-21 dimensions (Depression, Anxiety, and Stress). Specifically, the EBS-8 showed a moderate negative correlation with Depression (r = −0.471), Anxiety (r = −0.360), and Stress (r = −0.371). The DASS-21 subscales were strongly correlated with one another. Depression correlated with anxiety (r = .745) and stress (r = .777), and anxiety with stress (r = .817). This pattern is consistent with the well-documented overlap among the three negative-affect dimensions. These dimensions provided the expected criterion for evaluating the convergent validity of the EBS-8. EBS-8 scores were negatively associated with all three DASS-21 subscales, in line with the expectation that higher subjective well-being co-occurs with lower distress. Taken together with the internal coherence of the DASS-21, these results support the convergent validity of the EBS-8.
Discussion
This study provides evidence supporting the psychometric adequacy of the Subjective Well-Being Scale (EBS-8) in Chilean adults, including configural and metric invariance across gender, while identifying some uncertainty at the scalar and strict levels. The evidence positions the instrument as a culturally adequate and reliable tool for assessing well-being in this population. Its brevity reduces response burden without an apparent loss of measurement precision, which is useful for large-scale assessment in adults.
Both exploratory and confirmatory analyses converged on a unidimensional structure, with all items loading substantially on a single latent dimension. This result replicates the structure reported in the original validation and extends it to a Chilean adult sample (Calleja et al., 2022). The convergence of the cognitive and affective components into a single factor has theoretical implications. In demanding settings (work/university), adults may not clearly separate global life satisfaction from day-to-day affect, as cognitive appraisals of their situation are closely tied to their emotional experience. This unidimensional formulation differentiates the EBS-8 from instruments such as the Satisfaction with Life Scale (SWLS) (Diener et al., 2018), which addresses only the cognitive component. By covering both components in eight items, the EBS-8 offers a more integrated measure of adults who work and/or study. The first factor accounted for 88.63% of the variance before extraction and 87.06% of the variance after extraction using Principal Axis Factoring. This figure exceeds the 50% threshold commonly cited as a reference in scale development (Hair, 2025).
Internal consistency was high, with Cronbach’s alpha of .981 and McDonald’s omega of .983 (Madadizadeh & Bahariniya, 2025). These values indicate a coherent measurement of a single construct. Corrected item-total correlations ranged from .844 to .956, indicating that each item is closely related to the construct. Item-deletion analyses showed that removing Item 8 would increase Cronbach’s alpha only slightly, from .981 to .983, whereas removing the remaining items did not improve reliability. The eight-item configuration, therefore, appears appropriate for preserving the scale's precision.
The confirmatory factor analysis supported the unidimensional structure, with adequate model fit (χ2(20) = 93.924, p < .001; χ2/df = 4.70; CFI = .989; TLI = .985; NFI = .986; RMSEA = .081 [90% CI: .065, .098]; SRMR = .011). Taken together, these results provide strong evidence of the structural validity of the EBS-8, although the RMSEA value—which is slightly above the conventional threshold of .08—suggests that the model fit should be considered generally acceptable rather than uniformly excellent. The assessment of measurement invariance by gender is one of the main contributions of this study. Multigroup analyses provided strong evidence of configural and metric invariance, supporting the equivalence of the factor structure and factor loadings of the EBS-8 between men and women. In the scalar and strict invariance models, statistically significant differences were identified using chi-square difference tests, indicating that the inclusion of additional constraints produced detectable changes in model fit. However, the changes in the incremental and absolute fit indices were small (|ΔCFI| ≤ .002; |ΔRMSEA| ≤ .008) and remained within the conventional criteria proposed for assessing measurement invariance (Chen, 2007). These findings suggest favorable psychometric equivalence between men and women, although the evidence is not entirely consistent across the different statistical criteria. Consequently, comparisons of latent means between the two groups should be interpreted with caution, and it would be advisable for future research to examine the stability of these results in independent samples (Chen, 2007).
Examining the scale within an established nomological network provided further evidence of its convergent validity. The EBS-8 was negatively associated with established markers of psychological distress. Higher subjective well-being was associated with lower depression (r = –.471), anxiety (r = –.360), and stress (r = –.371), all significant at p < .001. These moderate negative associations are in line with theoretical models. Higher well-being co-occurs with lower distress. This pattern is consistent with Fredrickson’s broaden-and-build model (Fredrickson, 1998). Although these associations are consistent with theoretical perspectives emphasizing the role of positive psychological functioning, the cross-sectional design does not allow us to determine whether higher subjective well-being protects against subsequent psychological distress. Occupational and academic demands can both constitute sustained sources of stress throughout adulthood. Adults who work may experience job insecurity, workload, limited autonomy, and financial pressures, whereas adults engaged in formal education may face assessment demands, academic competition, and challenges balancing study with employment or family responsibilities. More broadly, contextual adversity and perceived socioeconomic disadvantage have been associated with lower subjective well-being and greater psychological distress across adult populations (Kaniasty et al., 2024; Muhammad et al., 2021). In this context, the EBS-8 could contribute to the assessment of subjective well-being in adult populations and facilitate the study of its associations with psychological, academic, and occupational variables. However, the results of this research do not allow us to establish its ability to individually identify people at clinical risk or to determine the need for psychological intervention.
Validation of the EBS-8 in this population has practical value across clinical, community, occupational, educational, and public-health settings. By reducing the original 20-item instrument to eight items, the EBS-8 offers a substantially shorter assessment format that may reduce respondent burden and facilitate its inclusion in broader assessment protocols and repeated well-being monitoring. This brevity may be particularly valuable for reaching heterogeneous adult groups, including older adults and people who balance employment, study, caregiving, household duties, and health-related demands, for whom lengthy questionnaires may be less feasible.
The evidence of configural and metric invariance across gender supports the potential utility of the EBS-8 for assessing subjective well-being in men and women. Nevertheless, the discrepancies observed at the scalar and strict levels indicate that comparisons of group means should be interpreted with caution. Further studies are needed to establish the robustness of measurement equivalence and the suitability of the instrument for individual-level decision-making. The scale’s negative association with markers of distress also complements existing screening tools. Standard screening protocols typically rely on deficit models centered on detecting symptoms. The EBS-8 complements this approach by assessing positive functioning rather than only the absence of symptoms (Gregory & Rutledge, 2016; Seligman, 2019). Combining this positive measure with standard deficit-based inventories provides a more complete framework for monitoring mental health and well-being across adult populations.
Strengths & Limitations
Limitations
Despite the favorable psychometric results, this study has several limitations. The use of non-probability snowball sampling limits the generalizability of the findings to other populations and contexts. The cross-sectional design prevents causal inferences about changes in well-being over time. Reliance on self-report measures also makes the data susceptible to social desirability bias.
Furthermore, this study did not examine the diagnostic accuracy, sensitivity, specificity, clinically validated cut-off points, or predictive validity of the EBS-8. The five descriptive score ranges presented in the appendices were proposed by the authors based on the theoretical scoring range and were not empirically calibrated or validated against population norms or external criteria. Accordingly, they should not be used for diagnostic classification, clinical risk identification, or decisions regarding psychological intervention. Future research should evaluate these properties and establish empirically supported interpretive thresholds before considering individual screening or classification applications.
Additionally, although changes in the fit indices provided favorable evidence of measurement invariance between men and women, chi-square difference tests identified statistically significant differences at the scalar and strict levels. This discrepancy limits the ability to draw definitive conclusions about the complete equivalence of the instrument between the two groups. Furthermore, confirmatory factor analyses were conducted using maximum likelihood estimation, treating the items in the six categories as continuous variables. Future studies should examine the robustness of these results using estimators appropriate for ordinal data.
Future studies should use longitudinal and probability-based designs to examine the stability and sensitivity of the EBS-8 across different stages of adulthood. Additional research should also test measurement invariance across age groups, educational levels, employment status, and student versus non-student adults.
Finally, future research could examine the feasibility and usefulness of incorporating the EBS-8 into digital platforms, community programs, workplace wellness initiatives, and population-based monitoring studies. These applications should initially focus on assessing subjective well-being rather than on diagnostic classification or the identification of individual clinical risk, until additional evidence supporting such uses becomes available.
Strengths
This study has several methodological strengths. A total sample of 861 participants was used, which was subsequently divided into two mutually exclusive analytical subsamples (n = 299 and n = 562), intended respectively for exploratory factor analysis (EFA) and confirmatory factor analysis (CFA). This strategy allowed us to first examine the factor structure of the instrument and then evaluate the model fit in a different set of participants, thereby avoiding the use of the same data in both analytical stages, reducing the risk of capitalizing on chance, and providing a more rigorous assessment of the stability of the proposed factor structure. The formal assessment of measurement invariance across gender constitutes an additional methodological strength. The findings supported configural and metric invariance between men and women, although the mixed evidence at the scalar and strict levels warrants caution when interpreting group mean differences.
In addition, the EBS-8 was validated within the specific cultural context of Chilean adults, increasing the local relevance of the evidence. Reliability was evaluated with complementary indices (Cronbach’s alpha and McDonald’s omega), and construct validity was supported through convergent evidence with the DASS-21. Together, these methodological features strengthen confidence in the psychometric conclusions.
Practical Value
The psychometric evaluation of the EBS-8 has potential practical and social value. By providing evidence on a brief measure of subjective well-being in Chilean adults, this study contributes to the development of feasible assessment approaches for community, occupational, educational, and public-health research. Its eight-item format may reduce response burden and facilitate the assessment and monitoring of subjective well-being. As a supplementary practical contribution, the appendices provide five author-proposed descriptive score ranges—very low, low, moderate, high, and very high—intended to facilitate the presentation and communication of EBS-8 scores in nonclinical contexts. These ranges have not been empirically validated and should not be interpreted as population norms or clinical cut-off points. Accordingly, the present findings do not establish the instrument's suitability for clinical screening, individual risk classification, or decisions regarding psychological intervention. Furthermore, comparisons of group means across gender should be interpreted cautiously given the mixed evidence at the scalar and strict invariance levels.
At a broader level, the EBS-8 supports the systematic monitoring of employees’ and adult students’ well-being in Chile and, potentially, across Latin America, where comparable validated tools remain scarce. Such monitoring can inform the work of HR departments, university counseling services, and the design of institutional and public policies aimed at protecting the mental health of workers and adult students.
Conclusions (and Future Work)
This study supports the EBS-8 as a psychometrically sound and culturally adequate instrument for measuring subjective well-being in Chilean adults. The items conformed to a unidimensional structure. This structure showed high internal consistency and adequate overall model fit. Convergent validity was supported by the expected negative associations of subjective well-being with depression, anxiety, and stress. Combining brevity with adequate psychometric properties, the EBS-8 is a suitable instrument for this population. The findings support further evaluation of the EBS-8 for non-diagnostic well-being assessment and monitoring in organizational and community settings. Future research should employ longitudinal and multi-institutional designs to examine its temporal stability, evaluate measurement invariance across additional groups, and explore the feasibility of incorporating the scale into institutional digital platforms for repeated assessment of subjective well-being.
Acknowledgments
The authors wish to thank all participants in this study and the institutions that facilitated data collection.
Notes
[13] Supported by Funding Statement
The authors declare that this research did not receive any specific grant from funding agencies in the public, commercial, or not-for-profit sectors. The publication fee was covered by the authors personally.
[14] Conflicts of interest Conflict of Interest
The authors declare that they have no conflicts of interest.
[15] Data availability statement
The datasets generated and analyzed during this study are held in institutional custody by Universidad Andrés Bello (Chile), under the research protocol approved by the University's Central Bioethics Committee (Registry No. 024/2022). De-identified data are available from the corresponding author upon reasonable request, subject to institutional ethical requirements and applicable confidentiality regulations.
[16] Contributed by Authors' Contributions
Jonathan Martínez-Líbano: Methodology, Formal Analysis, Data Curation, Writing – Original Draft Preparation, Writing – Review & Editing.
María-Mercedes Yeomans-Cabrera: Methodology, Formal Analysis, Data Curation, Writing – Original Draft Preparation, Writing – Review & Editing.
Angelo Andrés Rodríguez Oyarce: Writing – Review & Editing.
Catalina Genoveva Muñoz Strale: Writing – Review & Editing.
Miguel Ángel Albalá Genol: Writing – Review & Editing.
Raquel María Guevara Ingelmo: Writing – Review & Editing.
Guillermo Daniel Felipe Barahona-Fuentes: Writing – Review & Editing.
All authors have read and approved the final version of the manuscript.
[17] Accountability Statement:
All authors attest that they meet the academic criteria for authorship. All authors have read, critically revised, and approved the final manuscript, and agree to be accountable for all aspects of the work in ensuring that questions related to the accuracy or integrity of any part of the work are appropriately investigated and resolved.
Appendices
Appendix A
Español: Escala de Bienestar Subjetivo (EBS-8)
Instrucciones: A continuación, encontrará una serie de afirmaciones relacionadas con cómo evalúa su vida en general. Por favor, lea cada enunciado con atención e indique en qué medida está de acuerdo con cada uno de ellos, considerando cómo se ha sentido últimamente. No existen respuestas correctas o incorrectas; responda de manera honesta, marcando la alternativa que mejor represente su opinión.
Escala de respuesta: 1 = Totalmente en desacuerdo; 2 = En desacuerdo; 3 = Ligeramente en desacuerdo; 4 = Ligeramente de acuerdo; 5 = De acuerdo; 6 = Totalmente de acuerdo.
| Ítem | 1 TD | 2 D | 3 LD | 4 LA | 5 A | 6 TA |
|---|---|---|---|---|---|---|
| 1. Me gusta mi vida. | ◯ | ◯ | ◯ | ◯ | ◯ | ◯ |
| 2. Soy una persona feliz. | ◯ | ◯ | ◯ | ◯ | ◯ | ◯ |
| 3. Estoy satisfecho(a) con mi vida. | ◯ | ◯ | ◯ | ◯ | ◯ | ◯ |
| 4. Mi vida me trae alegría. | ◯ | ◯ | ◯ | ◯ | ◯ | ◯ |
| 5. Mi vida es feliz. | ◯ | ◯ | ◯ | ◯ | ◯ | ◯ |
| 6. Disfruto de mi vida. | ◯ | ◯ | ◯ | ◯ | ◯ | ◯ |
| 7. Mi vida es maravillosa. | ◯ | ◯ | ◯ | ◯ | ◯ | ◯ |
| 8. Estoy “de buenas”. | ◯ | ◯ | ◯ | ◯ | ◯ | ◯ |
Interpretación: La puntuación total de la EBS-8 se obtiene sumando las respuestas de los ocho ítems, con un rango posible de 8 a 48 puntos. Las puntuaciones más altas indican mayor bienestar subjetivo. Para facilitar la interpretación descriptiva de los resultados, se proponen cinco niveles:
8 a 16 puntos: Bienestar subjetivo muy bajo.
17 a 24 puntos: Bienestar subjetivo bajo.
25 a 33 puntos: Bienestar subjetivo moderado.
34 a 41 puntos: Bienestar subjetivo alto.
42 a 48 puntos: Bienestar subjetivo muy alto.
Nota. Estos rangos constituyen una propuesta de interpretación descriptiva de las puntuaciones de la EBS-8. No representan puntos de corte clínicamente validados ni categorías de clasificación individual validadas empíricamente. Por lo tanto, no deben utilizarse para establecer diagnósticos, clasificar el riesgo clínico ni determinar necesidades individuales de intervención psicológica.
Appendix B
English: Subjective Well-Being Scale (EBS-8)
Instructions: Below are a series of statements related to how you evaluate your life in general. Please read each statement carefully and indicate to what extent you agree with each one, based on how you have been feeling lately. There are no right or wrong answers; please answer honestly by selecting the option that best represents your opinion.
Response scale: 1 = Strongly disagree; 2 = Disagree; 3 = Slightly disagree; 4 = Slightly agree; 5 = Agree; 6 = Strongly agree.
| Item | 1 SD | 2 D | 3 SDi | 4 SA | 5 A | 6 SAg |
|---|---|---|---|---|---|---|
| 1. I like my life. | ◯ | ◯ | ◯ | ◯ | ◯ | ◯ |
| 2. I am a happy person. | ◯ | ◯ | ◯ | ◯ | ◯ | ◯ |
| 3. I am satisfied with my life. | ◯ | ◯ | ◯ | ◯ | ◯ | ◯ |
| 4. My life brings me joy. | ◯ | ◯ | ◯ | ◯ | ◯ | ◯ |
| 5. My life is happy. | ◯ | ◯ | ◯ | ◯ | ◯ | ◯ |
| 6. I enjoy my life. | ◯ | ◯ | ◯ | ◯ | ◯ | ◯ |
| 7. My life is wonderful. | ◯ | ◯ | ◯ | ◯ | ◯ | ◯ |
| 8. I’m in a good mood. | ◯ | ◯ | ◯ | ◯ | ◯ | ◯ |
Interpretation: The total EBS-8 score is obtained by adding the responses to the eight items, with a possible range of 8 to 48 points. Higher scores indicate greater subjective well-being. To facilitate the descriptive interpretation of the results, five levels are proposed:
8 to 16 points: Very low subjective well-being.
17 to 24 points: Low subjective well-being.
25 to 33 points: Moderate subjective well-being.
34 to 41 points: High subjective well-being.
42 to 48 points: Very high subjective well-being.
Note. These ranges constitute a proposed descriptive interpretation of the EBS-8 scores. They do not represent clinically validated cut-off points or empirically validated individual classification categories. Therefore, they should not be used to establish diagnoses, classify clinical risk, or determine individual needs for psychological intervention.