

Figure 1
Screenshot of home page of Peoples-uni courses site.
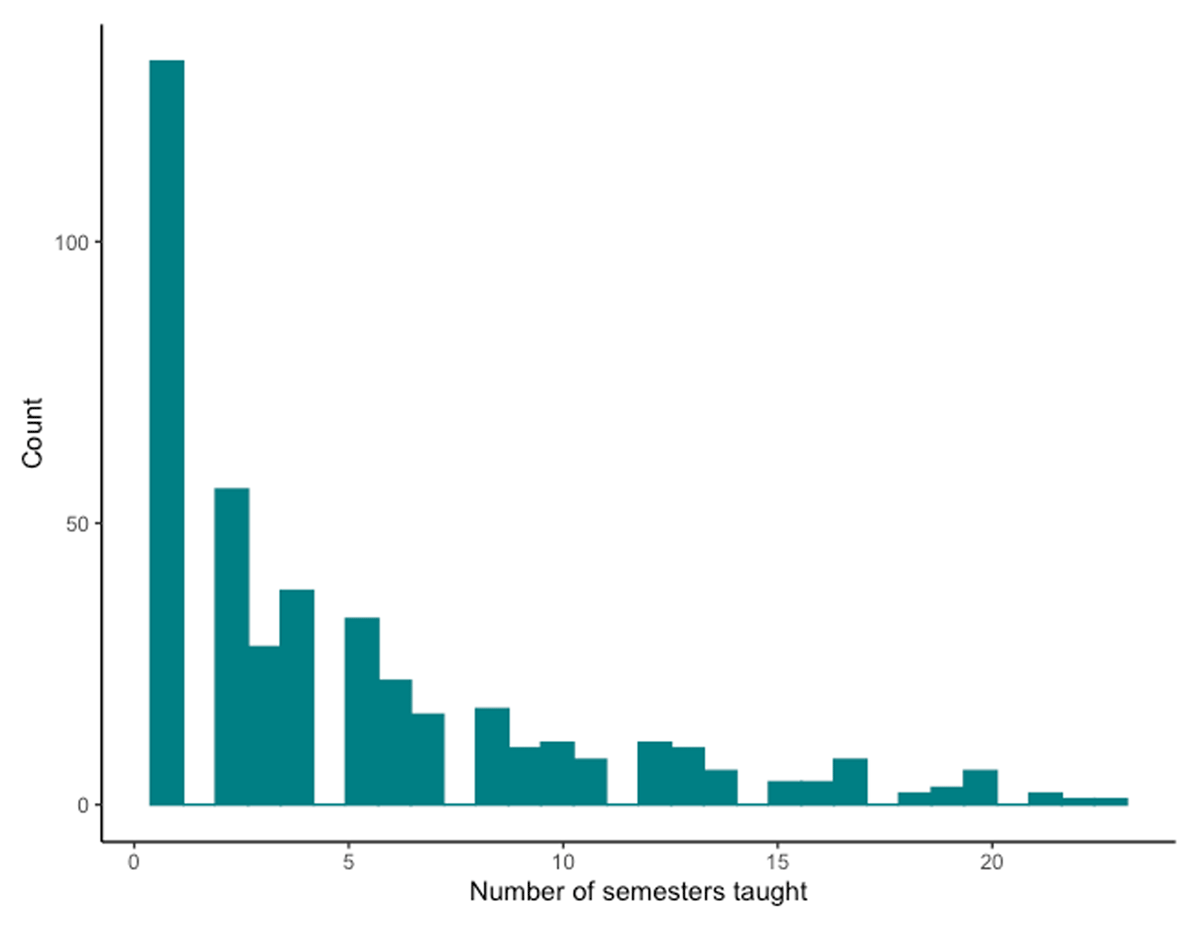
Figure 2
Distribution of number of semesters taught by each tutor.
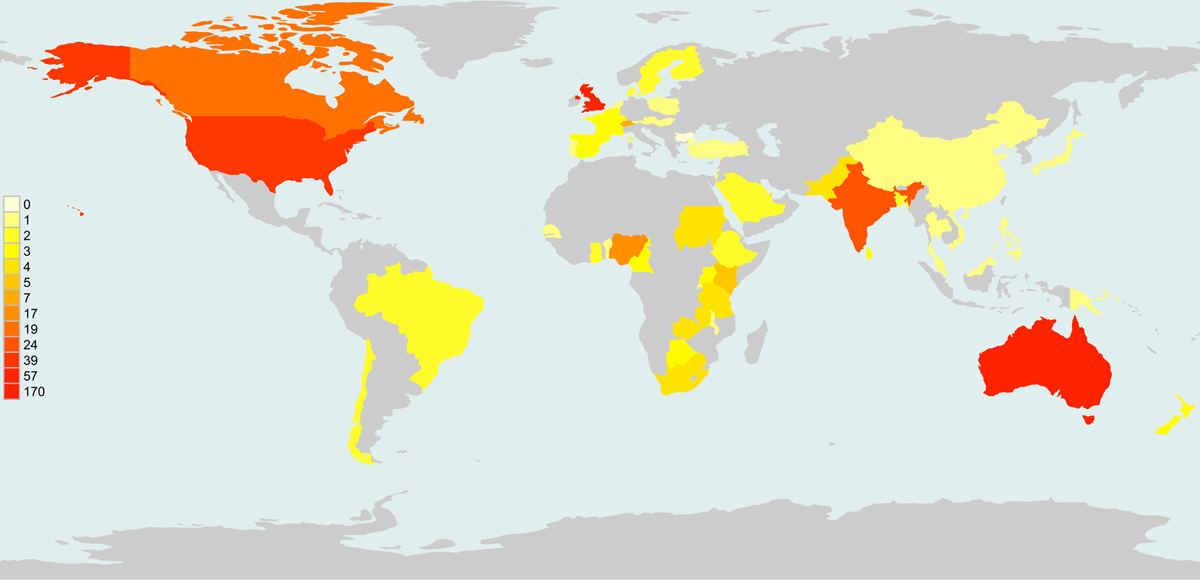
Figure 3
Geographical distribution of tutors.
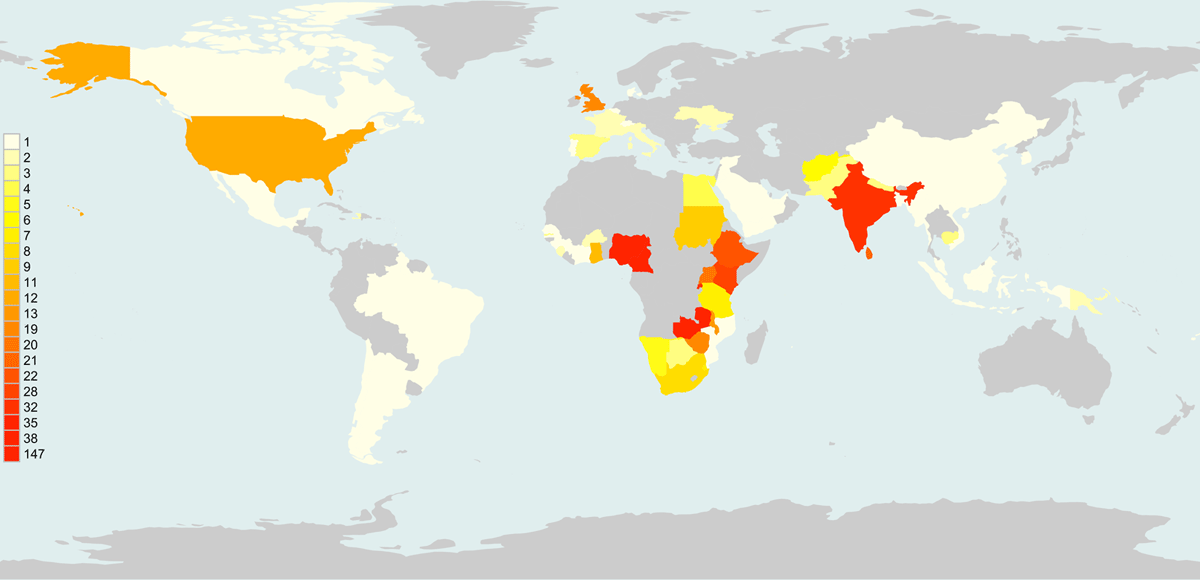
Figure 4
Geographical distribution of master’s students.
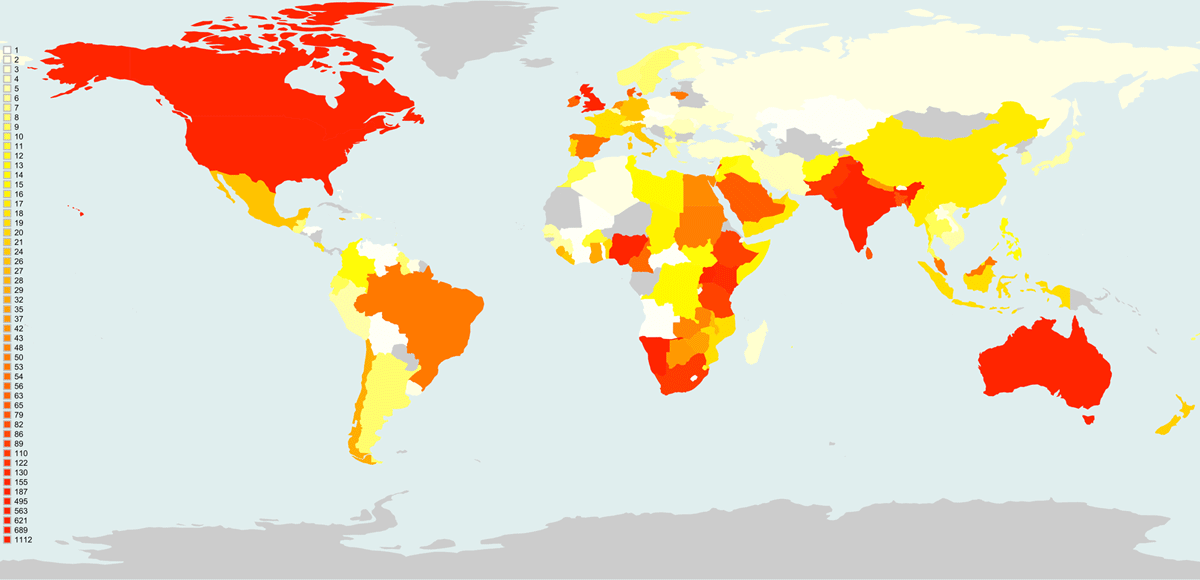
Figure 5
Geographical distribution of enrolments on Open Online Courses.
Table 1
Comparison of geographical regions between students and tutors.
| REGION | MASTER’S STUDENTS N = 562 | TUTORSN = 429 | OPEN ONLINE COURSE STUDENTS N = 4259 |
|---|---|---|---|
| Africa | 424 (75%) | 39 (9%) | 1231 (29%) |
| S Asia | 69 (12%) | 36 (8%) | 576 (14%) |
| UK/Europe | 44 (8%) | 202 (47%) | 1040 (24%) |
| Australia/NZ/US/Canada | 13 (2%) | 128 (30%) | 978 (23%) |
[i] Note: Percentages are of those with data.