
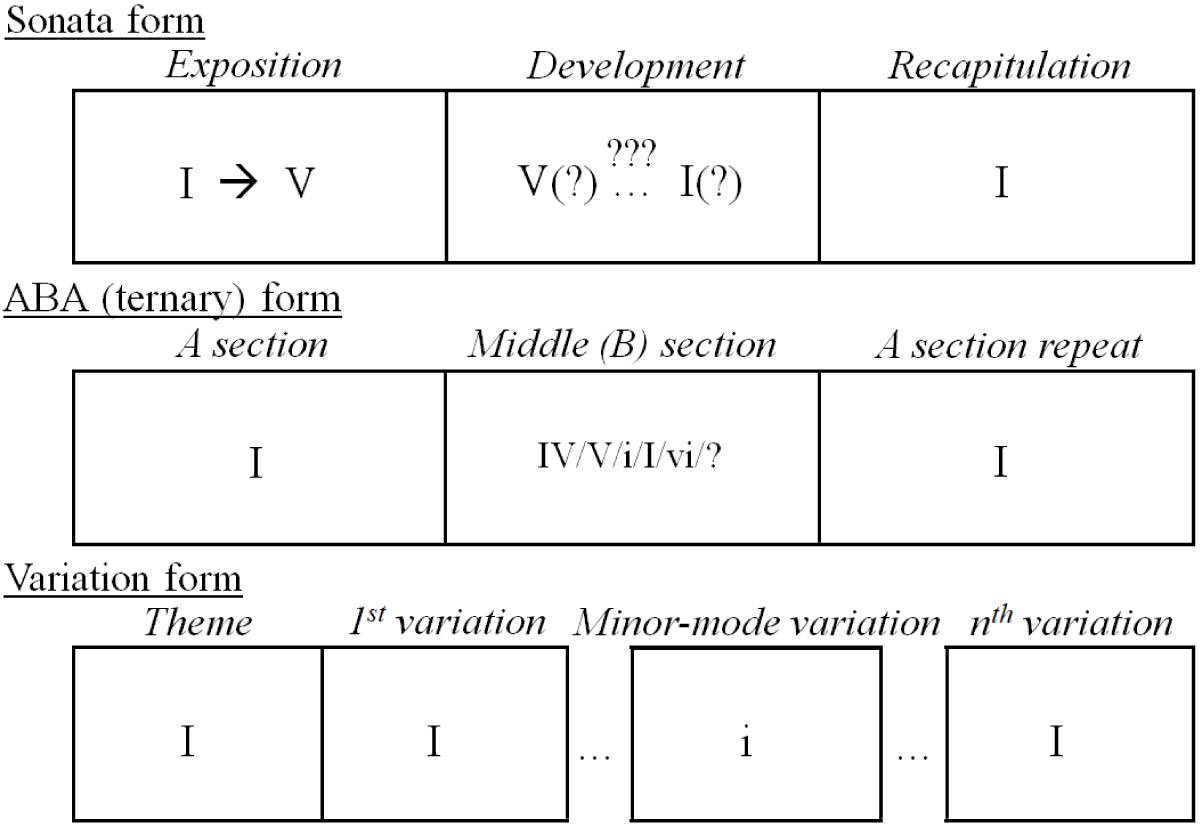
Figure 1
Standard formal and tonal layouts of sonata form, ABA (ternary) form, and variation form. The Roman numerals stand for keys associated with degrees of the home key, “I” representing the main key.
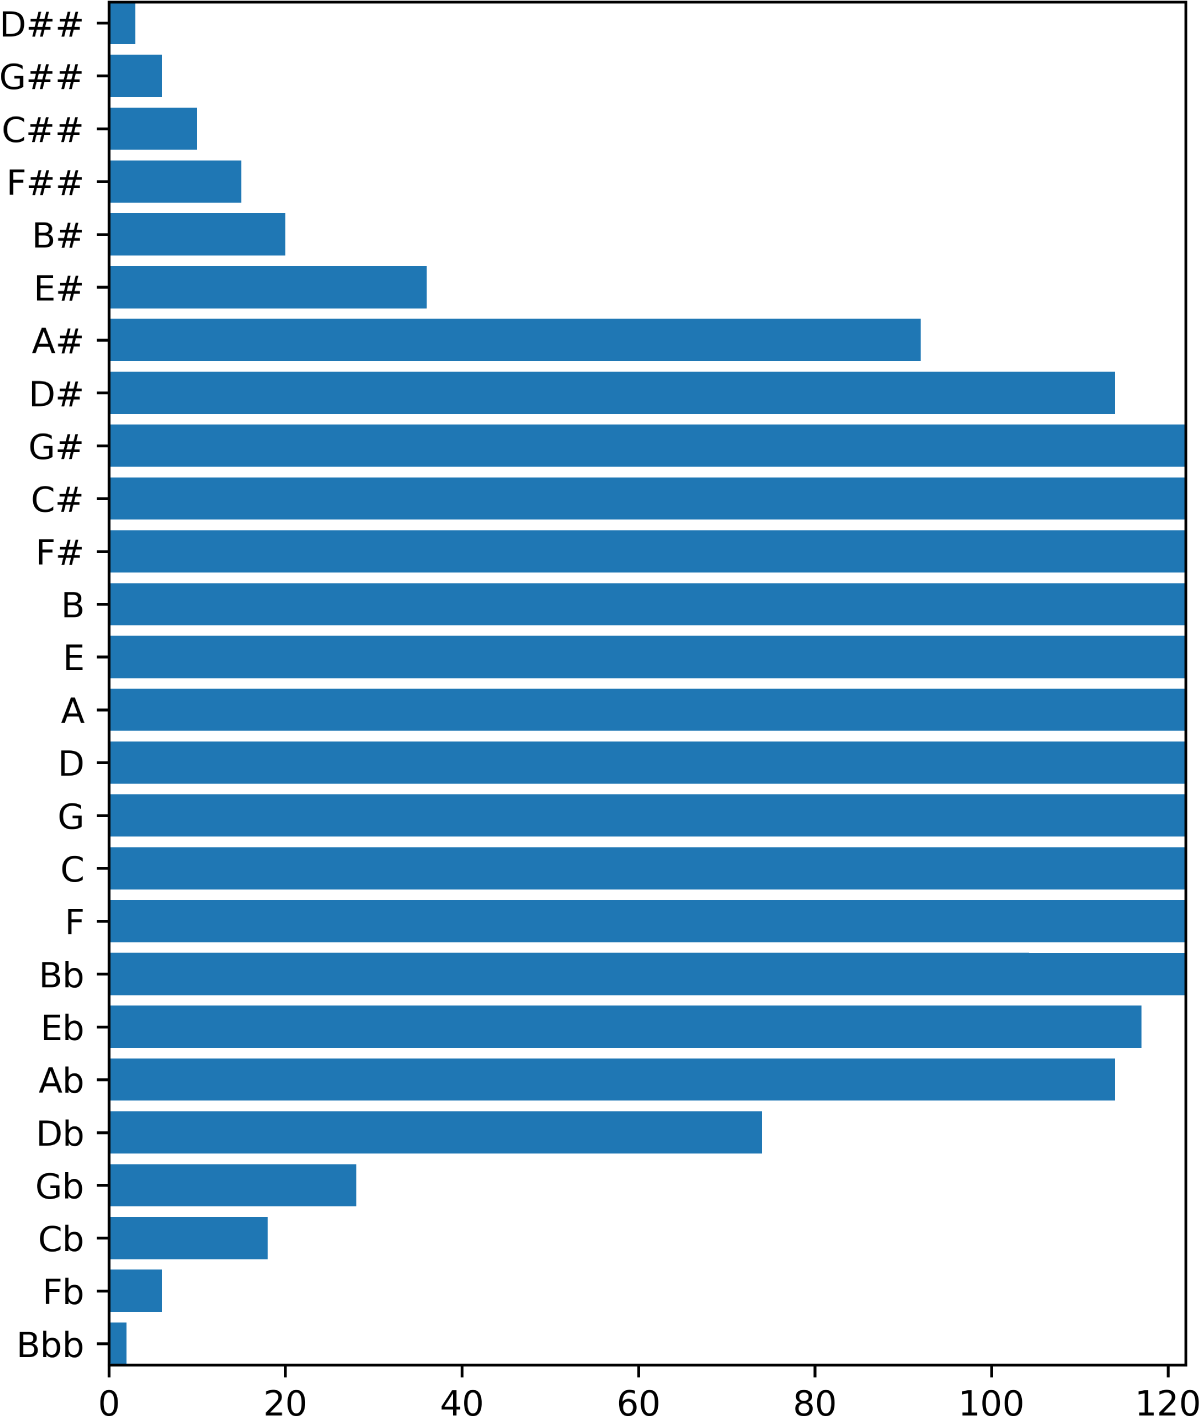
Figure 2
Count of pieces containing each of the 26 pitch spellings throughout the analyzed corpus, after a unifying transposition to C major. The dataset consists of 122 major-mode movements.
Table 1
The nine configurations of parameters used in the preprocessing. For each desired window size (as percentage of the piece’s size), three configurations were selected such that the number of sliding windows correspond with approximate overlaps of 50%, 70% and 90% between adjacent windows.
| Size | 10% | 15% | 20% |
|---|---|---|---|
| Overlap | |||
| ∼50% | 18 | 12 | 9 |
| ∼70% | 30 | 20 | 15 |
| ∼90% | 90 | 58 | 40 |
Table 2
A sample SVM classification confusion matrix for sliding-window data (for 18 windows of size 10%, C = 4).
| Actual | Sonata | ABA | Variations |
|---|---|---|---|
| Predicted | |||
| Sonata | 74 | 8 | 0 |
| ABA | 2 | 10 | 0 |
| Variations | 0 | 2 | 7 |
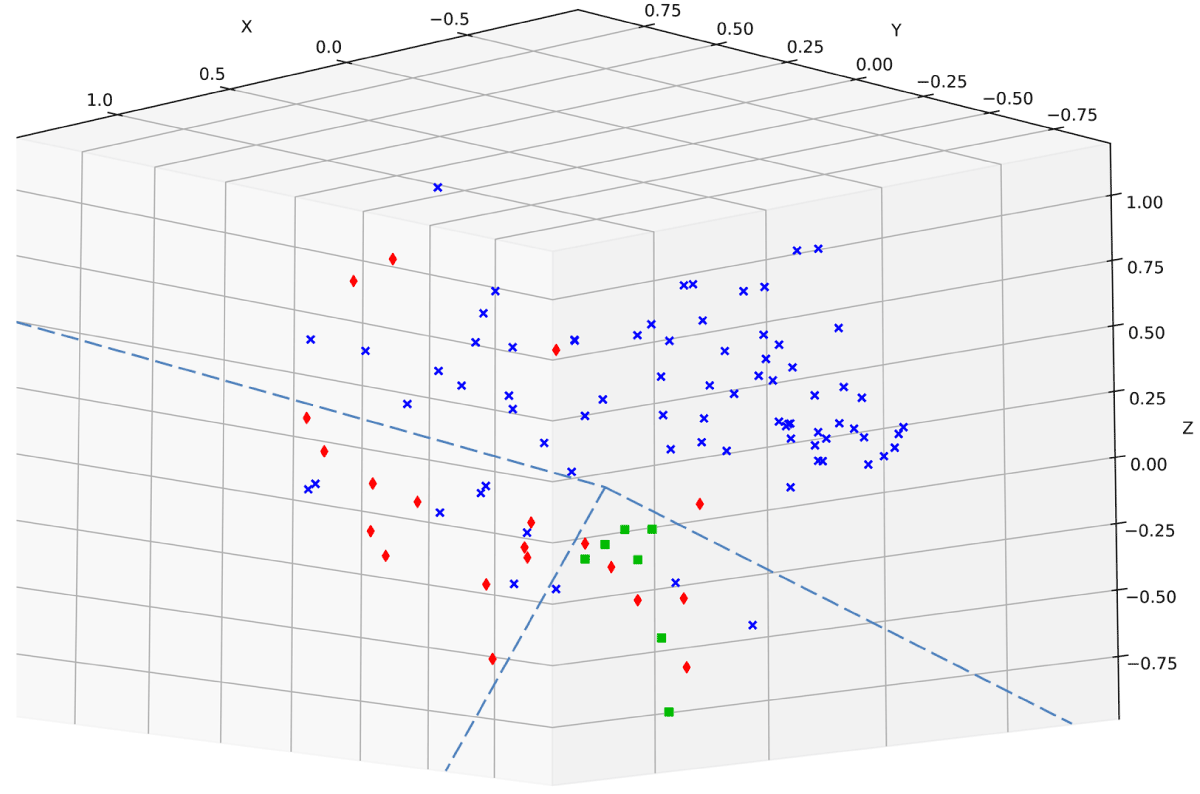
Figure 3
A 3D PCA visualization of the sliding-window data from all 103 labeled movements (blue crosses = sonata; red diamonds = ABA; green squares = variations). Dashed lines suggest possible separation.
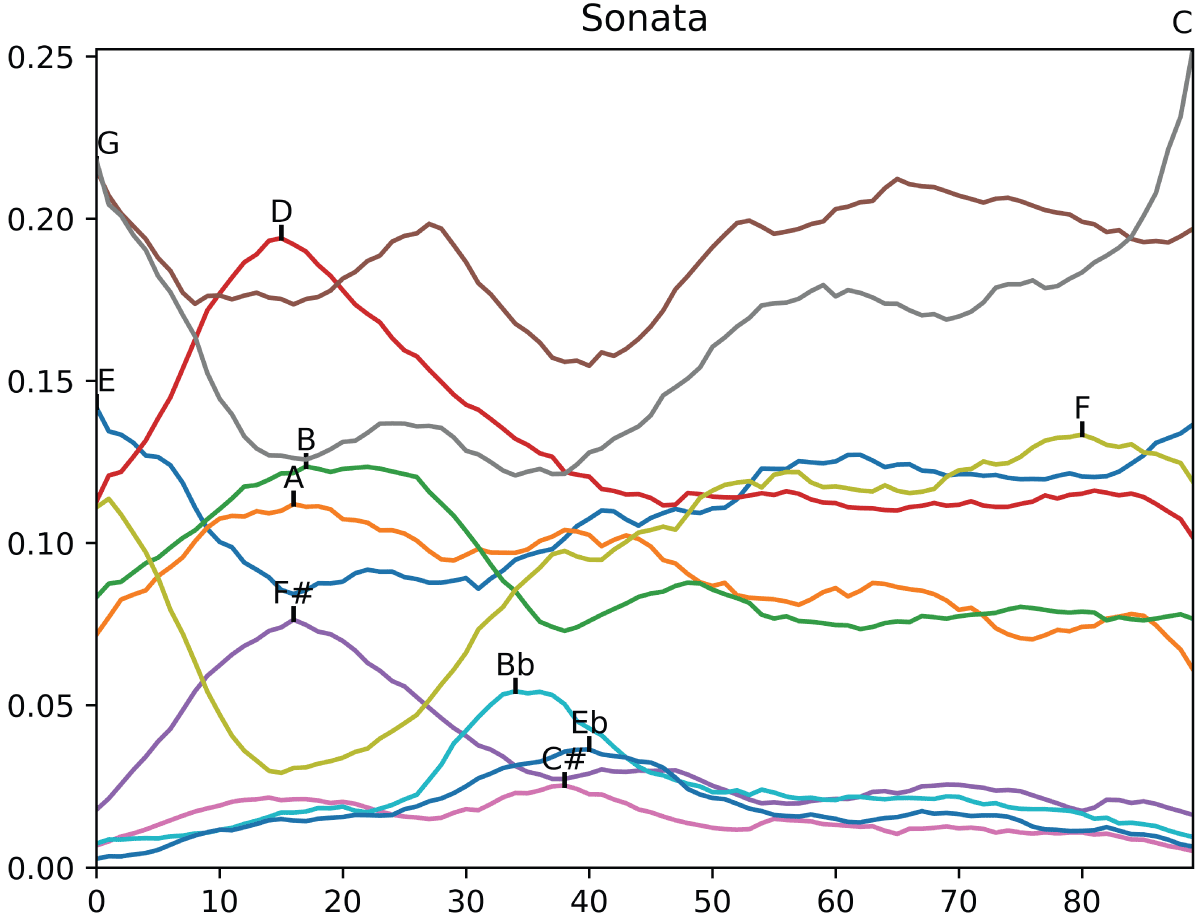
Figure 4
Development of selected pitch-class weights over time in sliding-window data averaged for all sonata movements of the corpus. Pitch names are placed above the relevant curve’s peak.
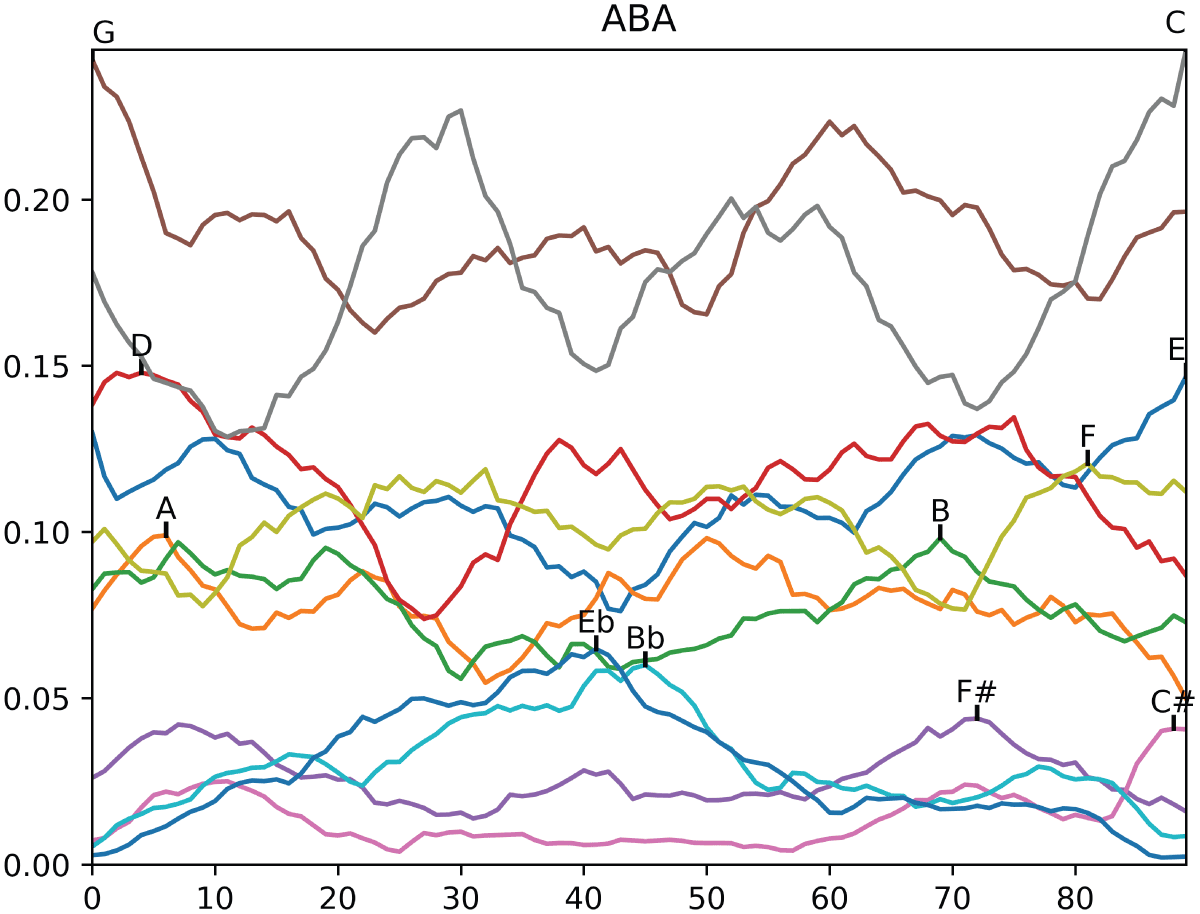
Figure 5
Development of selected pitch-class weights over time in sliding-window data averaged for all ABA movements of the corpus.
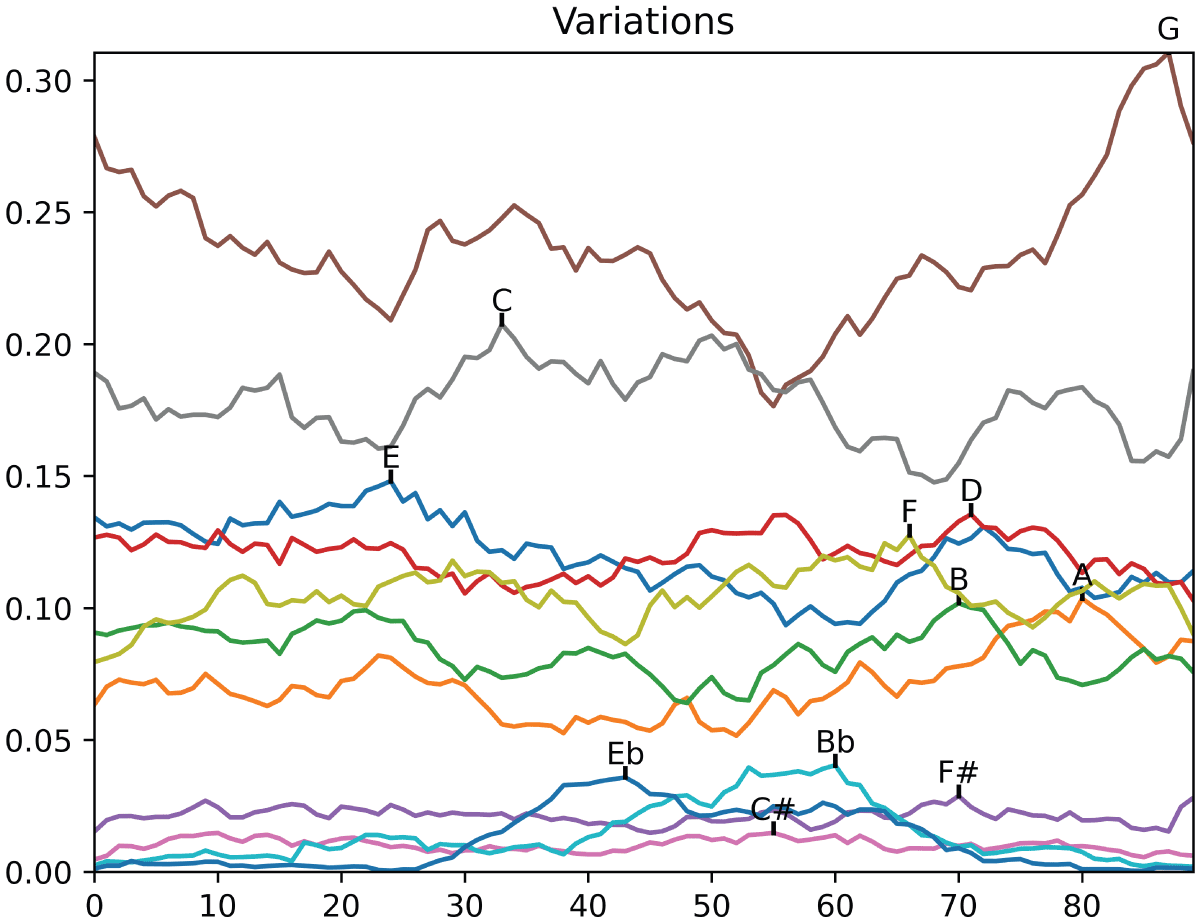
Figure 6
Development of selected pitch-class weights over time in sliding-window data averaged for all variation movements of the corpus.
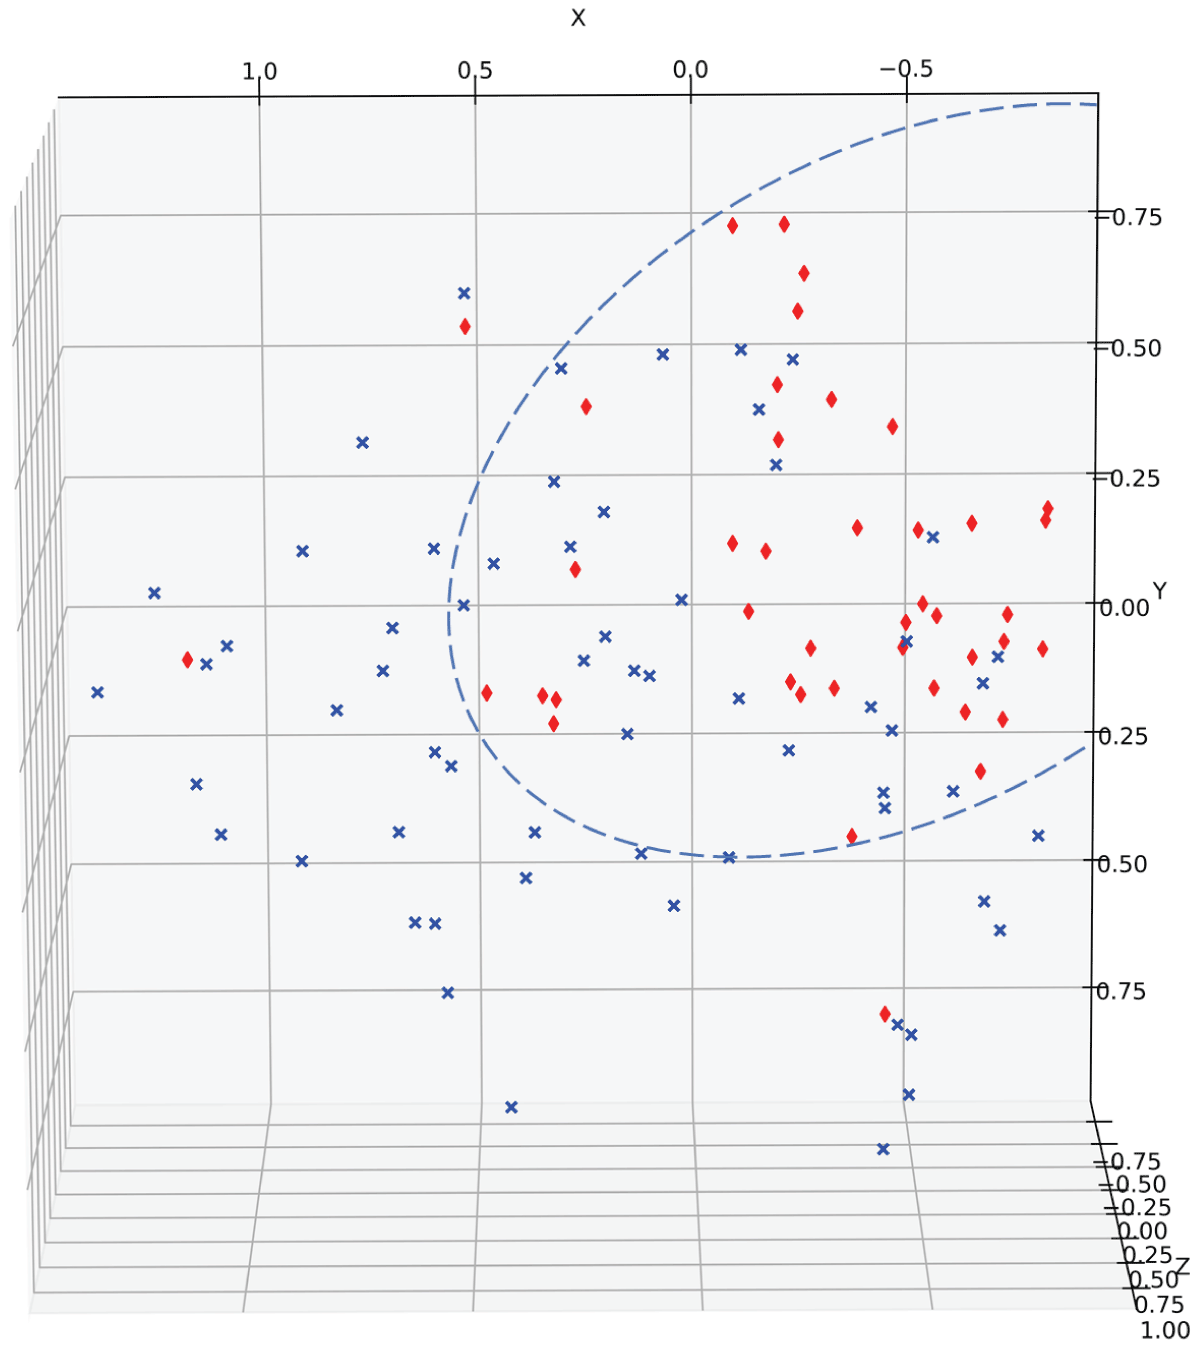
Figure 7
A 3D PCA composer-separated visualization of the sliding-window data from all 103 labeled movements (blue crosses = Beethoven; red diamonds = Mozart).