
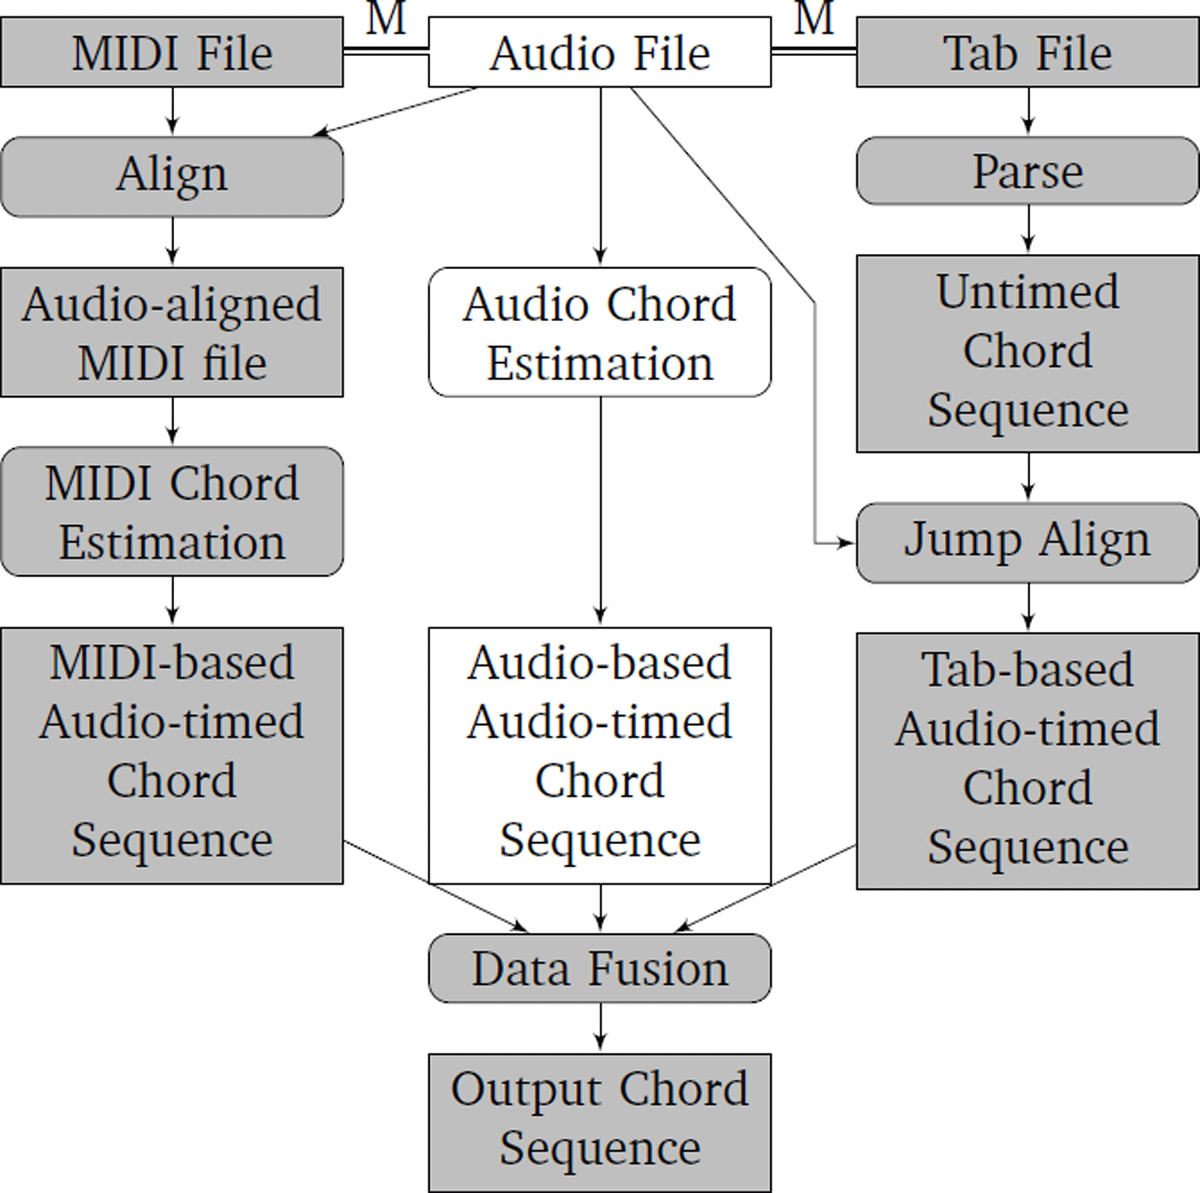
Figure 1
Diagram of DECIBEL’s framework. The M represents the matching between different representations of the same song. Data formats are depicted by rectangles; procedures are represented as rounded rectangles. The grey elements show how DECIBEL extends existing audio ACE methods.
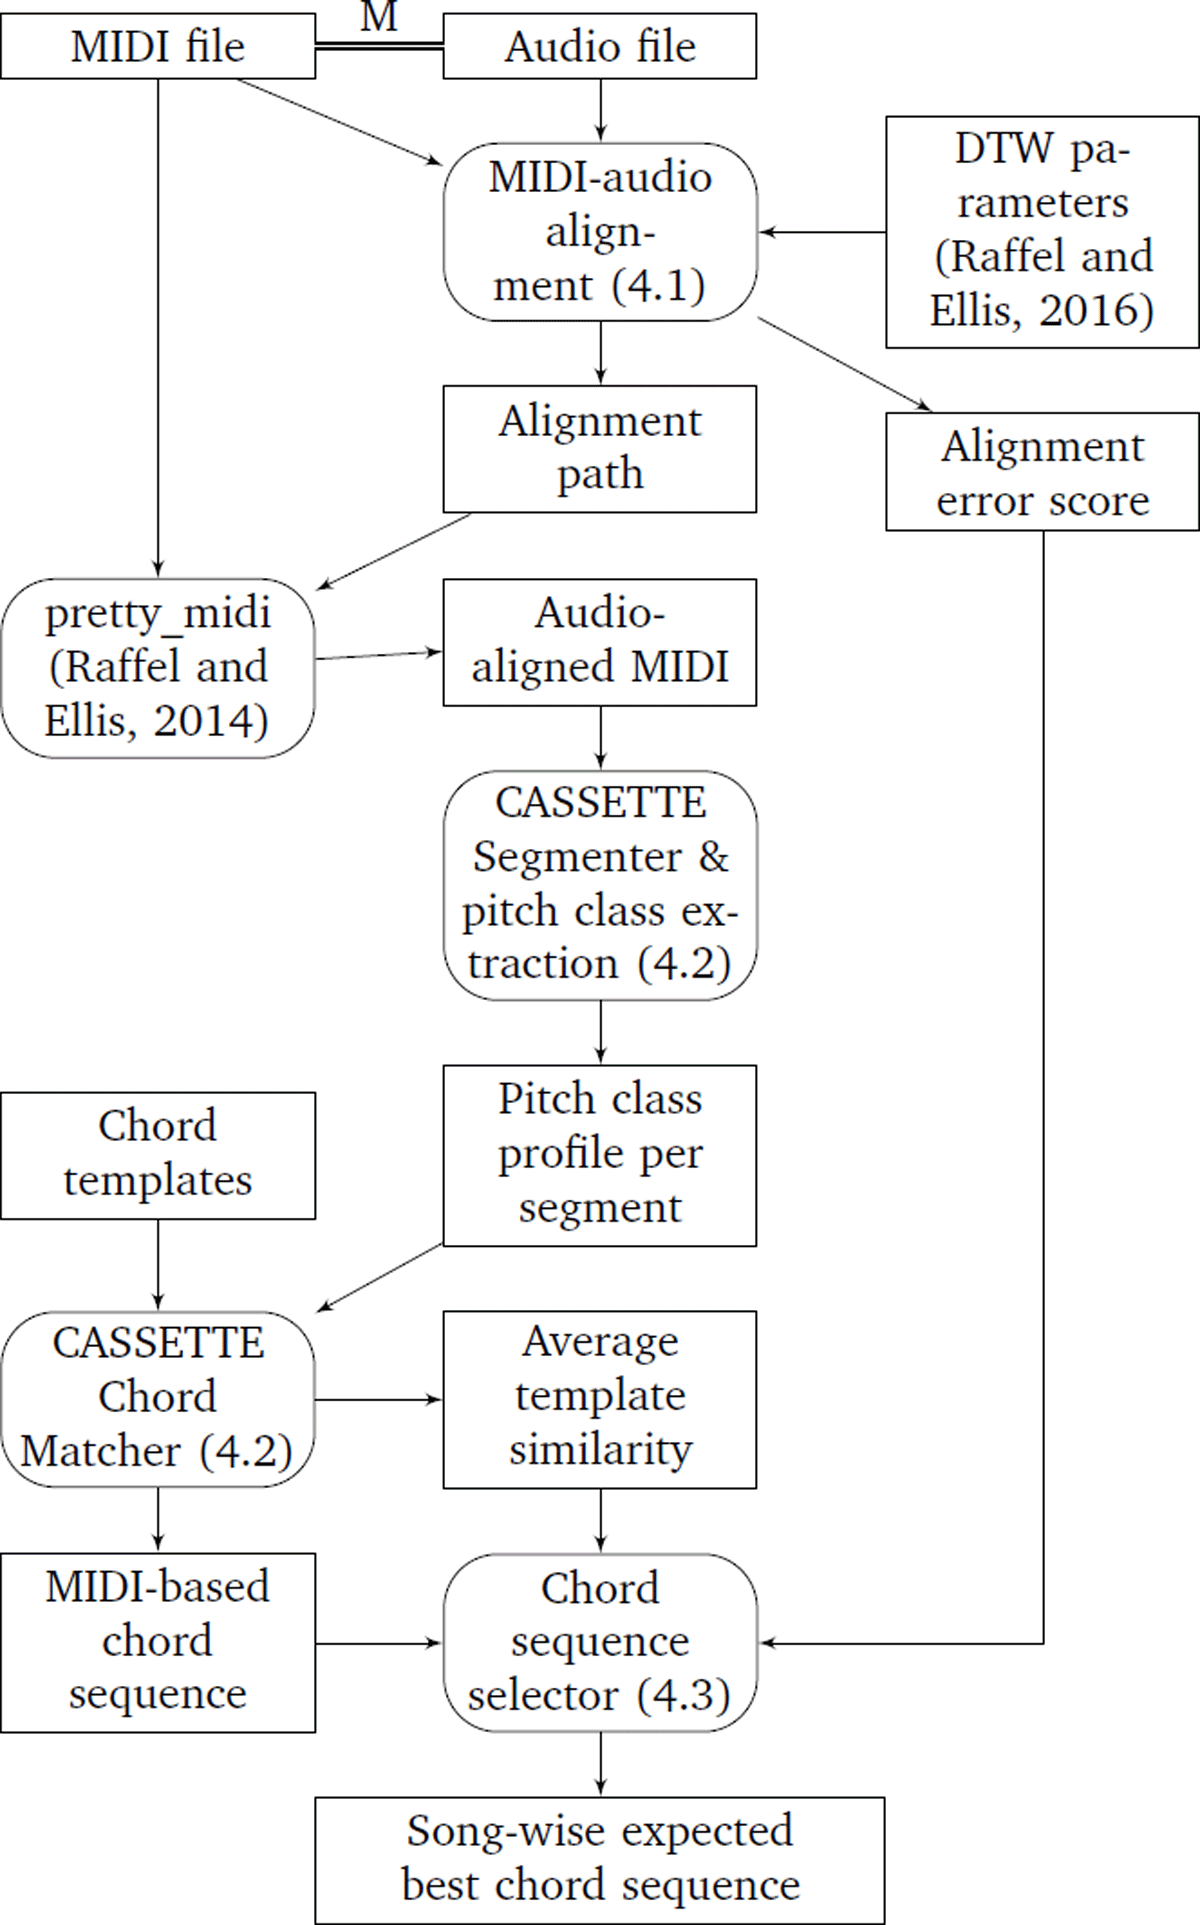
Figure 2
Diagram of DECIBEL’s MIDI subsystem. The M represents the matching between different representations of the same song. Data formats are depicted by rectangles; procedures are represented as rounded rectangles.
Table 1
Results of MIDI chord recognition for the 50 MIDI files with the lowest alignment error score, in terms of WCSR, oversegmentation (OvS), undersegmentation (UnS) and segmentation (Seg) as defined by Harte (2010).
| Segmentation | WCSR | OvS | UnS | Seg |
|---|---|---|---|---|
| Beat | 80.0% | 83.0% | 89.1% | 80.8% |
| Bar | 71.0% | 95.4% | 67.2% | 67.1% |
Table 2
Performance comparison of five MIDI file selection methods on the songs for which there was at least one well-aligned MIDI file in terms of WCSR, oversegmentation, undersegmentation and segmentation as defined by Harte (2010).
| WCSR | OvSeg | UnSeg | Seg | |||||
|---|---|---|---|---|---|---|---|---|
| Beat | Bar | Beat | Bar | Beat | Bar | Beat | Bar | |
| Min CSR | 46.3% | 44.9% | 76.4% | 89.7% | 75.5% | 62.0% | 66.6% | 61.1% |
| All (averaged) | 66.5% | 63.4% | 79.2% | 91.8% | 83.3% | 68.6% | 73.9% | 67.7% |
| Well-aligned (averaged) | 73.8% | 70.1% | 80.2% | 93.0% | 86.8% | 71.4% | 76.8% | 70.5% |
| Estimated best | 76.3% | 72.2% | 81.5% | 93.2% | 87.5% | 73.5% | 78.3% | 72.7% |
| Max CSR | 79.7% | 75.6% | 82.8% | 93.6% | 87.9% | 73.4% | 79.6% | 72.6% |
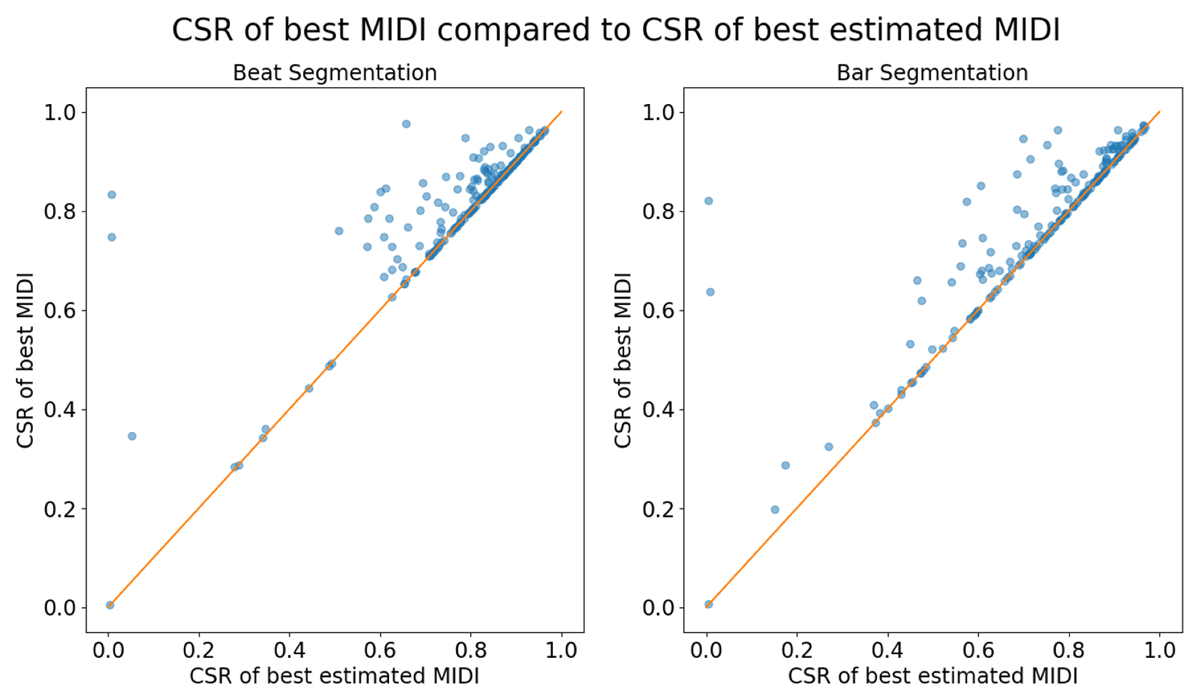
Figure 3
CSR of the real best MIDI file compared to the CSR of the estimated best MIDI file for both beat and bar segmentation. Points on the diagonal line (i.e. x = y) correspond to songs for which the best MIDI file was estimated correctly. The vertical distance between each point and the line is the difference between the CSR of the best MIDI file and the CSR of the estimated best MIDI file.
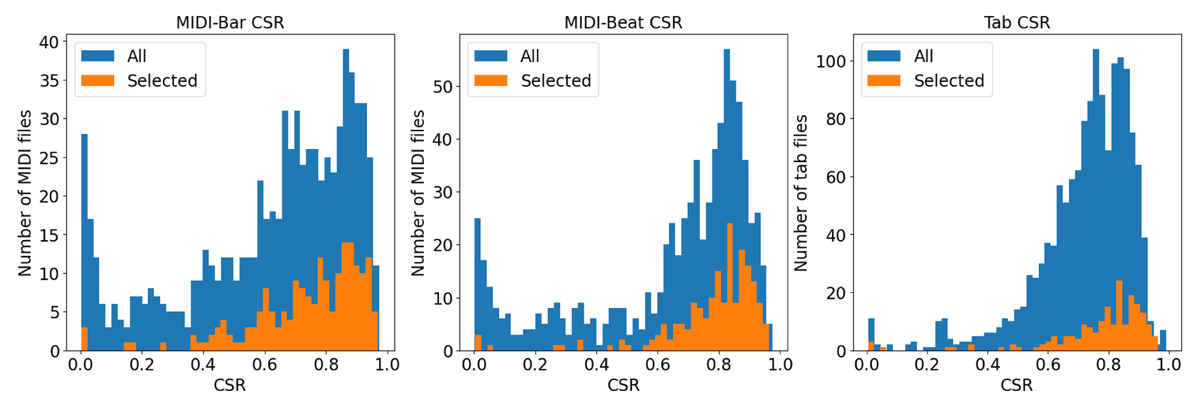
Figure 4
Histograms showing the distribution of CSR for: (Left) MIDI files with bar segmentation; (Centre) MIDI files with beat segmentation; and (Right) tab files.
Table 3
WCSR of all songs, with different tab file selection methods.
| WCSR | |
|---|---|
| Worst CSR of all tabs | 59.0% |
| Average CSR of all tabs | 72.2% |
| Best log-likelihood of all tabs | 75.0% |
| Best CSR of all tabs | 78.5% |
Table 4
WCSR of audio ACE systems and DF-BEST. Note that two of the 2017 systems were resubmitted in MIREX 2018 and one system was also resubmitted in 2019. The Improvement column shows the improvement from DF-BEST compared to the audio-only method, where significant improvements are shown in boldface. Using DF-BEST improves ACE WCSR on average by 4.03%.
| Audio ACE | MIREX | Audio WCSR | DF-ALL MIDI WCSR | DF-ALL Tab WCSR | DF-ALL WCSR | DF-BEST MIDI WCSR | DF-BEST Tab WCSR | DF-BEST WCSR | Improvement | DF-GT-BEST WCSR |
|---|---|---|---|---|---|---|---|---|---|---|
| CHF | – | 82.0% | 81.3% | 76.2% | 80.3% | 83.5% | 78.2% | 84.6% | 2.6% | 87.0% |
| CM2/CM1 | ’17–’19 | 75.7% | 80.4% | 75.9% | 79.7% | 80.9% | 76.6% | 81.6% | 5.9% | 85.0% |
| JLW1 | ’17 | 79.0% | 80.6% | 76.0% | 79.7% | 82.4% | 77.5% | 83.0% | 4.0% | 85.5% |
| JLW2 | ’17 | 78.5% | 80.6% | 76.0% | 79.7% | 82.2% | 77.3% | 82.7% | 4.2% | 85.3% |
| KBK1 | ’17 | 82.8% | 81.5% | 76.5% | 80.5% | 84.1% | 78.5% | 85.3% | 2.4% | 86.7% |
| KBK2/FK2 | ’17, ’18 | 87.3% | 81.9% | 76.6% | 80.9% | 86.6% | 81.0% | 87.9% | 0.5% | 89.2% |
| WL1 | ’17 | 79.9% | 80.8% | 75.9% | 79.8% | 82.5% | 77.3% | 83.4% | 3.6% | 85.6% |
| JLCX1 | ’18 | 86.3% | 81.4% | 76.1% | 80.3% | 85.8% | 80.7% | 87.2% | 0.9% | 89.2% |
| JLCX2 | ’18 | 86.5% | 81.4% | 76.1% | 80.4% | 85.8% | 80.7% | 87.1% | 0.6% | 89.2% |
| SG1 | ’18 | 79.5% | 80.9% | 76.2% | 80.2% | 82.1% | 76.5% | 83.8% | 4.3% | 86.1% |
| CLSYJ1 | ’19 | 77.3% | 80.3% | 75.6% | 79.6% | 81.6% | 75.6% | 83.0% | 5.7% | 85.6% |
| HL2 | ’20 | 67.2% | 79.9% | 75.9% | 79.8% | 76.0% | 67.3% | 80.8% | 13.6% | 84.2% |
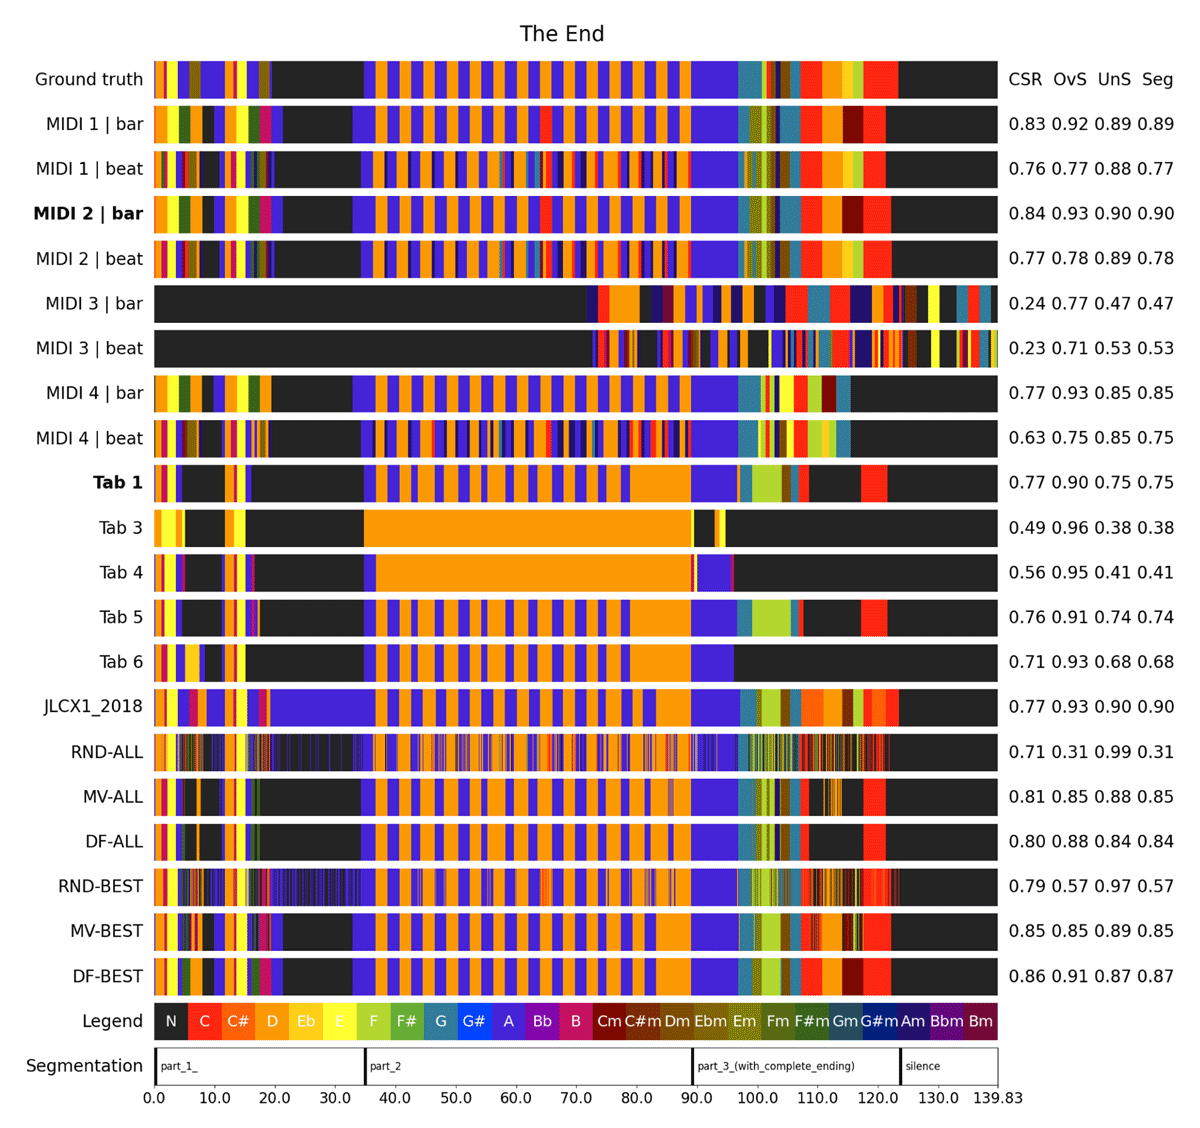
Figure 5
Visualisation of harmonic representation. The expected best MIDI file based on the average template similarity is MIDI 2 with bar segmentation (shown in boldface); the expected best tab file (based on log-likelihood) is Tab 1. In this song, the audio method (JLCX1) was unable to correctly classify the percussive section between 19.6 and 24.8s, whereas DF-BEST uses information from the MIDI and tab files to classify this as a no-chord. Also note that DF-BEST performs better than each of the individual sources (MIDI 2 bar, Tab 1 and JLCX1_2018).
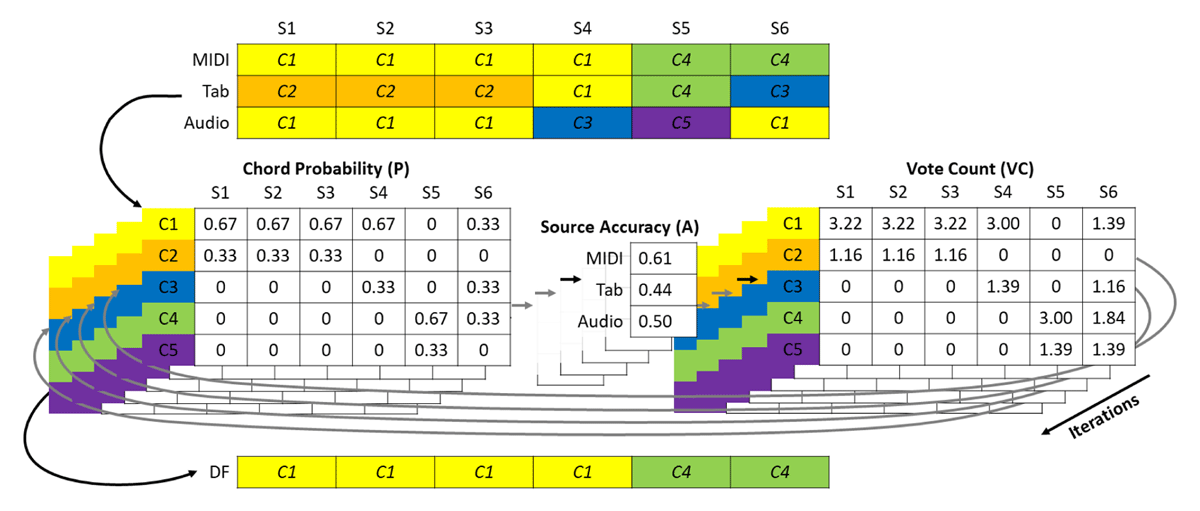
Figure 6
Toy example illustrating the data fusion procedure for a song consisting of six segments (S1 to S6). The input for the data fusion step consists of three sources: a MIDI, a tab and an audio file. In this example, we have a chord vocabulary of five chords (C1 to C5). First, the probability of each chord in each segment is computed. From this matrix, the source accuracies of the MIDI, tab and audio files are calculated. Then the computation of vote counts for each chord-segment pair is based on these source accuracies. After iterating these three steps, the result of data fusion is obtained by assigning the chord with the highest chord probability to each segment.
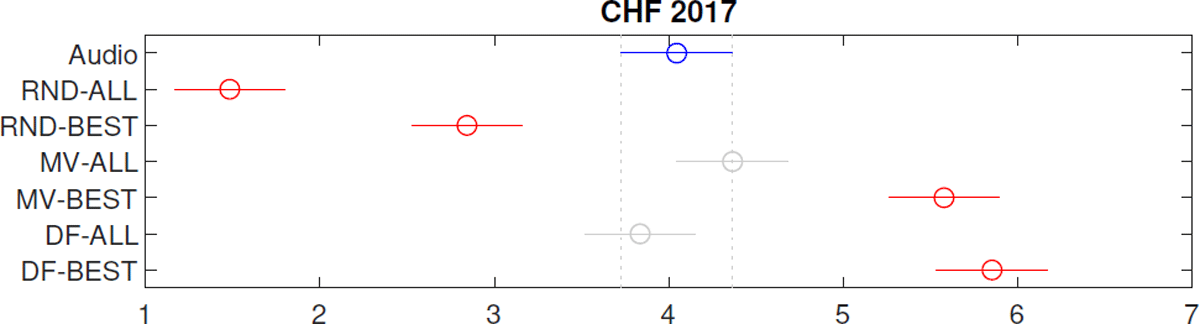
Figure 7
Visual representation of the differences in terms of Chord Symbol Recall between different data fusion methods, for the CHF audio ACE algorithm. For each pair of horizontal lines that do not overlap, the difference in CSR between the corresponding data fusion methods is significant. For example, DF-BEST is significantly better than DF-ALL, but the difference between DF-BEST and MV-BEST is not significant.
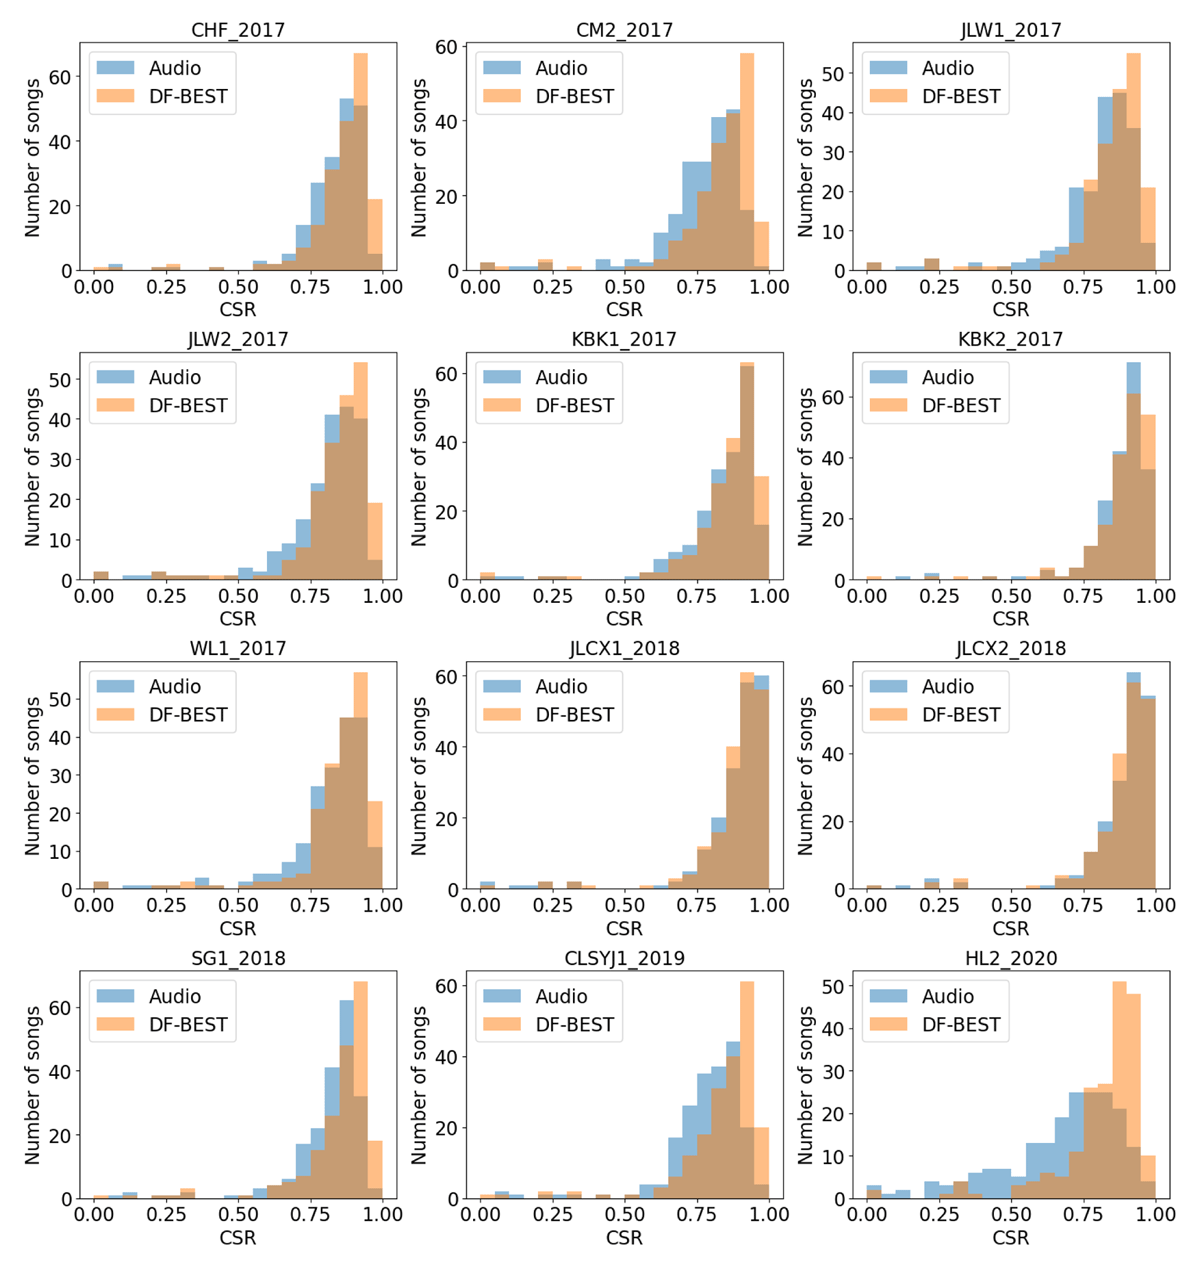
Figure 8
Distribution of Audio CSR and DF-BEST WCSR. For the audio algorithms CHF, CM2, JLW1, JLW2, KBK1, WL1, SG1, CLSYJ1 and HL2 the improvement is evident. No significant improvement was found for the algorithms JLCX1 and JLCX2. For KBK2, the improvement is mainly in the songs that already have a high CSR.