
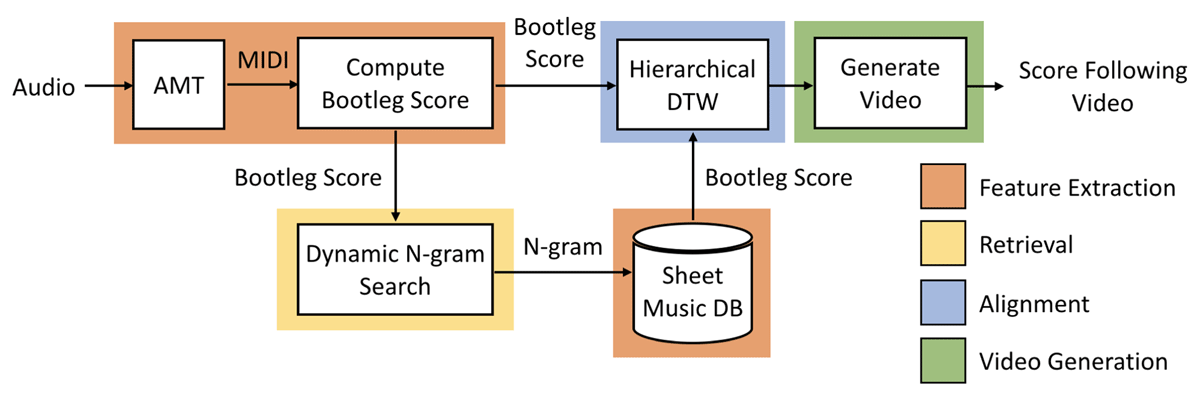
Figure 1
Architecture of the proposed approach. The audio query is converted into a bootleg score and used to find a match in a precomputed database of sheet music bootleg scores (retrieval). The matching sheet music and the audio query are then aligned, and the predicted alignment is used to generate a score following video.
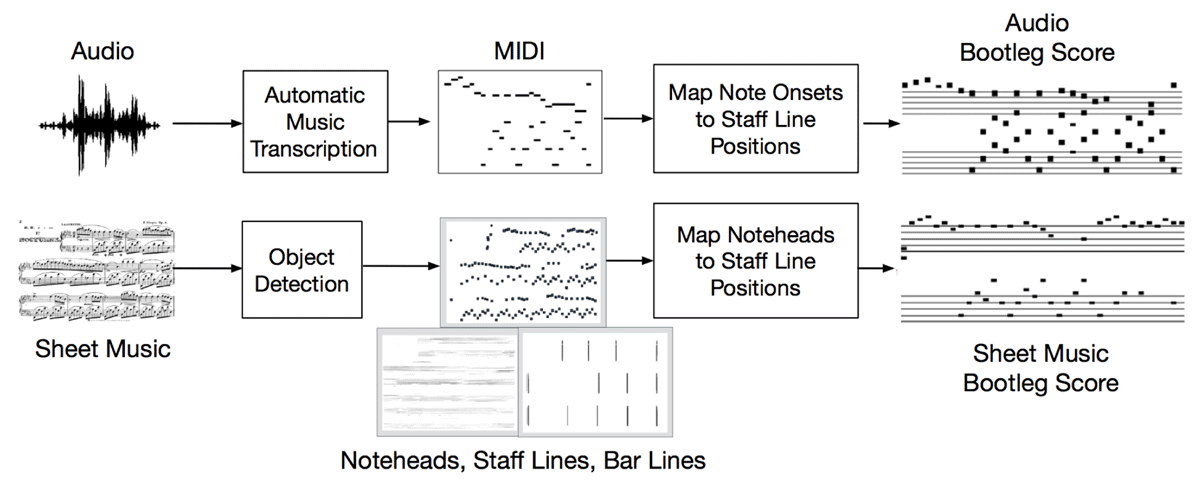
Figure 2
Computing a bootleg score from audio (top) and sheet music (bottom).
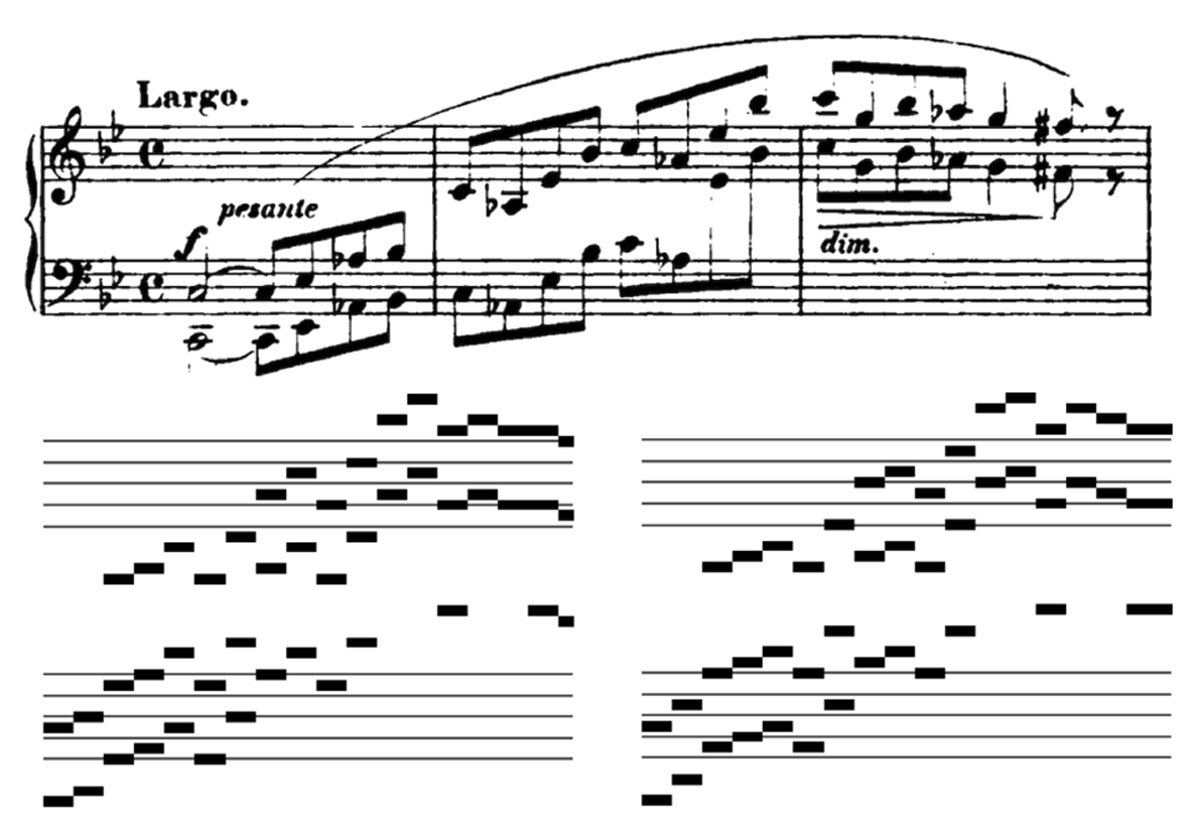
Figure 3
When converting MIDI data to a piano bootleg score, one can interpret black notes on the piano as sharps (lower left) or as flats (lower right). Both versions are processed during the search, and the one with a higher match score is kept.
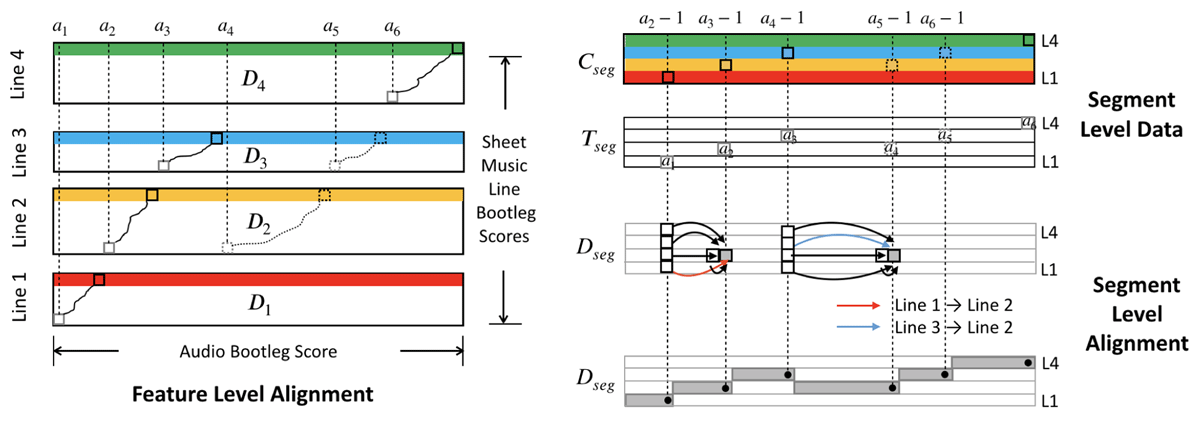
Figure 4
Illustration of Hierarchical DTW on a given piece. Four lines in the sheet music are performed in the following order: line 1, line 2, line 3, line 2, line 3, line 4. On the left, we use subsequence DTW to perform feature-level alignment with each line of sheet music. On the right, the segment-level data matrices are shown. Cseg records all subsequence scores from the four lines (indicated by the green, blue, yellow, and red rows). Tseg records the starting location of subsequence paths. Dseg records the optimal cumulative path scores at the segment level. The upper illustration of Dseg shows the possible transitions for two elements in the matrix, where the optimal transition is indicated by a highlighted arrow. The lower illustration of Dseg indicates the optimal path as a series of black dots. The optimal path induces a segmentation of the audio recording, which corresponds to the time intervals where the corresponding sheet music line should be shown.
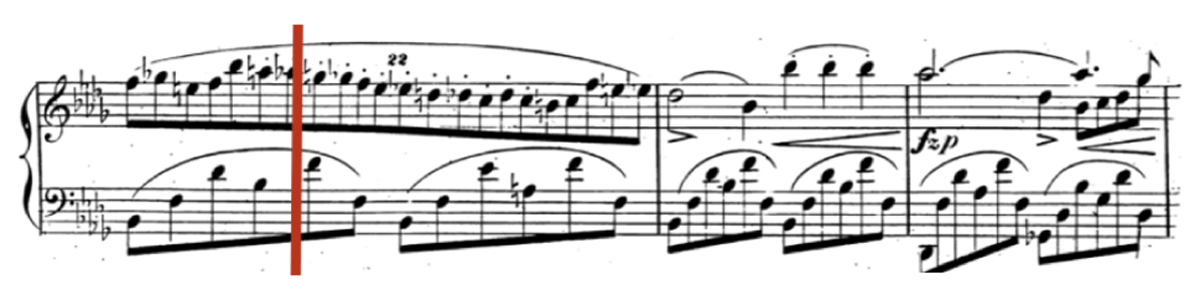
Figure 5
A single frame of the video generated from Chopin Nocturne Op. 9 No. 1. The video shows the estimated line of music and uses a red cursor to indicate the predicted location.
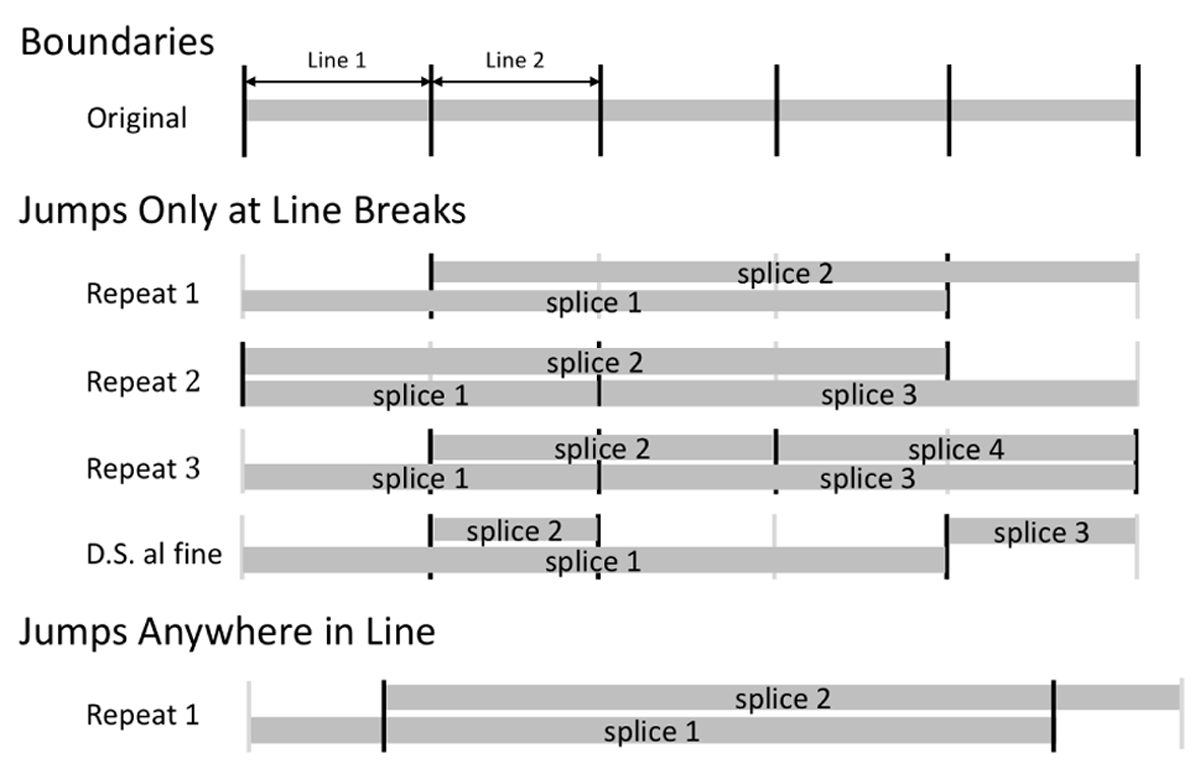
Figure 6
Generating audio with various types of repeats. To generate data with repeats at line breaks, we segment the original audio recording at sheet music line breaks, sample boundary points without replacement, and then splice and concatenate audio segments as shown above. To generate data with repeats that can occur mid-line, we first sample lines and then randomly choose time points in those lines.
Table 1
System performance on the audio-sheet image retrieval task with all solo piano sheet music images in IMSLP. Results are reported for five different repeat benchmarks and across two types of audio.
| MRR | ||
|---|---|---|
| Benchmark | Synthetic | Real |
| No Repeat | 0.77 | 0.63 |
| Repeat 1 | 0.76 | 0.63 |
| Repeat 2 | 0.75 | 0.61 |
| Repeat 3 | 0.75 | 0.60 |
| D.S. al fine | 0.78 | 0.63 |
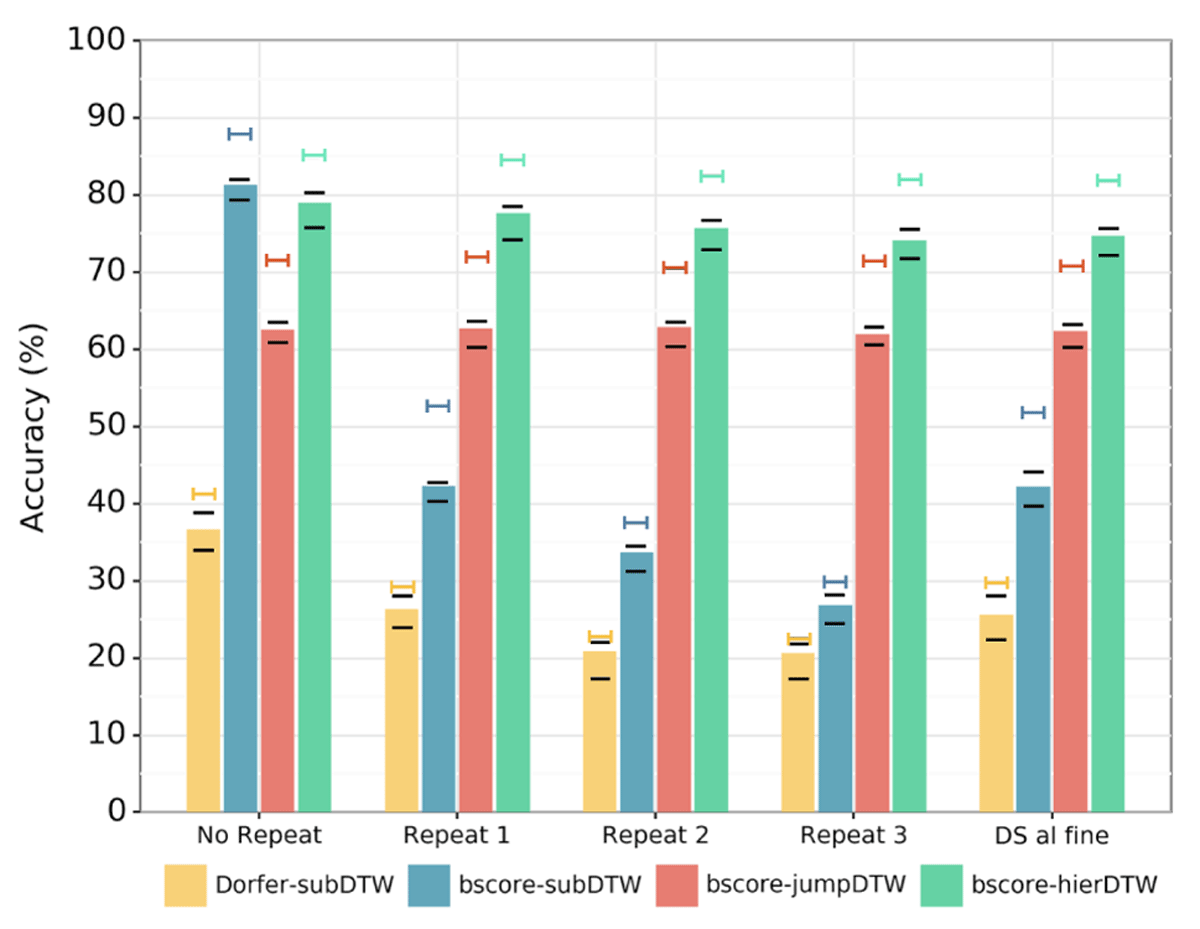
Figure 7
Comparison of system performance on the audio-sheet image alignment task with various types of jumps. The bar levels indicate accuracy with a scoring collar of 0.5 sec on real audio. The short black lines indicate accuracy with scoring collars of 0 and 1.0 seconds on real audio. The top lines with the same color as the bars indicate that system’s accuracy with a scoring collar of 0.5 seconds on synthetic audio.

Figure 8
Visualization of system predictions for a query with no repeats (top half) and a query with three repeats (bottom half). The gray stripes represent the duration of the whole audio recording. The black vertical lines show ground truth locations of line breaks, and the red regions indicate times when an incorrect line of sheet music is being shown. The thick blue lines indicate the positions of jumps and repeats.
Table 2
Runtime information for the alignment and retrieval subsystems. These times exclude the time required to extract features.
| Alignment (All Pages) | Alignment (Only Matching Pages) | Retrieval | ||||
|---|---|---|---|---|---|---|
| Benchmark | avg (min) | std (min) | avg (sec) | std (sec) | avg (sec) | std (sec) |
| No Repeat | 8.0 | 62.8 | 27.9 | 17.4 | 3.95 | 3.57 |
| Repeat 1 | 11.2 | 69.6 | 32.4 | 20.3 | 5.24 | 3.83 |
| Repeat 2 | 14.9 | 99.6 | 42.1 | 23.9 | 6.77 | 3.33 |
| Repeat 3 | 20.4 | 103.4 | 79.8 | 69.0 | 8.34 | 19.22 |
| D.S. al fine | 13.7 | 78.2 | 46.3 | 30.7 | 5.30 | 3.49 |
Table 3
Runtime information for all components of the system on an average length piece (4 minutes of audio, 13 pages of sheet music).
| System Component | AMT | Retrieval | Alignment | Video Generation | Total |
|---|---|---|---|---|---|
| Time (sec) | 30 | 5 | 30 | 20 | 85 |
| Percentage (%) | 35 | 6 | 35 | 24 | 100 |
Table 4
Assessing the effect of jump locations on the audio-sheet image alignment task. Two conditions are compared: when jump locations occur only at line breaks (column 3) and when jump locations can occur anywhere in a line (column 4). Column 5 shows the performance difference between these two conditions.
| System | Benchmark | Line Breaks Only (%) | Random Location (%) | Difference (%) |
|---|---|---|---|---|
| JumpDTW | No Repeat | 71.5 | 71.5 | N/A |
| Repeat 1 | 71.9 | 69.0 | –2.9 | |
| Repeat 2 | 70.5 | 67.2 | –3.3 | |
| Repeat 3 | 71.4 | 65.8 | –5.6 | |
| D.S. al fine | 70.7 | 66.1 | –4.6 | |
| HierDTW | No Repeat | 84.8 | 84.8 | N/A |
| Repeat 1 | 84.5 | 81.2 | –3.3 | |
| Repeat 2 | 82.5 | 78.4 | –4.1 | |
| Repeat 3 | 81.9 | 76.4 | –5.5 | |
| D.S. al fine | 81.8 | 77.4 | –4.4 |