
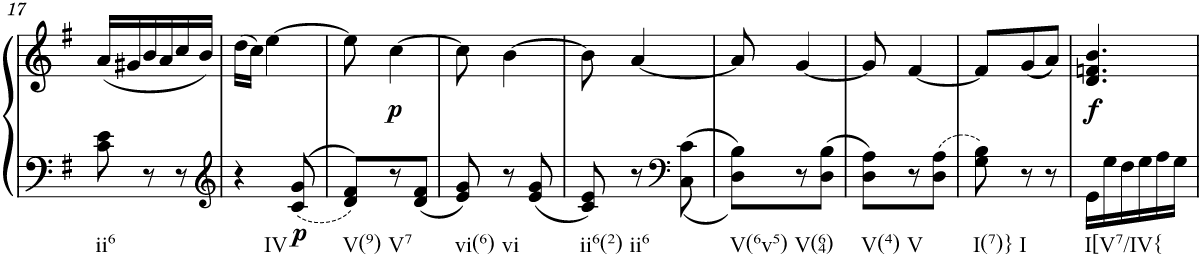
Figure 1
Measures 17–25 of the final movement of K. 283. The example shows an annotated score excerpt employing the DCML syntax as displayed in MuseScore 3.
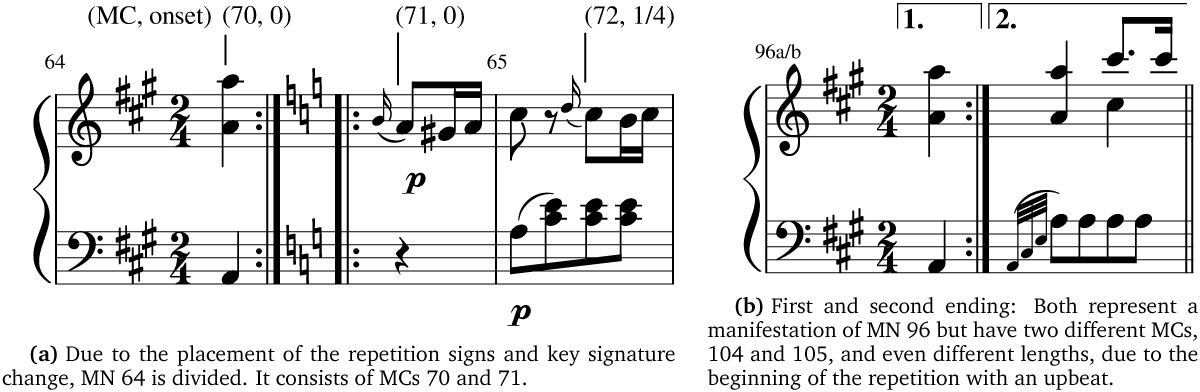
Figure 2
Examples from the third movement of K. 331 where measure numbers (MN) and measure counts (MC) diverge.
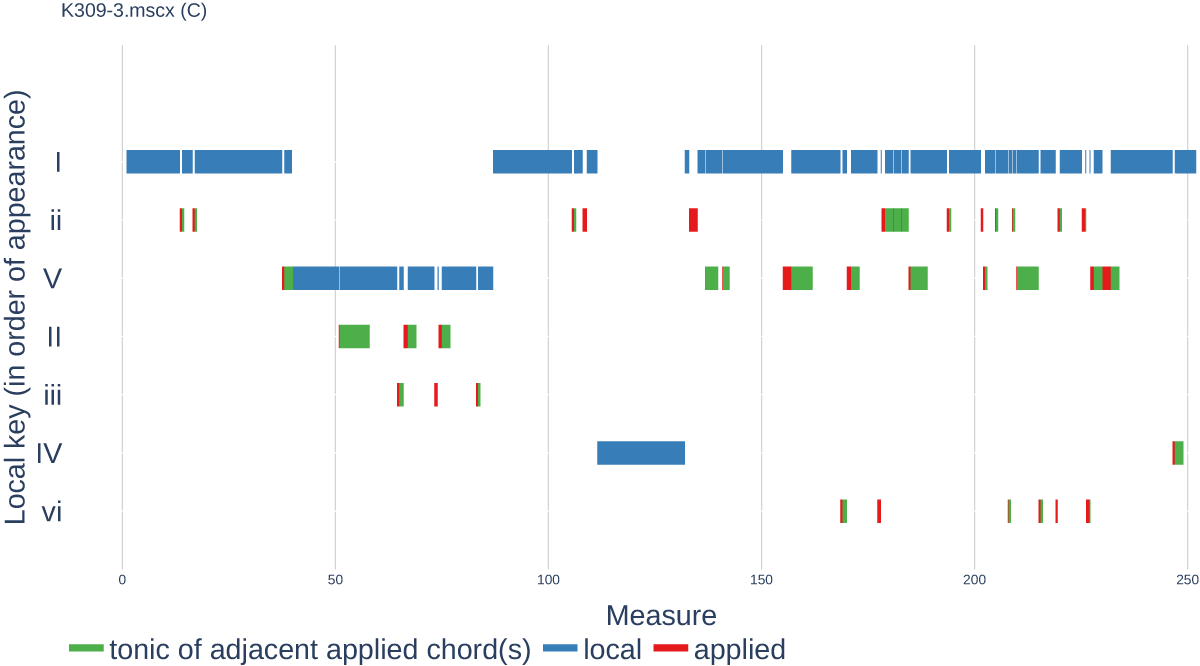
Figure 3
Gantt chart representing the disposition of local keys in the final movement of K. 309. Blue lines show which measures are in which local key; red lines show temporary tonicizations and interrupt the blue line; green lines mark presence of the temporarily tonicized key’s tonic. [interactive]
Table 1
Features encoded in the DCML standard. RN stands for Roman numeral (with uppercase and lowercase numerals distinguishing between major and minor). <NA> designates null values which may encode chord information as well (e.g., the lack of an inversion symbol indicating a root-position triad).
| Feature | Encoding | Examples |
|---|---|---|
| Global key | Name. | Ab.I, g#.i |
| Local key | RN. | v.i, bVII.I |
| Chordal root | RN | I, bII, #vii |
| Chord type | <NA>, +, o, %, M | viio, IV+ |
| Chord inversion | <NA>,6, 64, 7, 65, 43, 2 | I6, ii%65 |
| Replacing interval(s) | ( ) | V(64), i(#74) |
| Added interval(s) | (+) | I(+6), V(+b9+4) |
| Lower-level reference | /RN | V7/V, #viio/ii |
| Phrase boundary | {, }, }{ | V}, I6{ |
| Pedal point | RN[ ] | I[V7/IV IV I] |
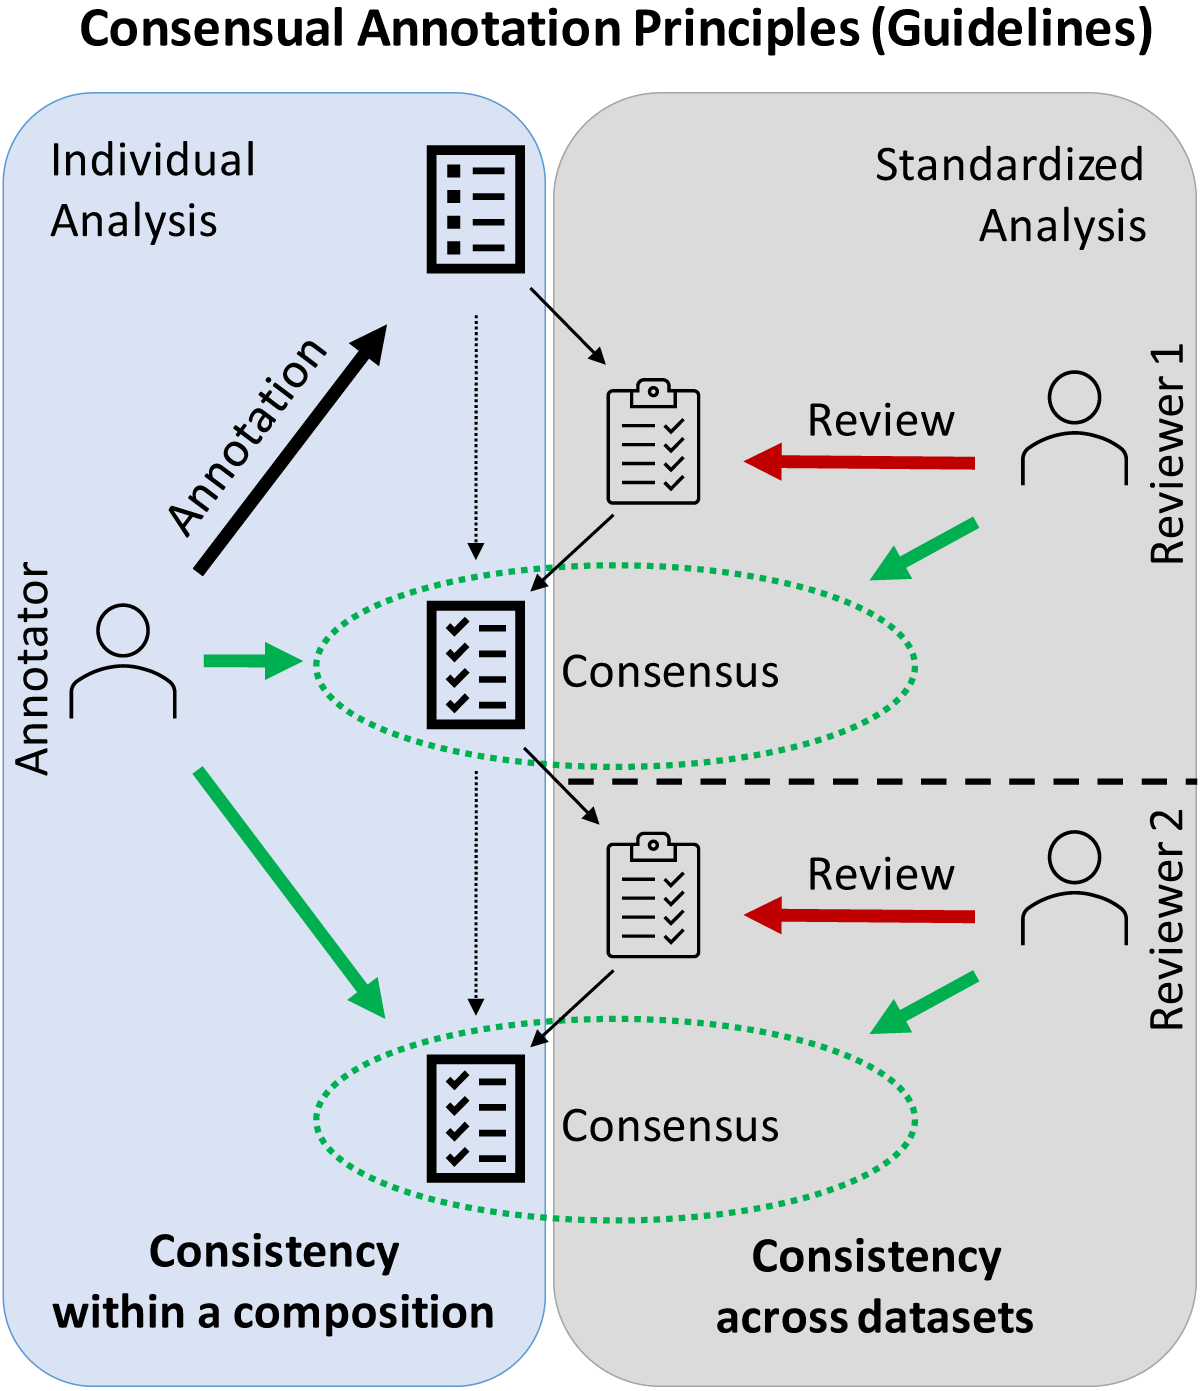
Figure 4
Data triangulation scheme for verifying a set of expert annotations for a particular composition. Annotator and reviewer(s) share the goal of reaching a consensus on a set of annotation labels that best represents the structural properties of a composition given the predefined annotation principles (guidelines). Consensus is reached through discussions between annotator and one or several reviewers. Taking the common guidelines into account, annotators ensure analytic consistency within a composition by defending their own analytical choices, while reviewers base their suggestions and arguments on how these guidelines have previously been realized across datasets.
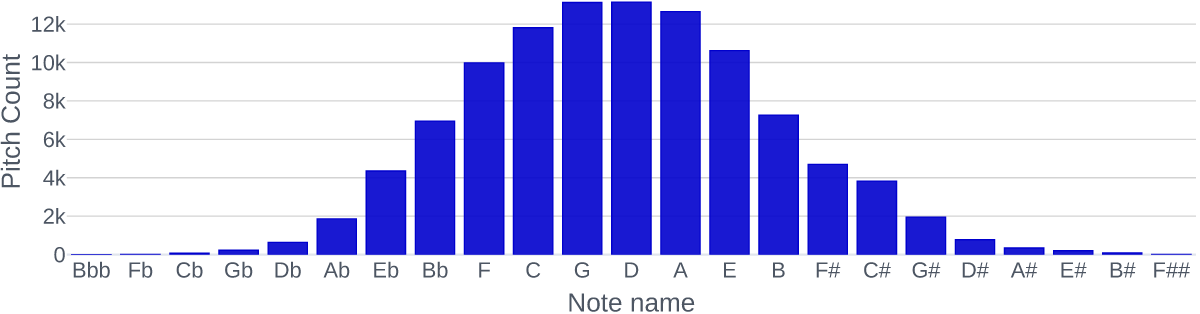
Figure 5
Distribution of pitch classes over the dataset. [interactive]
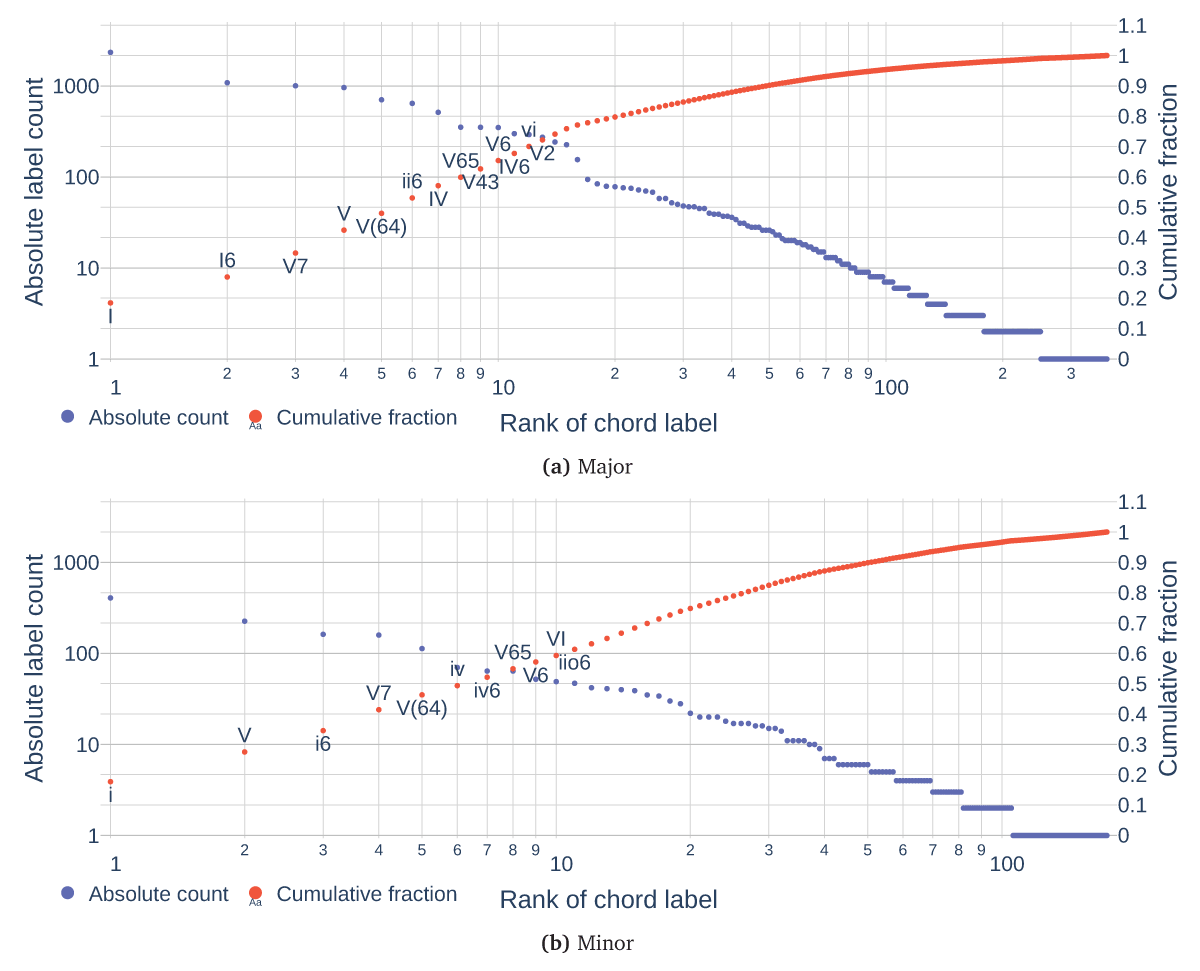
Figure 6
Unigram statistics for all (a) major [interactive] and (b) minor segments [interactive], ordered by rank. Blue markers show absolute counts, red markers the cumulated token fraction of the current and all previous ranks.

Table 2
Comparison of this dataset’s cadence distribution with that of a similar dataset based on 50 string quartet expositions by Joseph Haydn (Sears et al., 2018).
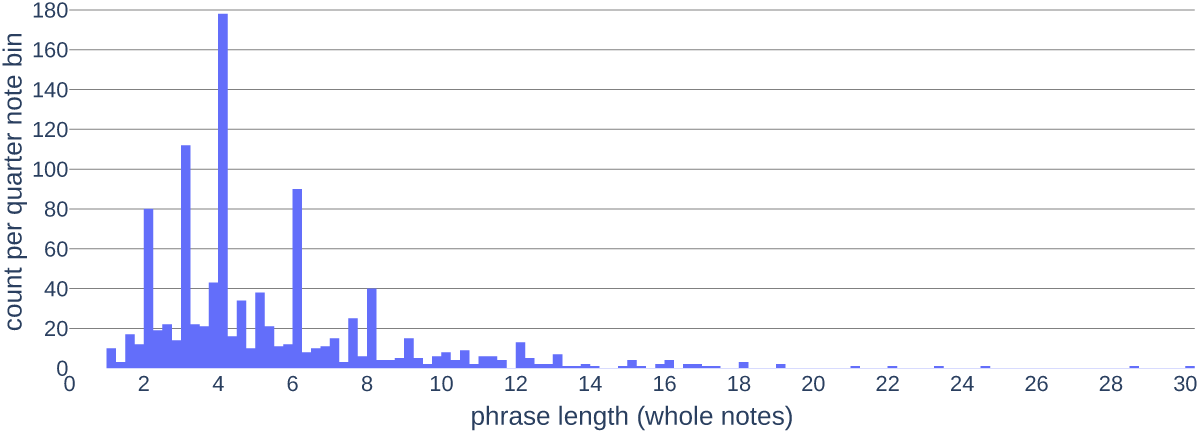
Figure 7
Histogram with bin size of a quarter note, showing the distribution of phrase lengths. [interactive]
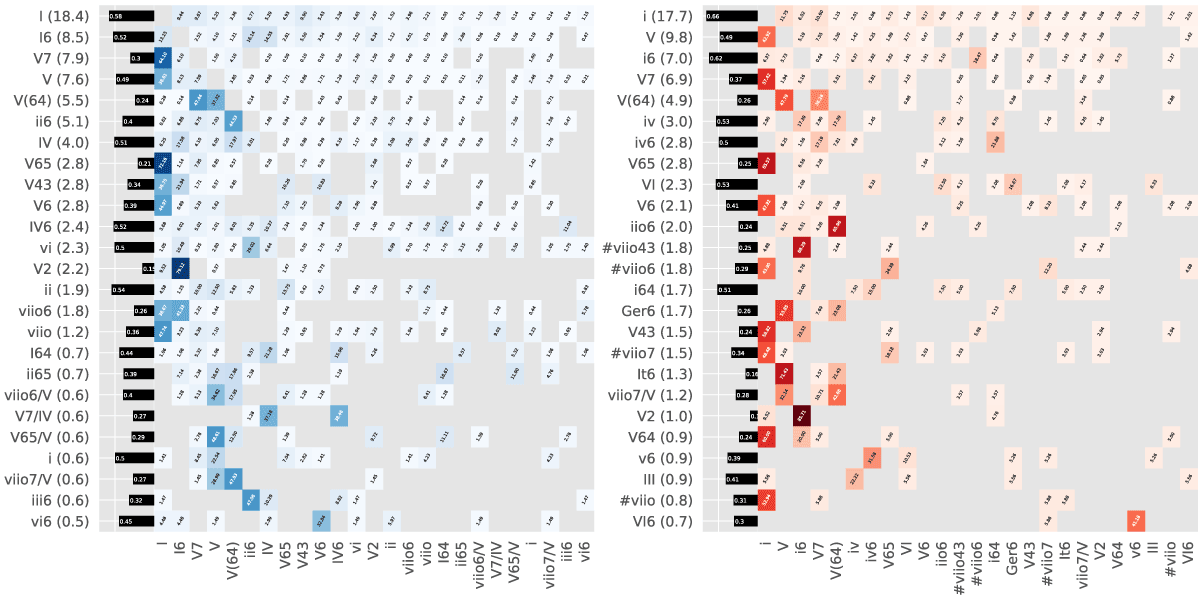
Figure 8
Heatmaps showing the relative bigram frequencies (as percentages) for the top 25 chord types of all major (left, blue) and minor (right, red) segments. The black bars show each label’s entropy, and the values behind the single chords indicate their relative (unigram) frequency.
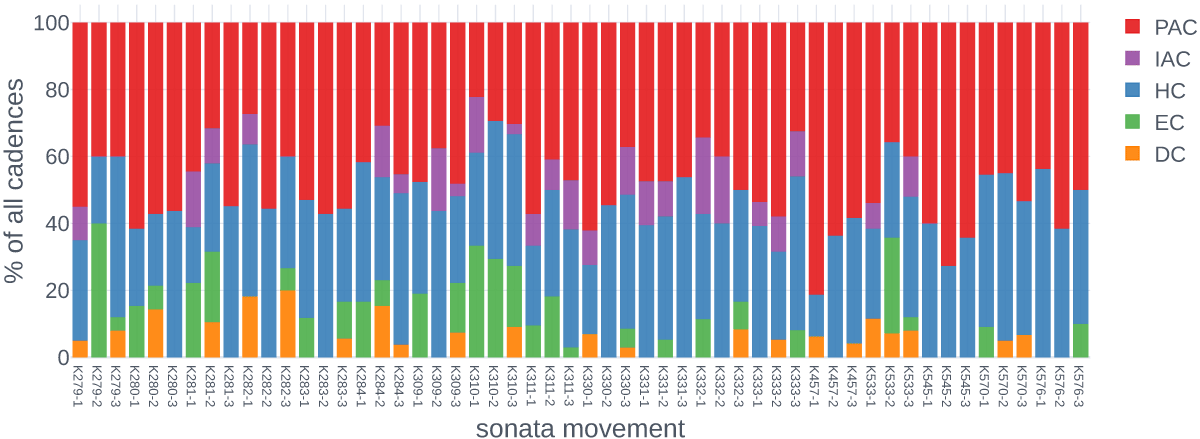
Figure 9
Distribution of cadence labels over each of the 54 sonata movements. PAC/IAC: Perfect/Imperfect Authentic Cadence; HC: Half Cadence; EC: Evaded Cadence; DC: Deceptive Cadence. [interactive]
Table 3
The respective frequencies for the harmonies ending of each of the five cadence types (i.e., the harmonic labels coinciding with the cadence labels). For example, 87.6% of all perfect authentic cadences end on a major tonic chord, I.
| Cadence Type | Harmony | Count | % |
|---|---|---|---|
| PAC (517) | I | 453 | 87.6 |
| i | 64 | 12.4 | |
| HC (398) | V | 392 | 98.5 |
| V6 | 3 | 0.75 | |
| V7 | 3 | 0.75 | |
| EC (81) | I | 32 | 39.5 |
| I6 | 22 | 27.2 | |
| i | 4 | 4.9 | |
| #viio43/ii | 4 | 4.9 | |
| IV6 | 3 | 3.7 | |
| #viio65/ii | 2 | 2.5 | |
| i6 | 2 | 2.5 | |
| I(7) | 2 | 2.5 | |
| V65 | 2 | 2.5 | |
| #viio43/vi | 1 | 1.2 | |
| #viio/ii | 1 | 1.2 | |
| IV | 1 | 1.2 | |
| #viio64 | 1 | 1.2 | |
| V43 | 1 | 1.2 | |
| viio2 | 1 | 1.2 | |
| #viio43 | 1 | 1.2 | |
| #viio65/iv | 1 | 1.2 | |
| IAC (69) | I | 62 | 89.9 |
| i | 7 | 10.1 | |
| DC (38) | vi | 25 | 65.8 |
| viio6/V | 5 | 13.2 | |
| VI | 4 | 10.5 | |
| V43/V | 2 | 5.3 | |
| Ger6 | 1 | 2.6 | |
| vi (6) | 1 | 2.6 |
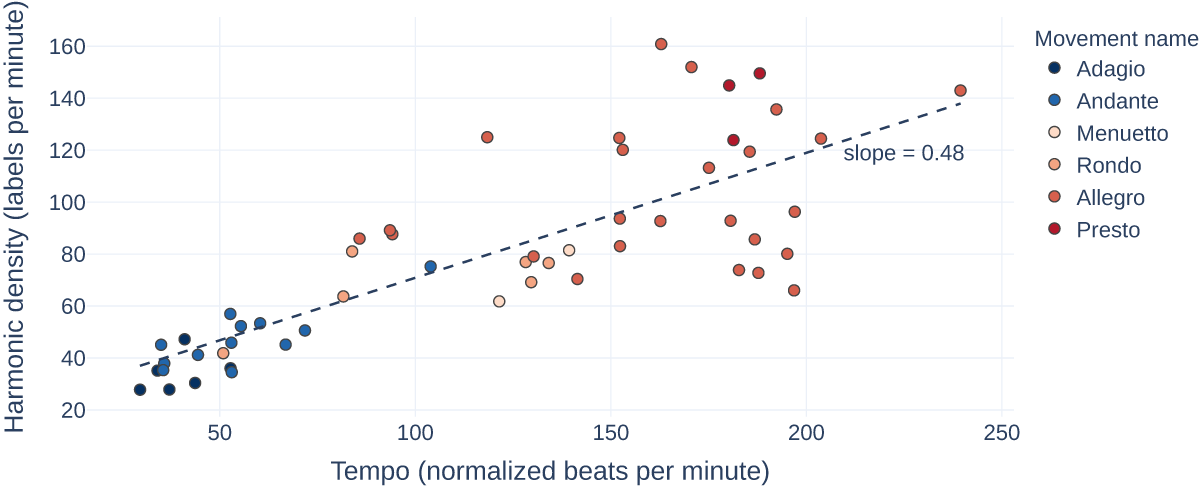
Figure 10
Harmonic densities of all sonata movements plotted over their respective tempos and color coded by their movement names. Both density and tempo depend on the median performance duration. [interactive]