
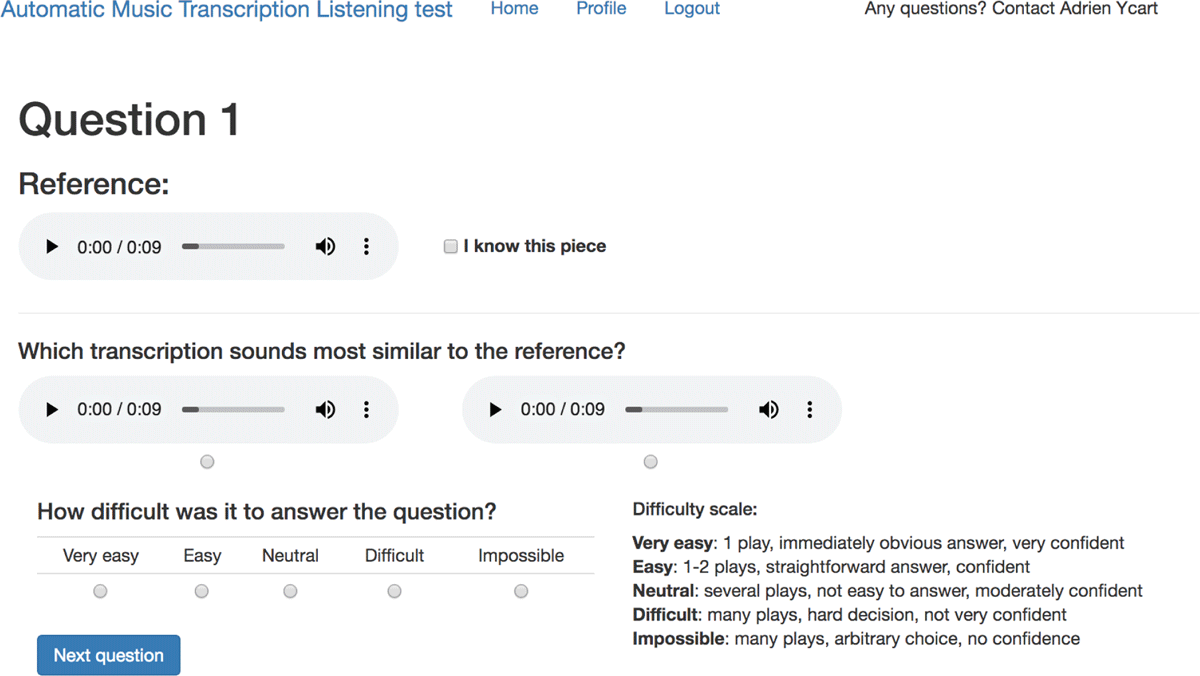
Figure 1
Screenshot of the listening test website.
Table 1
Benchmark evaluation metrics for all systems, evaluated on the MAPS subsets ENSTDkCl and ENSTDkAm, with best values in bold.
| System | Pf | Rf | Ff | Pn,On | Rn,On | Fn,On | Pn,OnOff | Rn,OnOff | Fn,OnOff |
|---|---|---|---|---|---|---|---|---|---|
| STF | 67.2 | 60.0 | 62.7 | 49.8 | 32.0 | 38.3 | 16.5 | 11.3 | 13.2 |
| CNN | 80.2 | 58.2 | 66.1 | 77.0 | 54.9 | 63.2 | 33.5 | 24.6 | 28.0 |
| NMF | 71.3 | 63.3 | 66.4 | 79.6 | 57.0 | 65.7 | 35.7 | 26.4 | 30.0 |
| OAF | 89.0 | 79.5 | 83.8 | 85.9 | 84.1 | 84.9 | 66.9 | 65.5 | 66.2 |
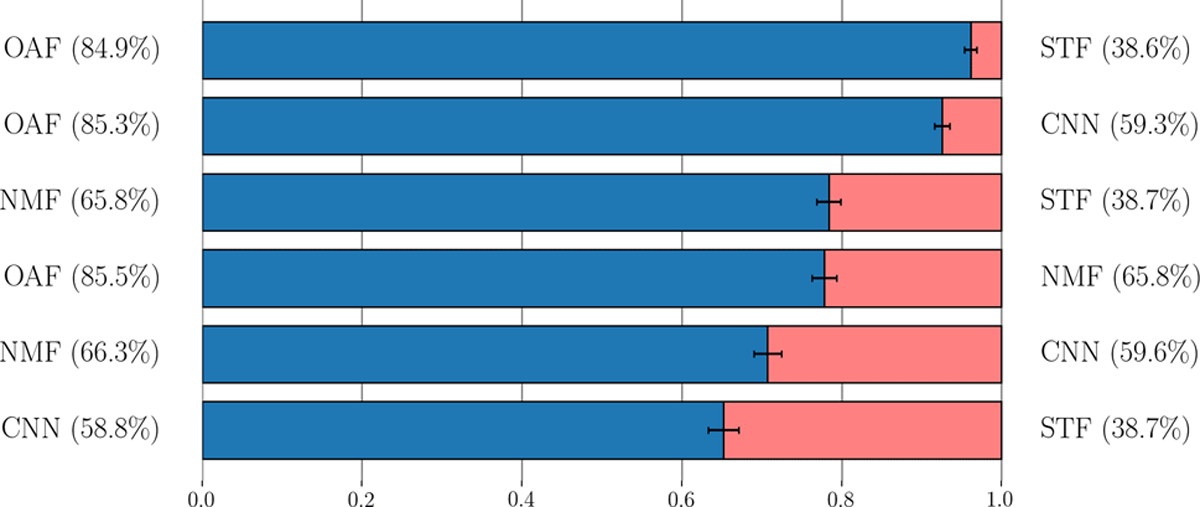
Figure 2
Vote proportion in pairwise comparisons of the systems. Blue bars represent the proportion of times the system on the left was chosen over the one on the right. For each pair, the percentage in parentheses is the average Fn,On computed on the specific examples included in the comparison.
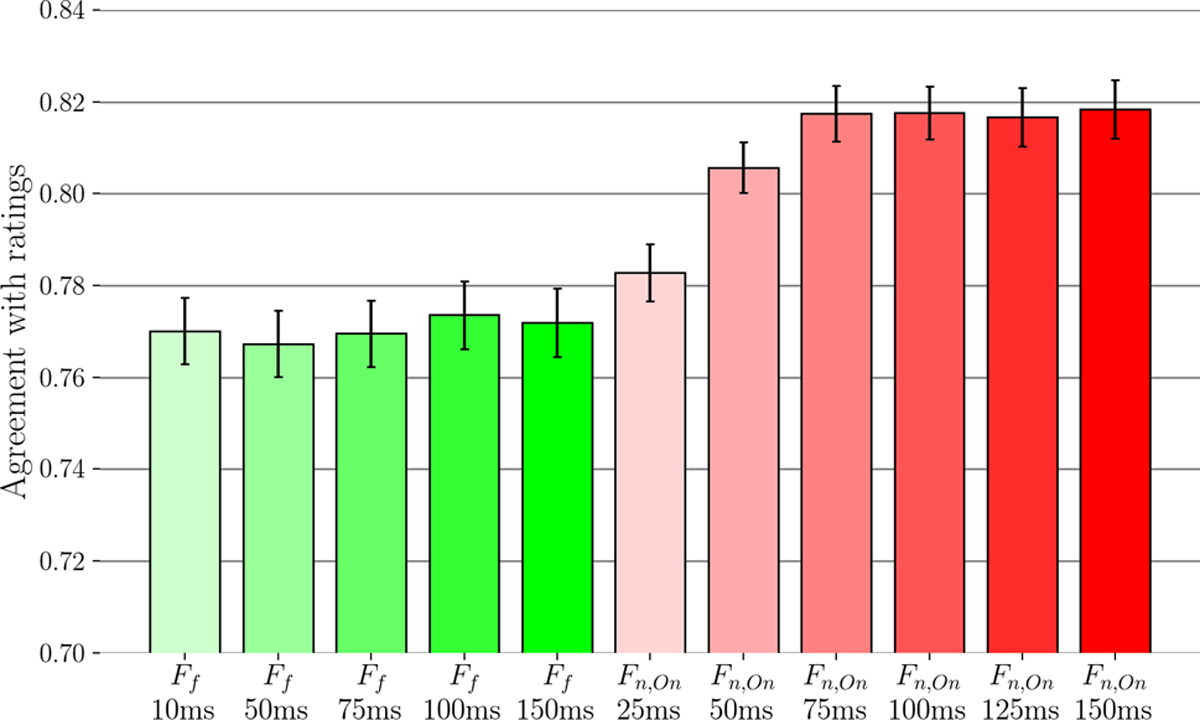
Figure 3
Proportion of agreement, across all examples, between raters and various evaluation metrics (Ff with various frame sizes, and Fn,On with various tolerance thresholds).
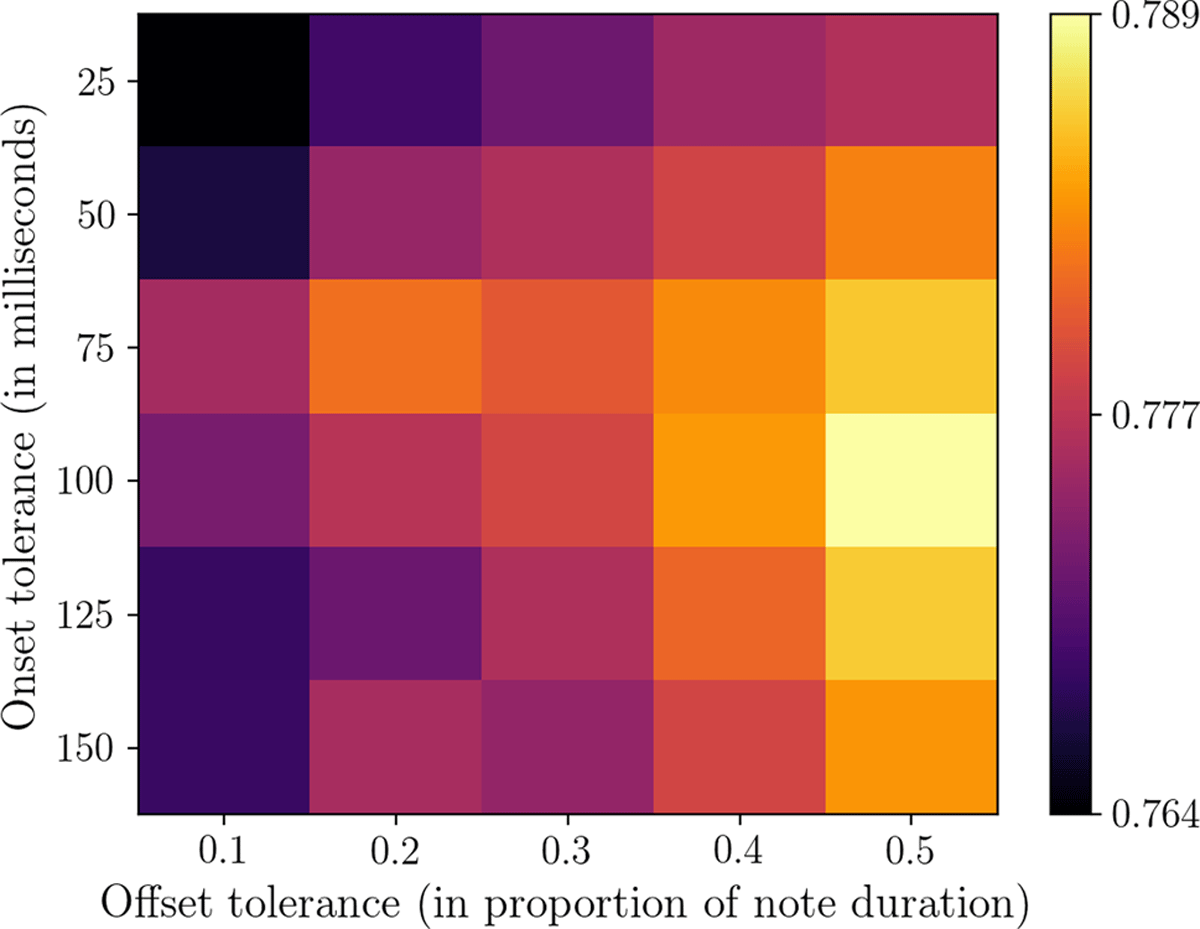
Figure 4
Proportion of agreement, across all examples, between raters and Fn,OnOff, with various onset and offset tolerance thresholds.
Table 2
Coefficients and p-values for the linear fixed effects model using agreement with Fn,On as dependent variable and features as fixed effects.
| Feature | Coefficient | P-value |
|---|---|---|
| ΔF | 0.539 | <0.001 |
| Fbest | 0.330 | <0.001 |
| Gold-MSI | –0.007 | 0.232 |
| Known | 0.014 | 0.391 |
| Difficulty | –0.044 | <0.001 |
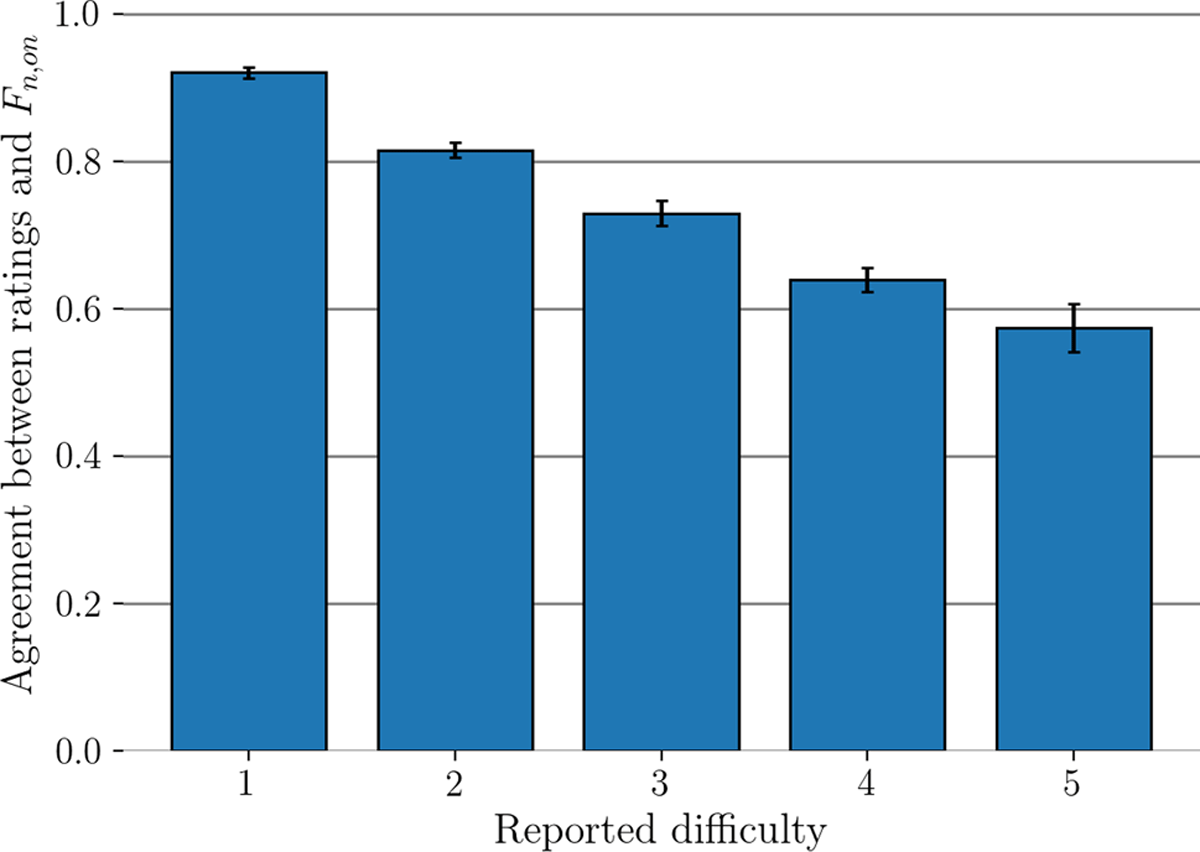
Figure 5
Agreement between ratings and Fn,On for each reported difficulty level.
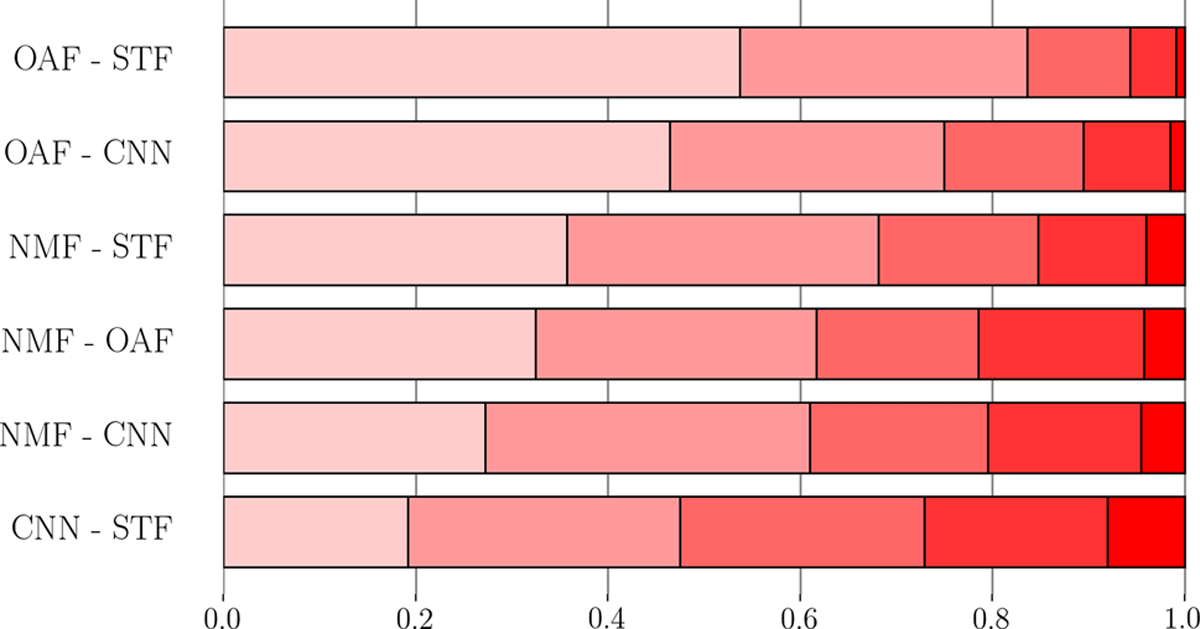
Figure 6
Distribution of difficulty ratings (lightest = 1, darkest = 5) for each pair of systems.
Table 3
Coefficients and p-values for the linear fixed effects model using difficulty as dependent variable and features as fixed effects.
| Feature | Coefficient | P-value |
|---|---|---|
| ΔF | –1.564 | <0.001 |
| Fbest | –0.608 | <0.001 |
| Gold-MSI | –0.227 | <0.001 |
| Known | –0.153 | 0.002 |
| Agree | –0.423 | <0.001 |
Table 4
Coefficients and p-values for the linear fixed effects model using agreement with Fn,On as dependent variable and features as fixed effects, on confident answers only.
| Feature | Coefficient | P-value |
|---|---|---|
| ΔF | 0.584 | <0.001 |
| Fbest | 0.349 | <0.001 |
| Gold-MSI | –0.014 | 0.011 |
| Known | 0.002 | 0.912 |
| Difficulty | –0.036 | <0.001 |
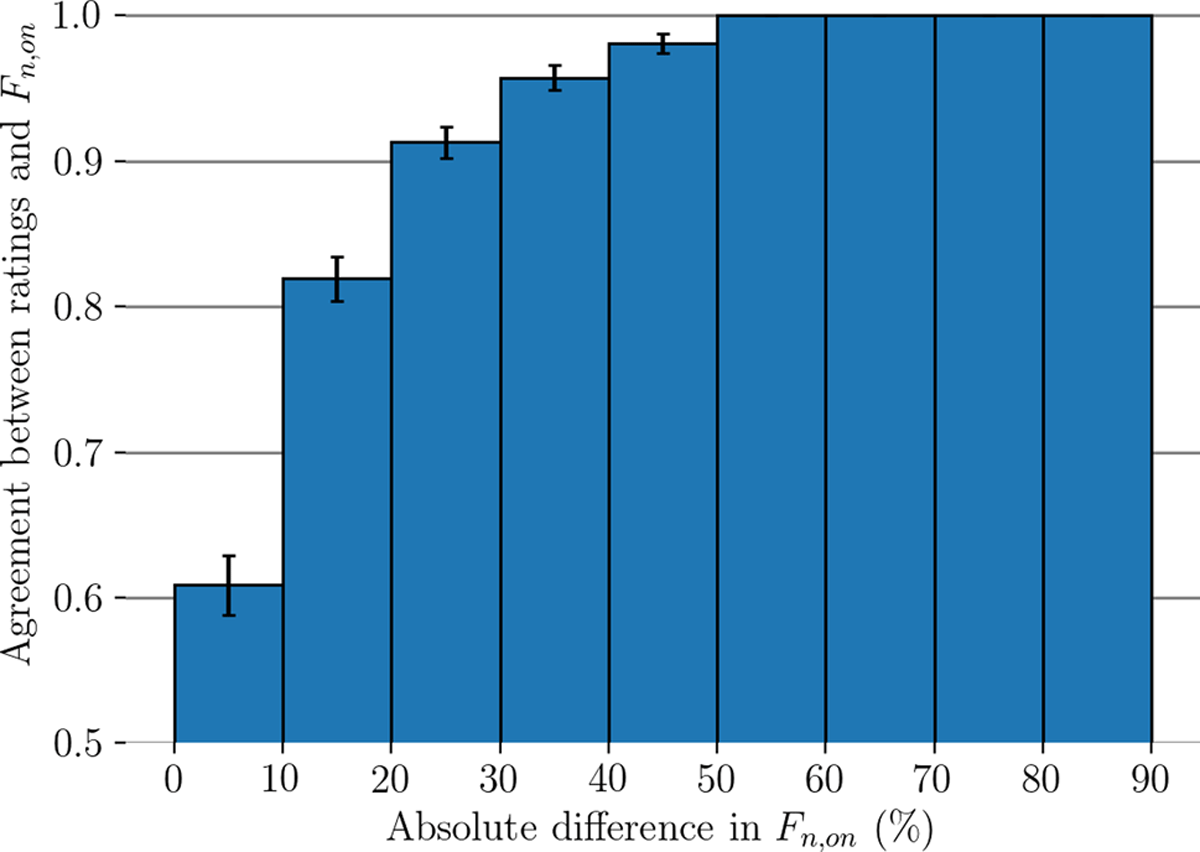
Figure 7
Proportion of agreement depending on the difference in Fn,On between the two options, computed on confident answers only.
Table 5
Coefficients and p-values for the linear fixed effects model using agreement among raters as dependent variable and features as fixed effects.
| Feature | Coefficient | P-value |
|---|---|---|
| ΔF | 0.496 | <0.001 |
| Fbest | –0.092 | 0.423 |
| Gold-MSIavg | –0.071 | 0.004 |
| Gold-MSIstd | –0.016 | 0.778 |
| Difficultyavg | –0.176 | 0.003 |
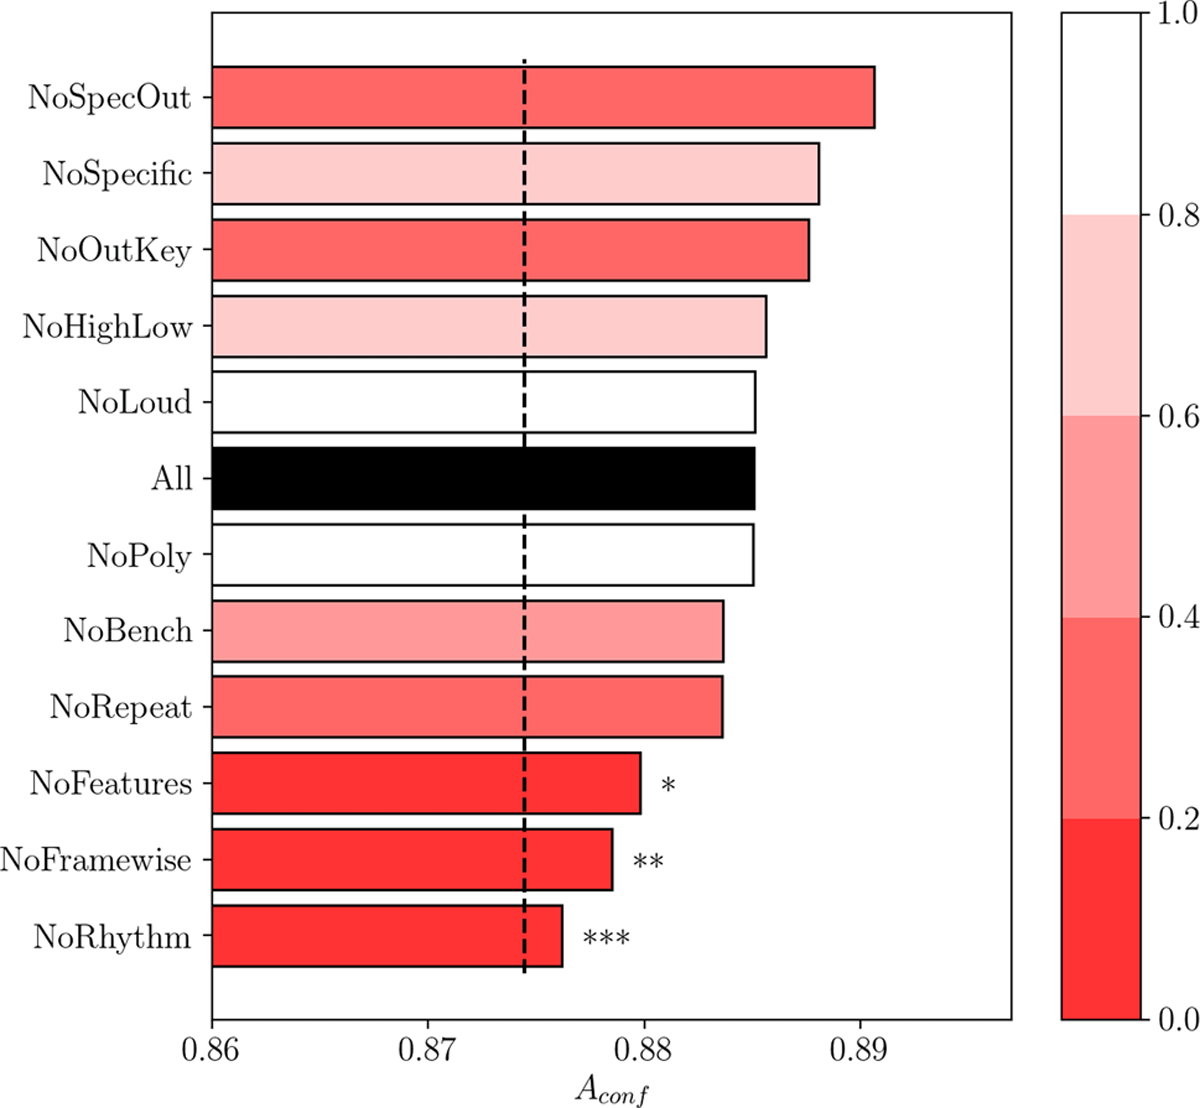
Figure 8
Aconf measure for each tested configuration, averaged across folds. The dotted line represents Aconf for Fn,On. Descriptions of each configuration are given in Table 6. Colors represent the p-value when testing whether each metric is different from the “All” configuration. Asterisks represent results significantly different from All (*: p < 0.1, **: p < 0.05, ***: p < 0.01).
Table 6
Description of each tested feature configuration.
| Configuration | Removed features |
|---|---|
| All | None |
| NoBench | Benchmark metrics |
| NoFeatures | All features, except benchmark metrics |
| NoHighLow | Mistakes in highest and lowest notes |
| NoLoud | Loudness of false negatives |
| NoOutKey | Out-of-key false positives |
| NoRepeat | Repeated and merged notes |
| NoSpecific | Specific pitch mistakes |
| NoPoly | Polyphony level difference |
| NoRhythm | Rhythm histogram flatness and rhythm dispersion |
| NoFramewise | Framewise benchmark metrics, framewise highest and lowest note mistakes, framewise specific pitch errors, polyphony level difference, consonance measures |
| NoSpecOut | Specific pitch mistakes and out-of-key false positives |