
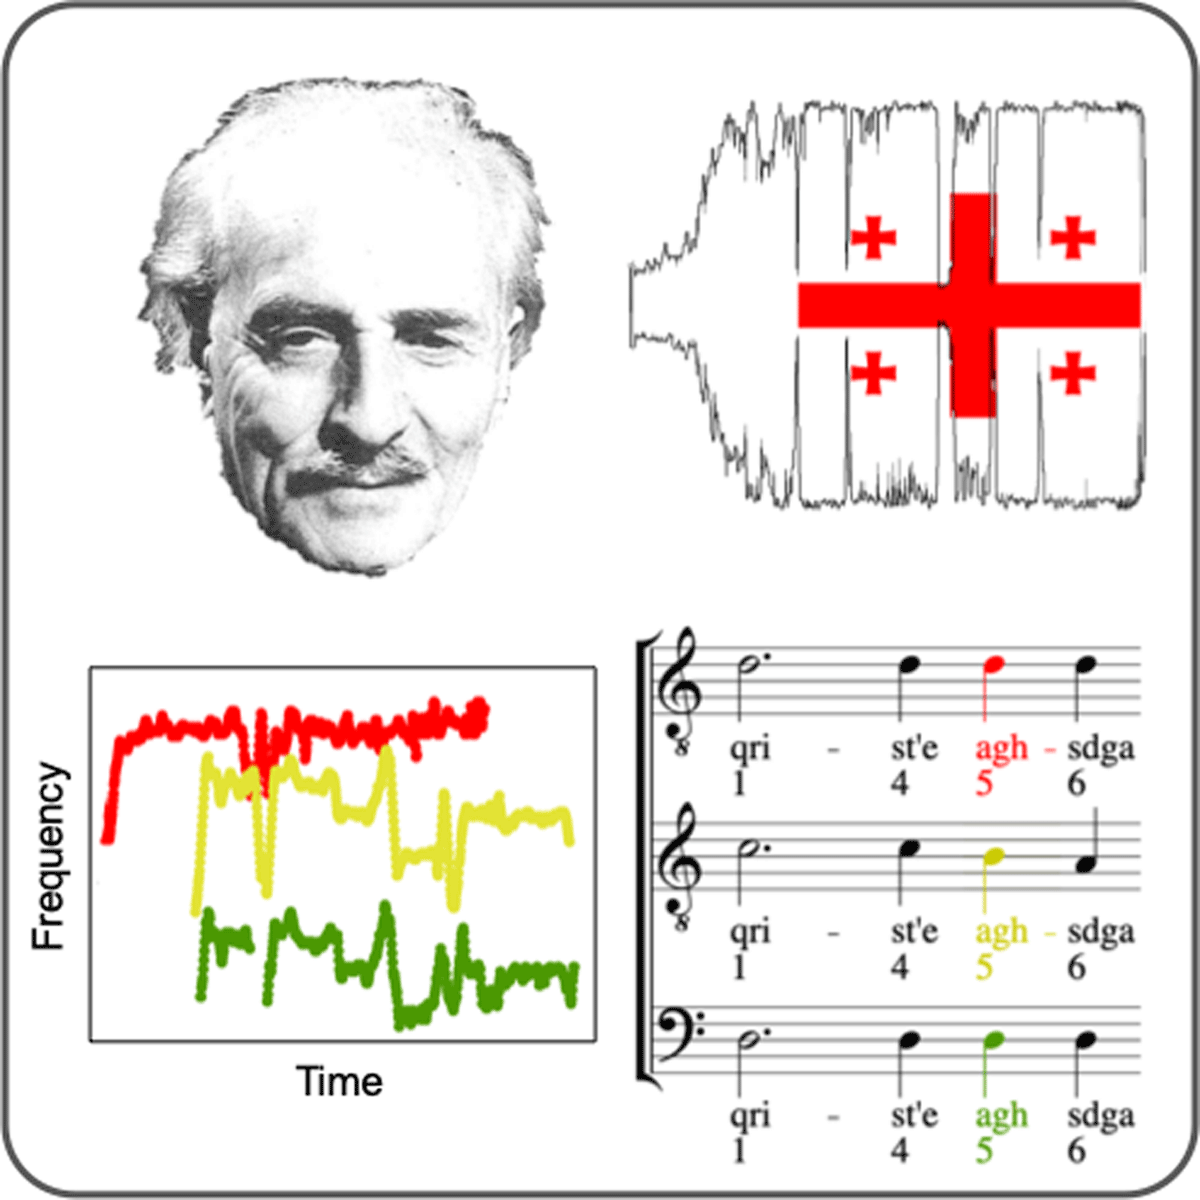
Figure 1
Erkomaishvili dataset with annotations.1
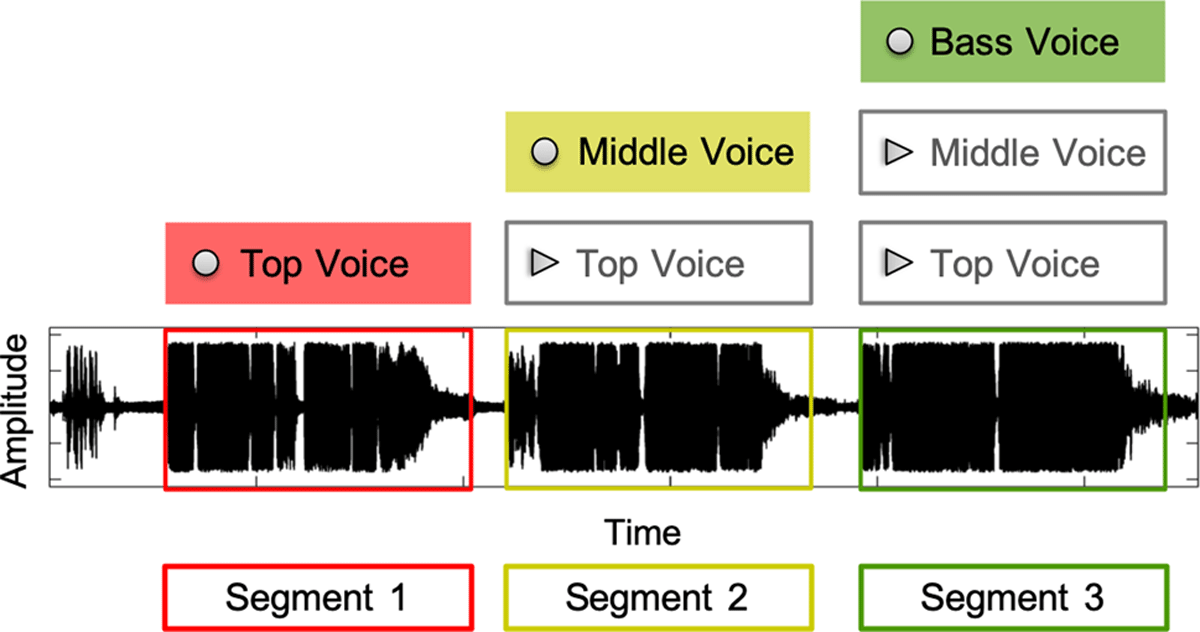
Figure 2
Illustration of three-stage recording process.
Table 1
Overview on Erkomaishvili’s recordings.
| # Songs | Total Duration (hh:mm:ss) | Mean/Min/Max Duration (mm:ss) |
|---|---|---|
| 101 | 7:04:49 | 04:12/00:40/13:37 |
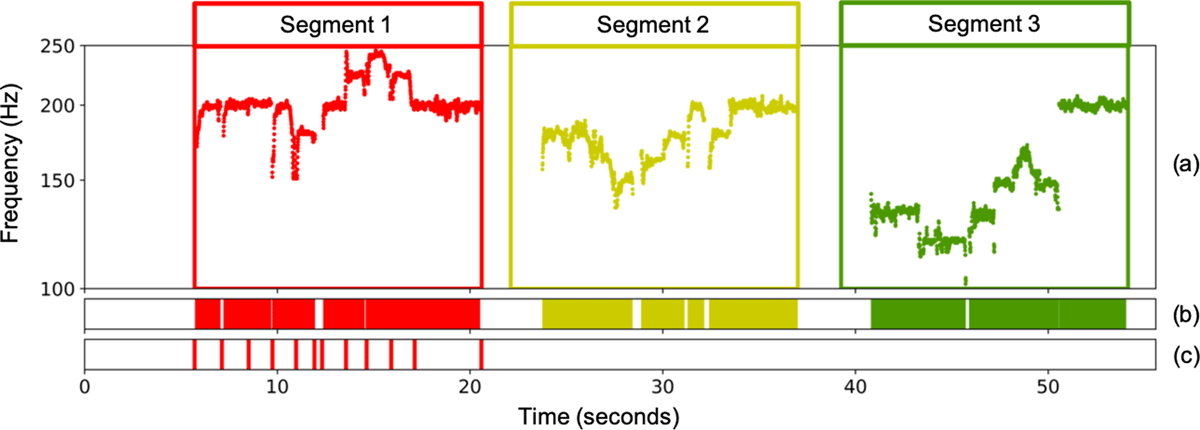
Figure 3
Illustration of available annotations for the song “Da Sulisatsa” (GCH-ID 087). (a) F0-trajectories within annotated segment boundaries plotted on a logarithmic frequency axis. (b) Activations of F0-trajectories. (c) Onset annotations including segment end.
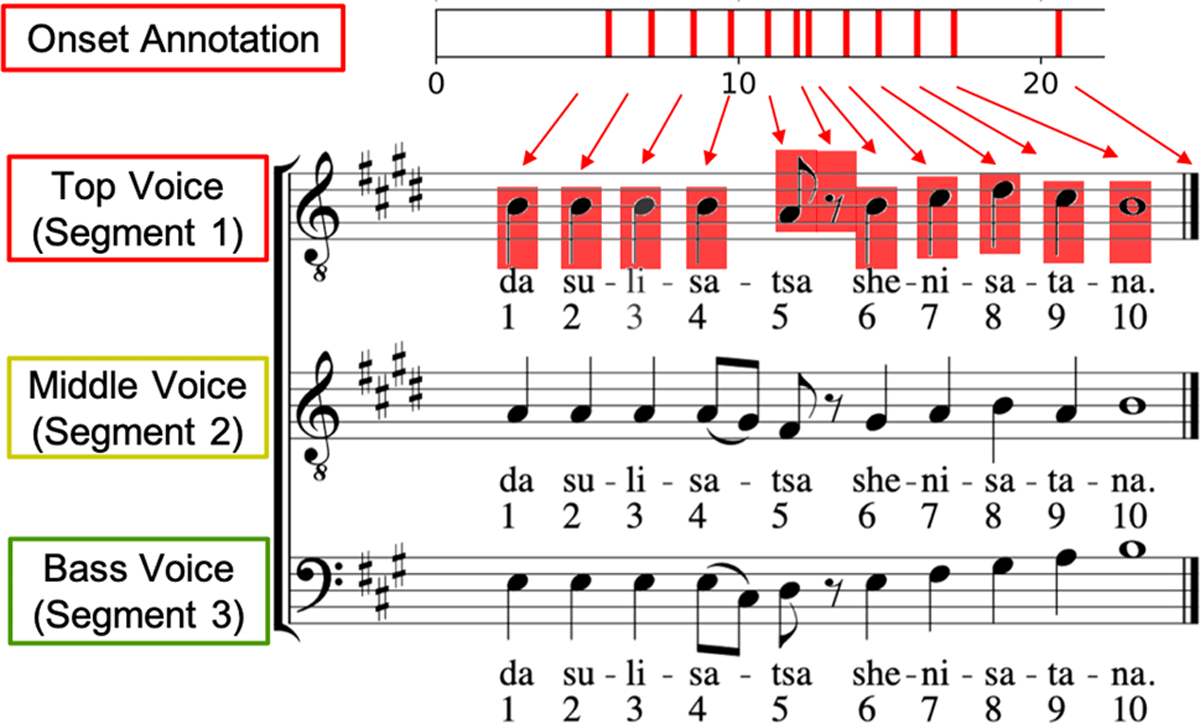
Figure 4
Digital score for “Da Sulisatsa” (GCH-ID 087). The annotated note and rest onsets for the top voice are highlighted in red. The QNRs are displayed underneath the lyrics of each voice.
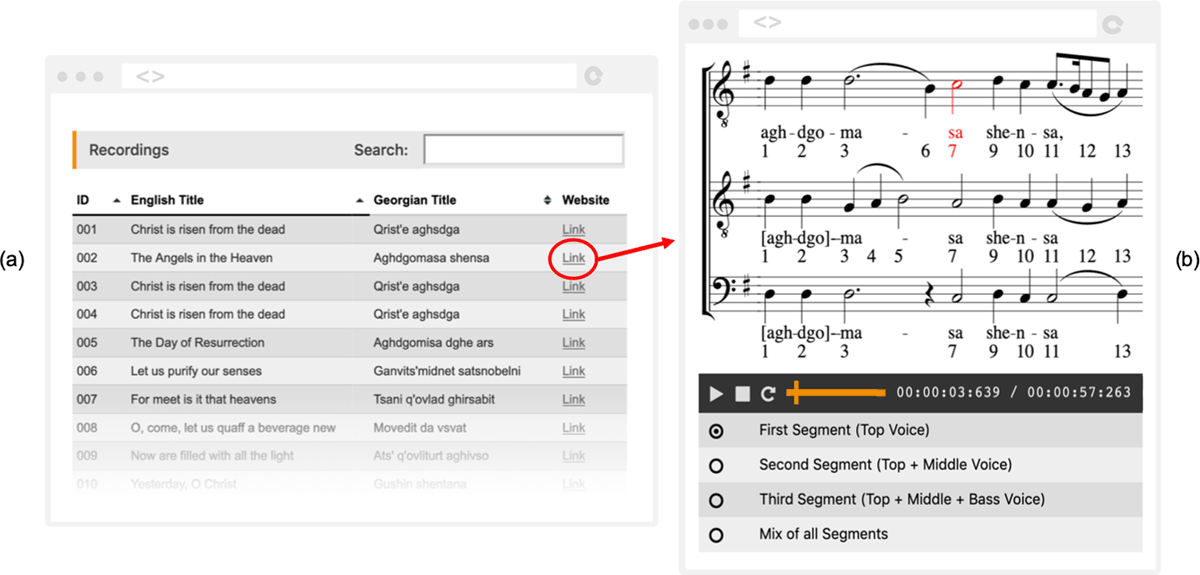
Figure 5
Web-based interface for accessing the Erkomaishvili dataset. (a) Main page with overview table. (b) Sub-page for the song “Aghdgomasa shensa” (GCH-ID 002) with score-following player.
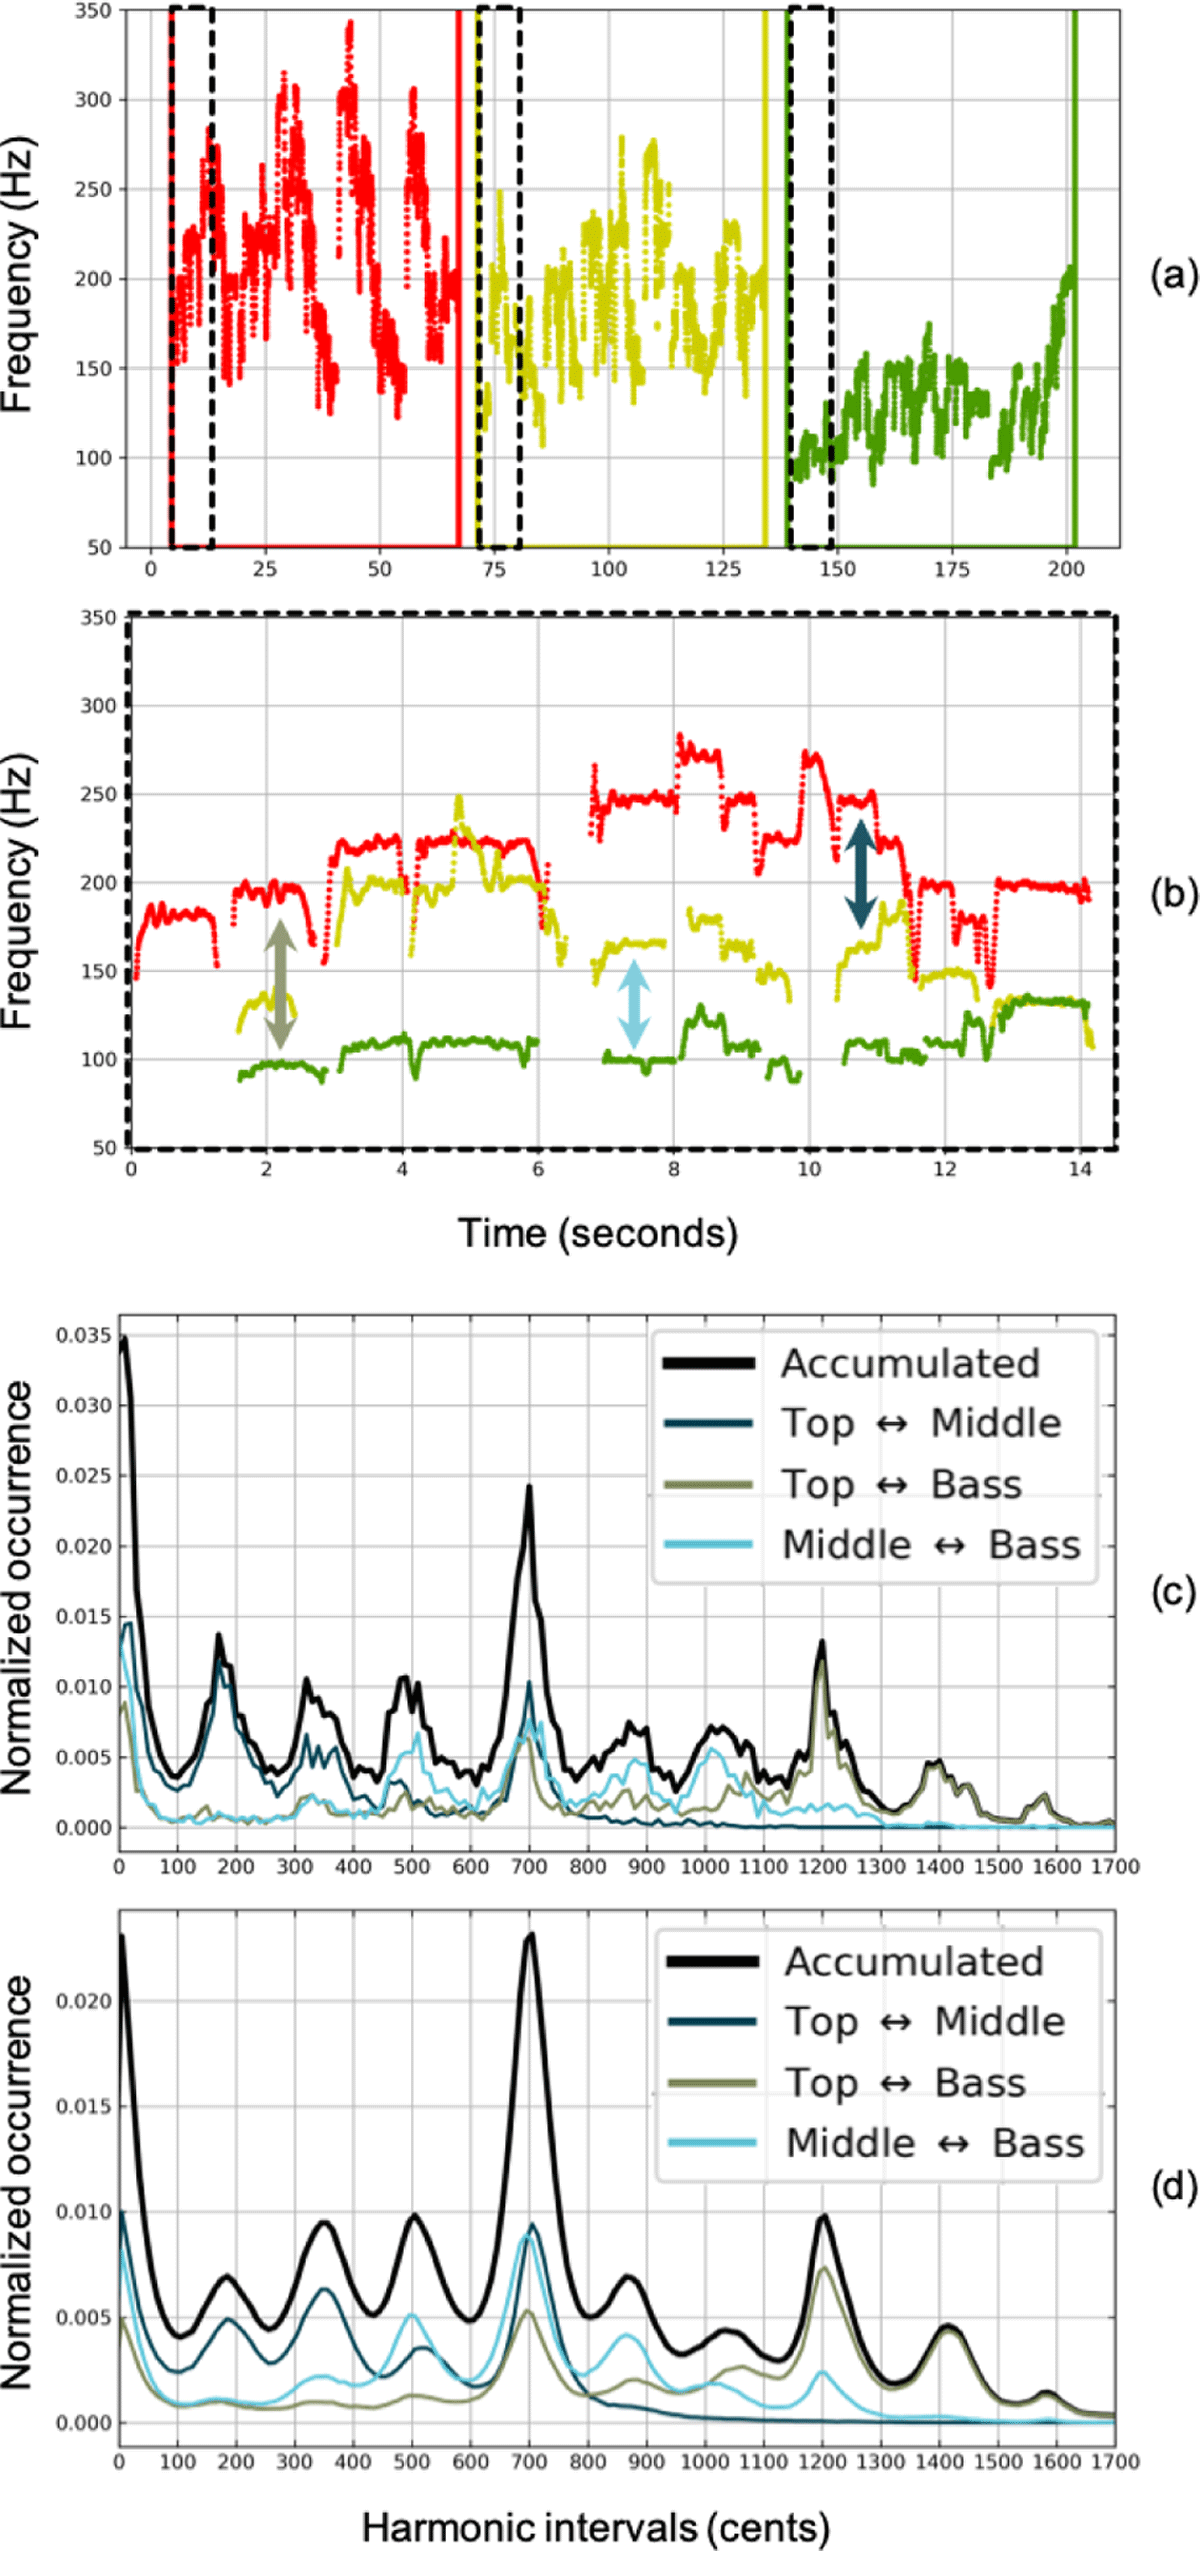
Figure 6
Computation of harmonic intervals. (a) F0-trajectories of “Gushin Shentana” (GCH-ID 010). (b) F0-trajectories of all three voices superimposed using segment annotation (zoom region). (c) Histogram of harmonic intervals for “Gushin Shentana” (GCH-ID 010). (d) Histogram of harmonic intervals averaged over all 101 songs of the dataset.
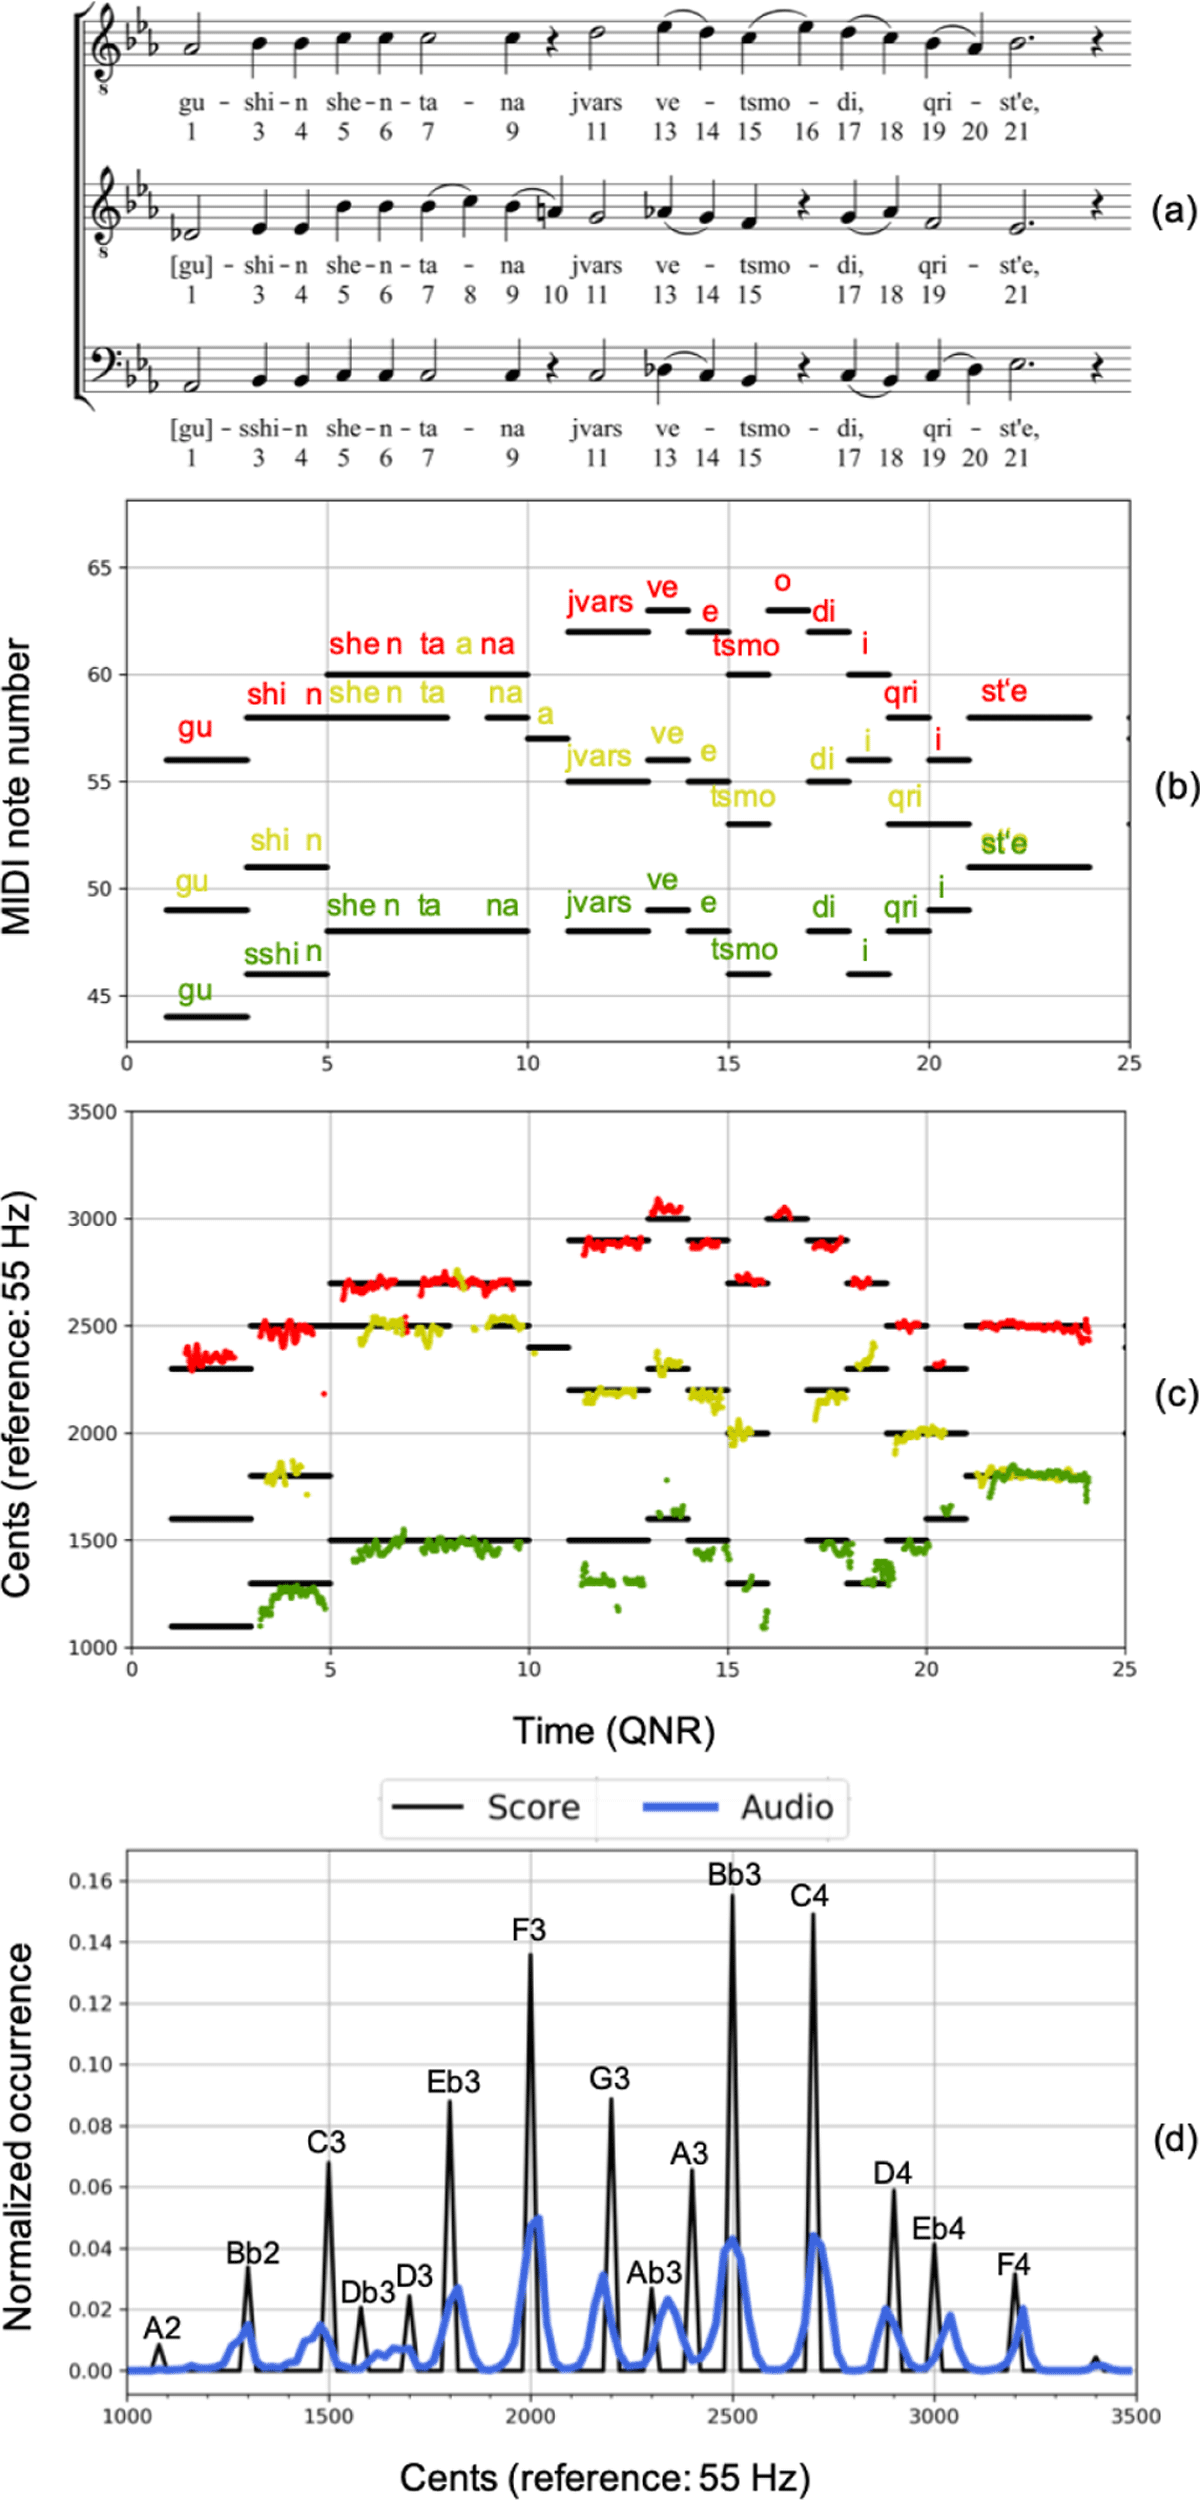
Figure 7
Comparison of transcribed score representation and annotated F0-trajectories for “Gushin Shentana” (GCH-ID 010). (a) Sheet music representation (excerpt). (b) Piano roll representation of score with lyrics (excerpt). (c) Adapted F0-trajectories for all three voices restricted to stable regions. (d) Pitch histograms for piano roll representation and adapted F0-annotation. The note names are given (A4 = 440 Hz).
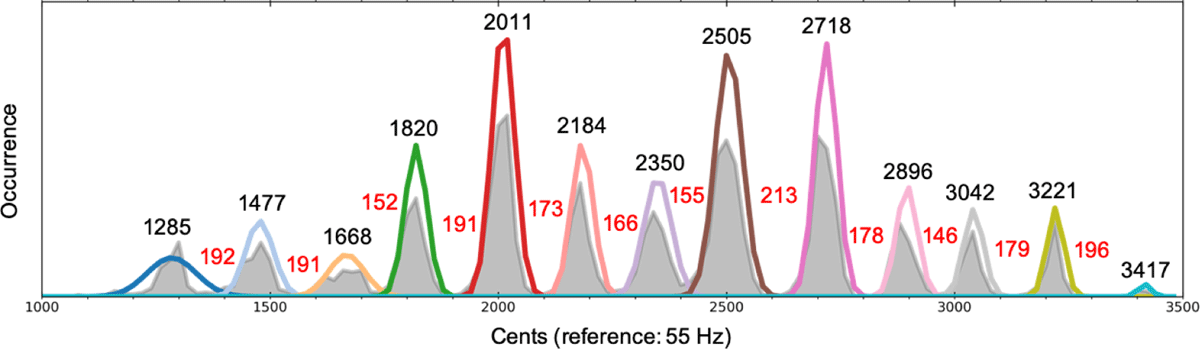
Figure 8
GMM with 13 Gaussians fitted to pitch histogram determined from adapted F0-trajectories of the song “Gushin Shentana” (GCH-ID 010). The black numbers on top of the peaks indicate the peak values in cents, while the red numbers indicate the intervals between neighboring peaks. The original distribution is indicated in grey color.