
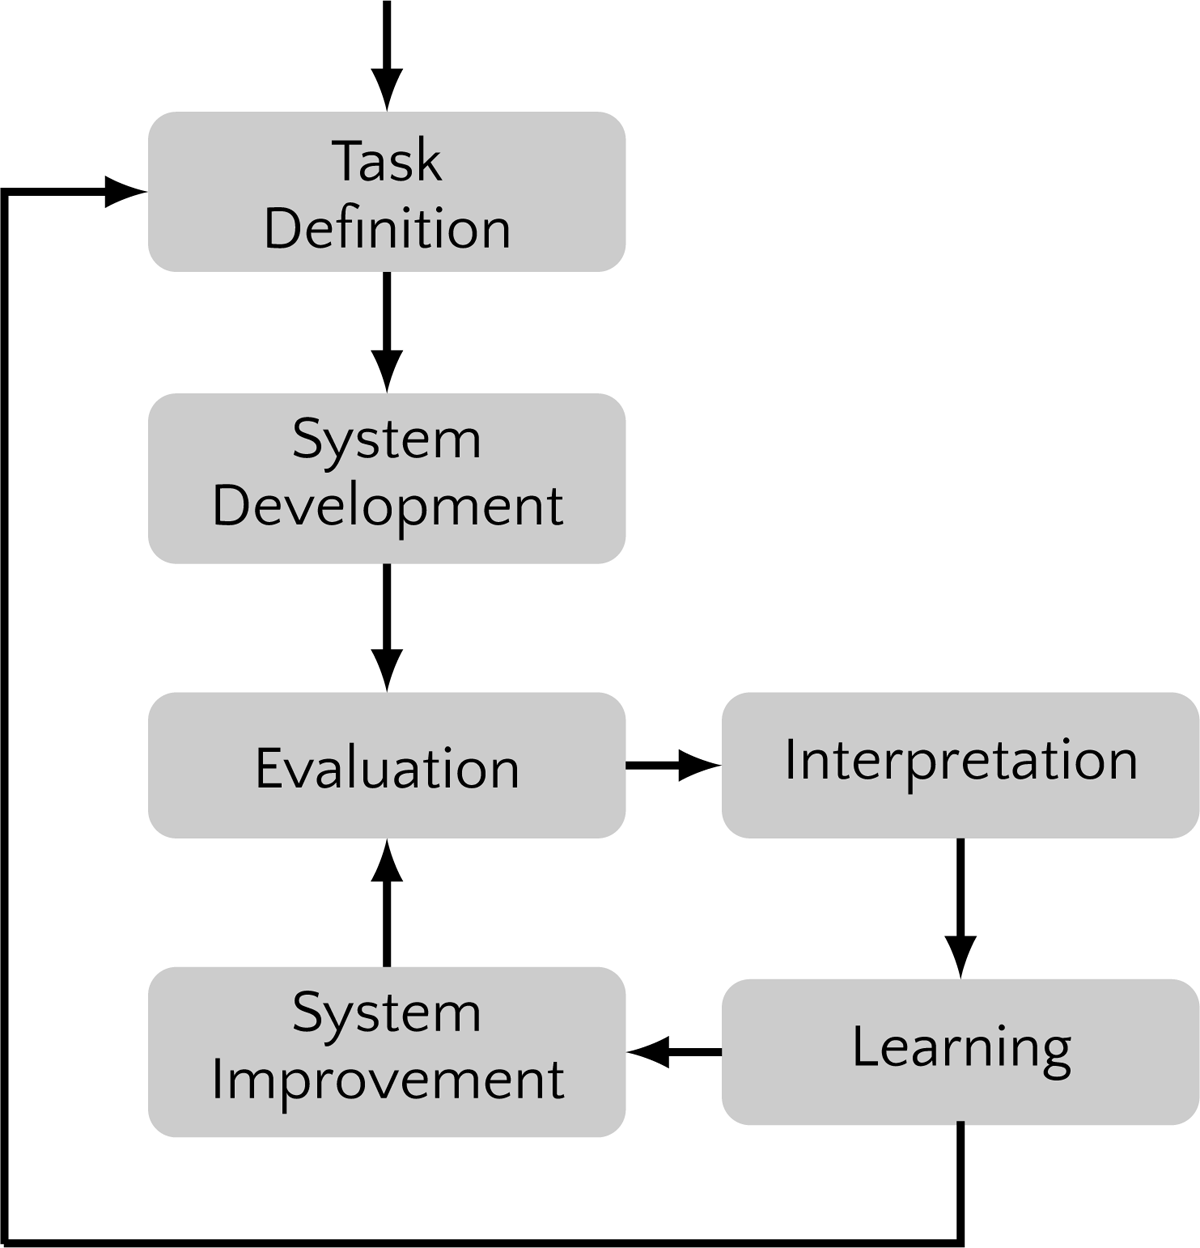
Figure 1
IR research cycle (Urbano et al., 2013).
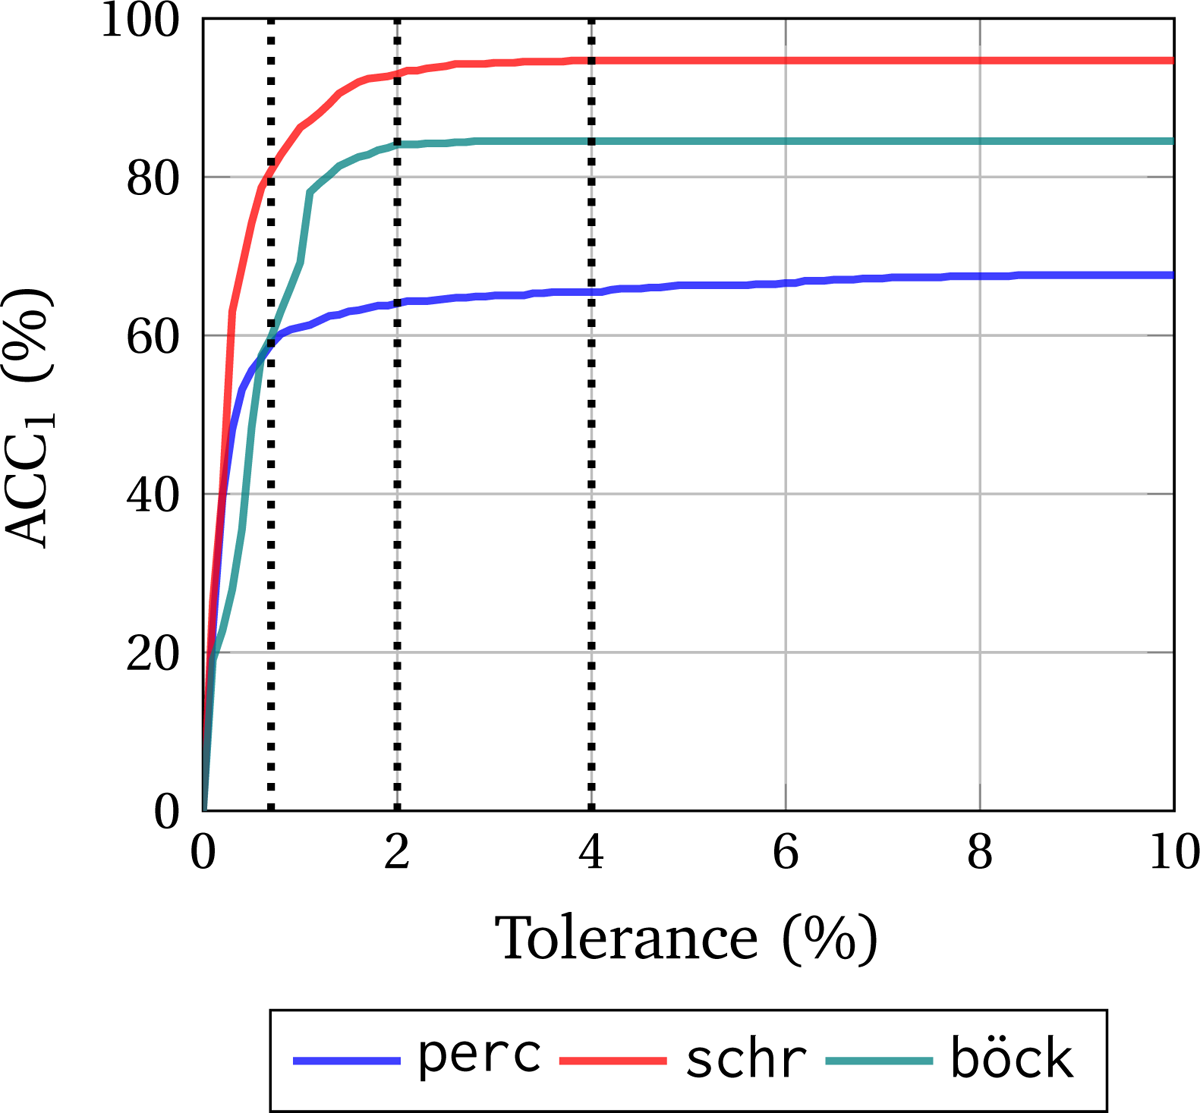
Figure 2
ACC1 of several tempo estimation systems depending on tolerance measured on Ballroom with a ground truth based on beat annotations by Krebs et al. (2013).
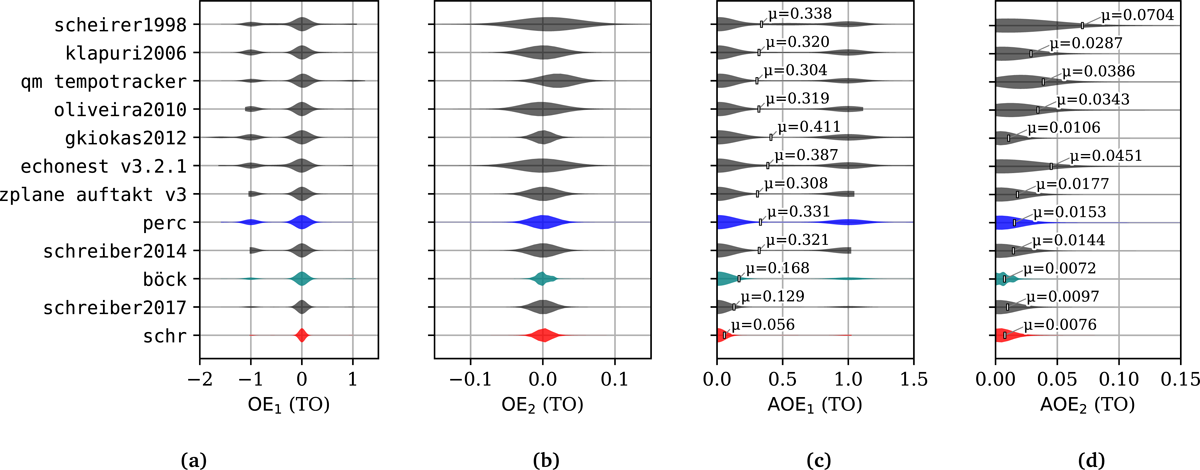
Figure 3
Empirical distributions of (a) OE1, (b) OE2, (c) AOE1, and (d) AOE2 using kernel density estimation (KDE). Based on values measured for Ballroom using a median ICBI-derived ground truth created from beat annotations by Krebs et al. (2013). Ordered by year of publication (Scheirer, 1998; Klapuri et al., 2006; Davies et al., 2009; Oliveira et al., 2010; Gkiokas et al., 2012; Percival and Tzanetakis, 2014; Schreiber and Müller, 2014; Böck et al., 2015; Schreiber and Müller, 2017, 2018b). Estimates for zplane and echonest stem from Percival and Tzanetakis (2014).
Table 1
Popular public tempo datasets.
| Dataset | Recordings | Tempo Ann. | Beat Ann. |
|---|---|---|---|
| ISMIR04 Songs (Gouyon et al., 2006)1 | 464 | BPM | No |
| Ballroom (Gouyon et al., 2006; Krebs et al., 2013)1 | 698 | BPM | Yes |
| RWC-C (Goto et al., 2002)2 | 50 | BPM | Yes |
| RWC-G (Goto et al., 2003)2 | 100 | BPM | Yes |
| RWC-J (Goto et al., 2002)2 | 50 | BPM | Yes |
| RWC-P (Goto et al., 2002)2 | 100 | BPM | Yes |
| RWC-R (Goto et al., 2002)2 | 15 | BPM | Yes |
| GTzan (Tzanetakis and Cook, 2002; Marchand and Peeters, 2015)1 | 999 | BPM | Yes |
| Hainsworth (Hainsworth, 2004)1 | 222 | BPM | Yes |
| ACM Mirum (Peeters and Flocon-Cholet, 2012)1 | 1,410 | BPM | No |
| SMC (Holzapfel et al., 2012)1 | 217 | BPM | Yes |
| GiantSteps Tempo (Knees et al., 2015; Schreiber and Müller, 2018a)3 | 664 | BPM/T1,T2,ST1 | No |
| Extended Ballroom (Marchand and Peeters, 2016)1 | 4,180 | BPM | No |
| LMD Tempo (Raffel, 2016; Schreiber and Müller, 2018b)4 | 3,611 | BPM | No |
[i] 1 Excerpts available. 2 Requires application and purchase. 3 BeatPort previews, cached versions available from JKU. 4 7Digital previews available.
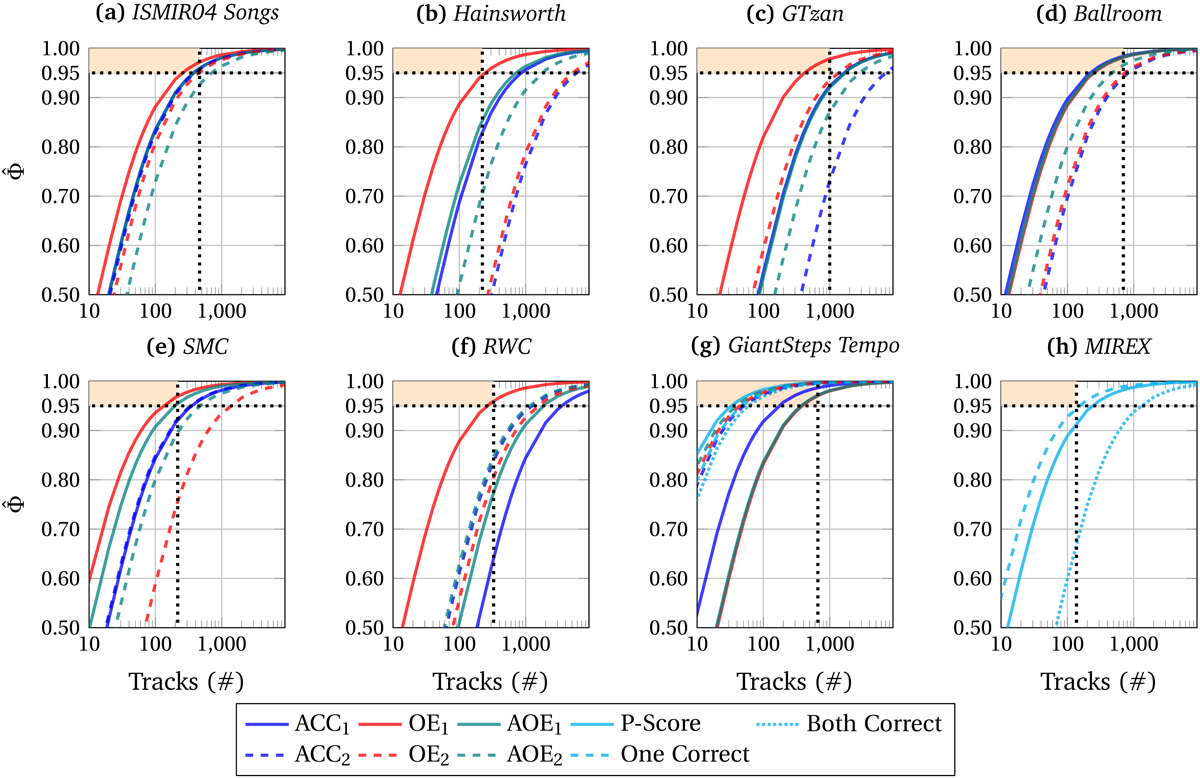
Figure 4
Dependability index as function of metric and track count. Vertical dotted line: actual number of tracks in dataset. Horizontal dotted line: = 0.95. Desired quadrant shaded in pale orange. (a–g) based on estimates Davies et al. (2009); Percival and Tzanetakis (2014); Böck et al. (2015); Schreiber and Müller (2017, 2018b). (h) based on MIREX 2018 results.
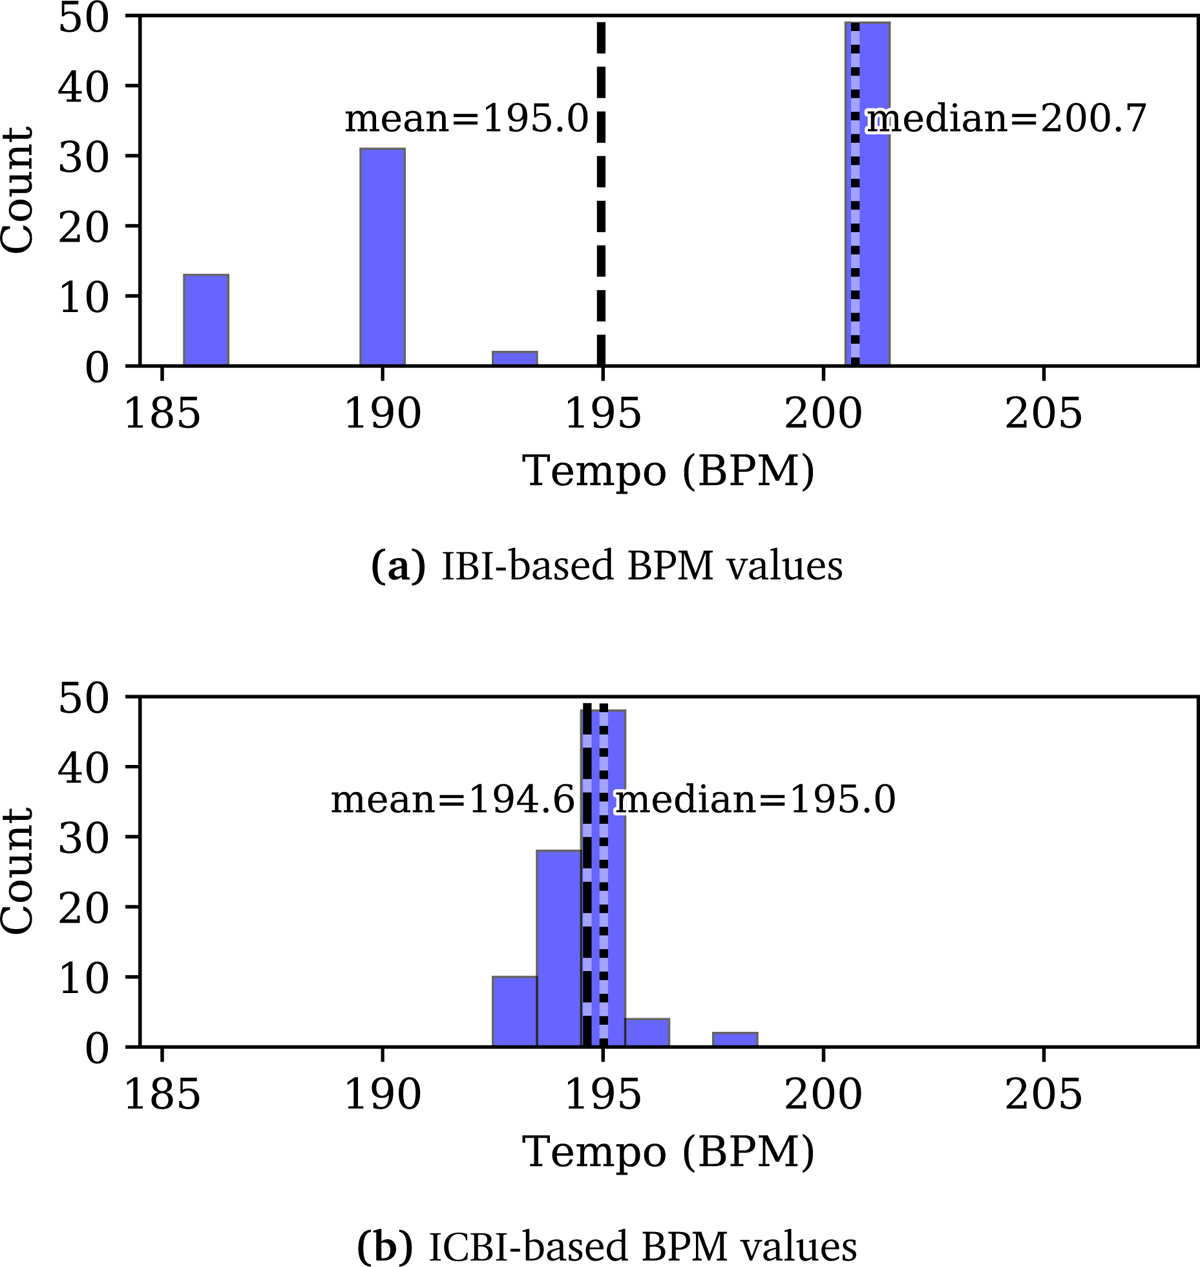
Figure 5
Histograms of BPM values for GTzan jazz.00053 based on (a) IBIs and (b) ICBIs.
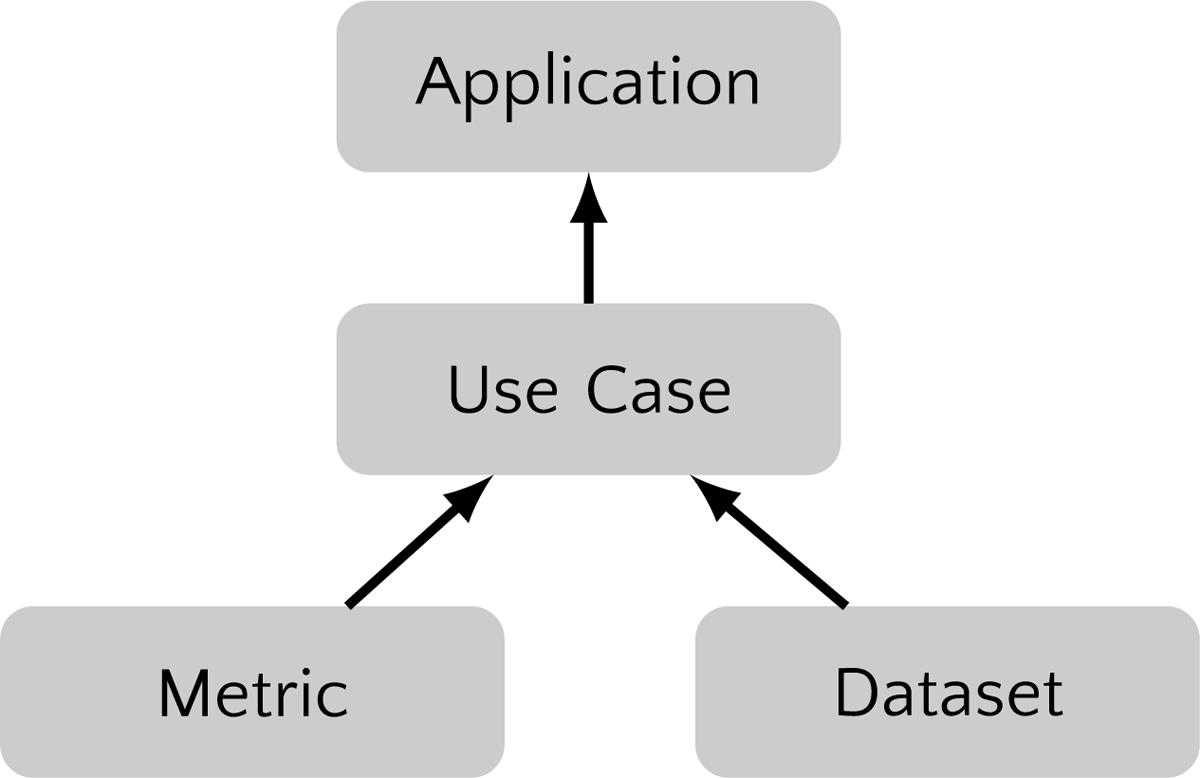
Figure 6
Dependencies between application, use case, metric, and dataset (an arrow from A to B denotes that A depends on B).
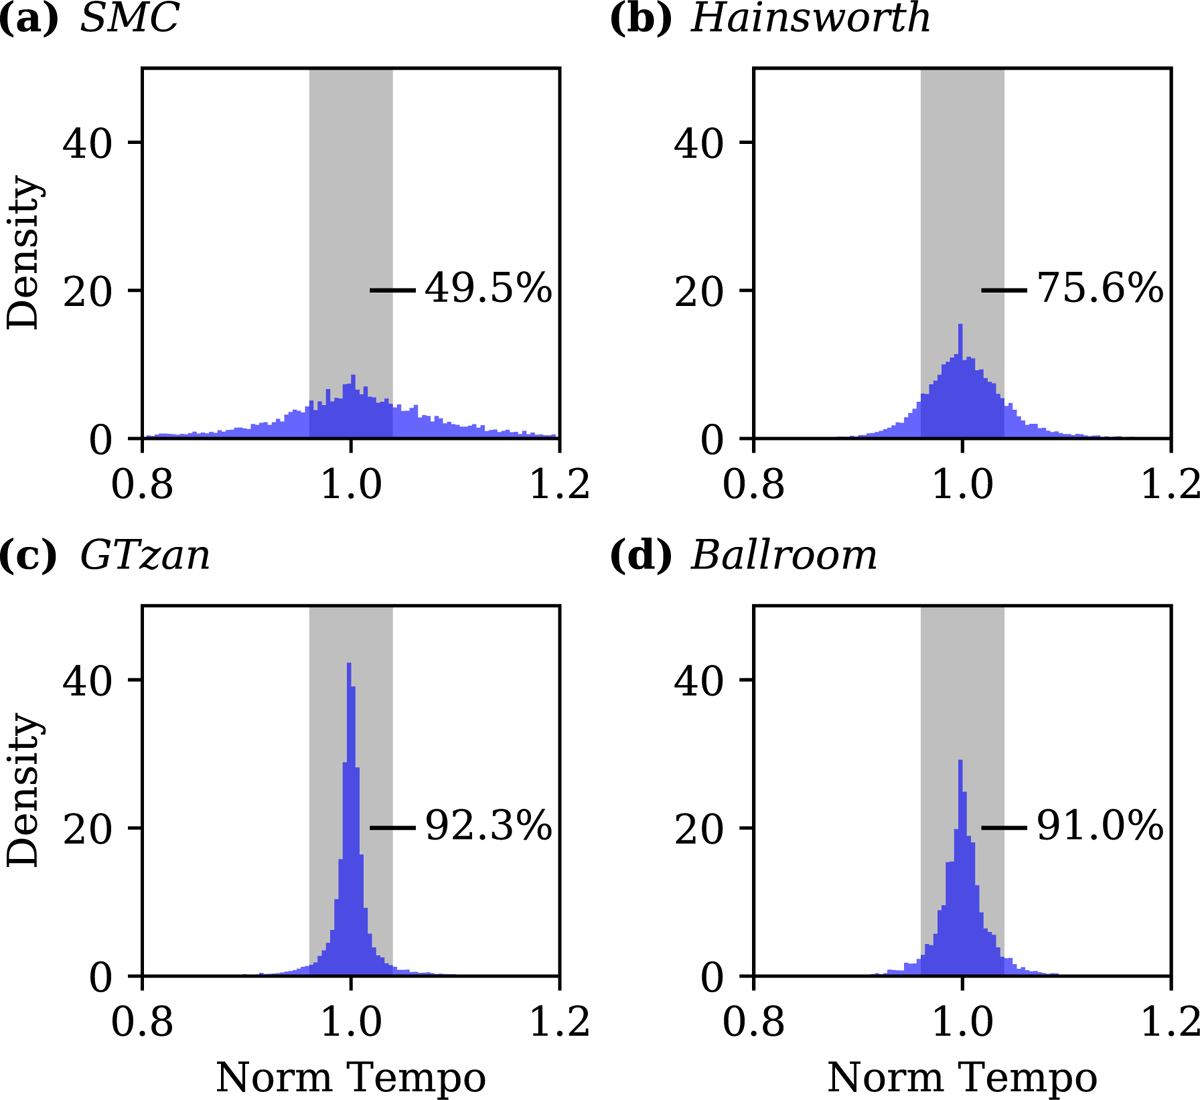
Figure 7
Distributions of normalized tempi. The gray area marks the interval [0.96,1.04]. The shown percentage is the fraction of normalized tempi within the interval.
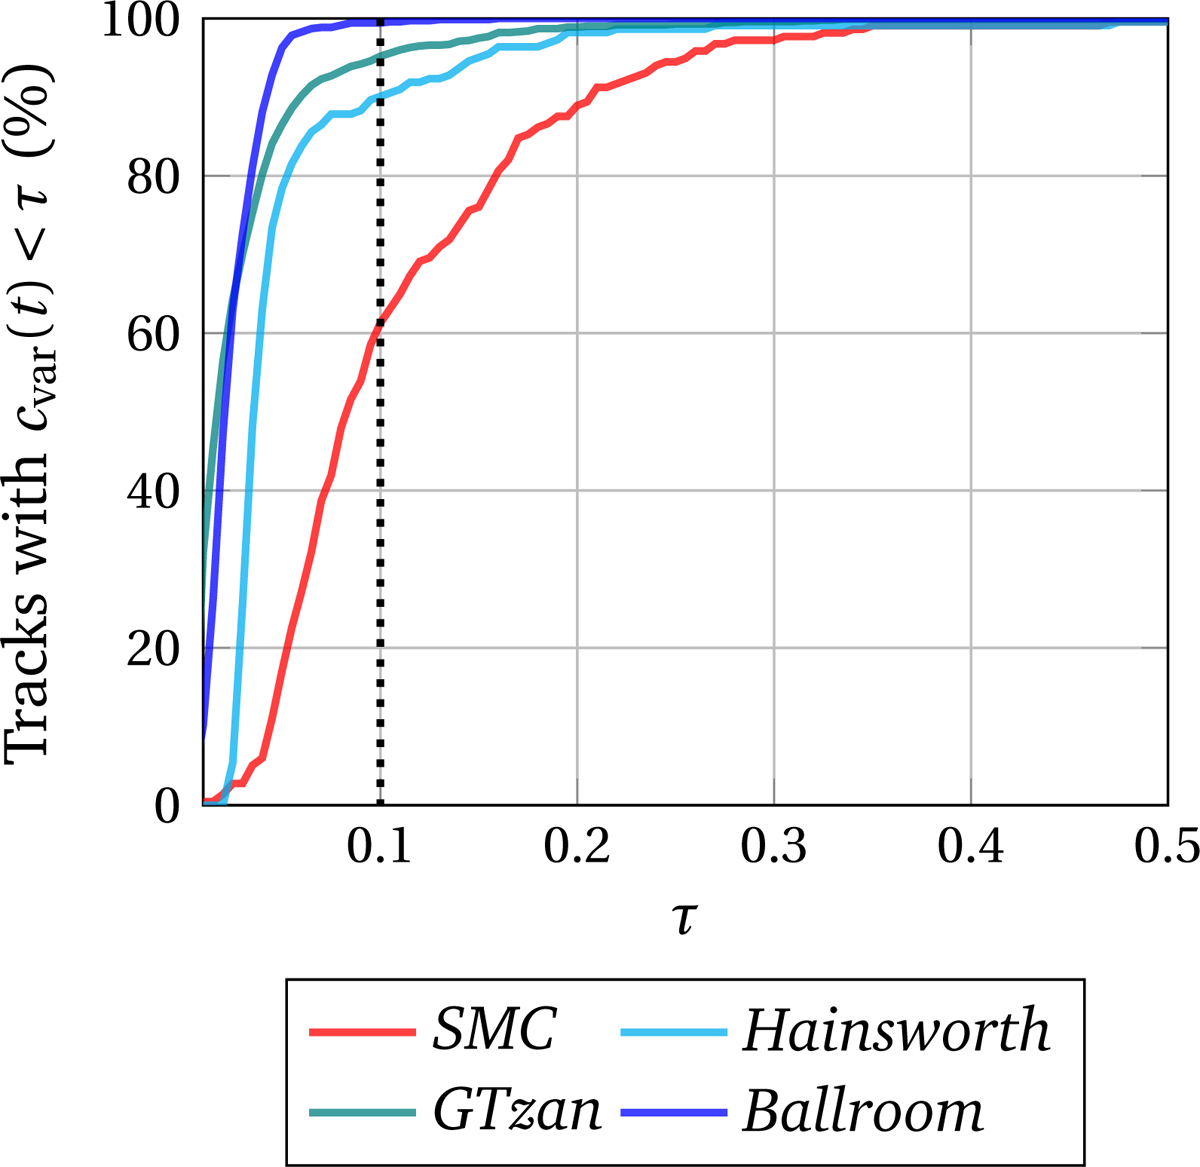
Figure 8
Percentage of tracks with cvar(t) < τ.
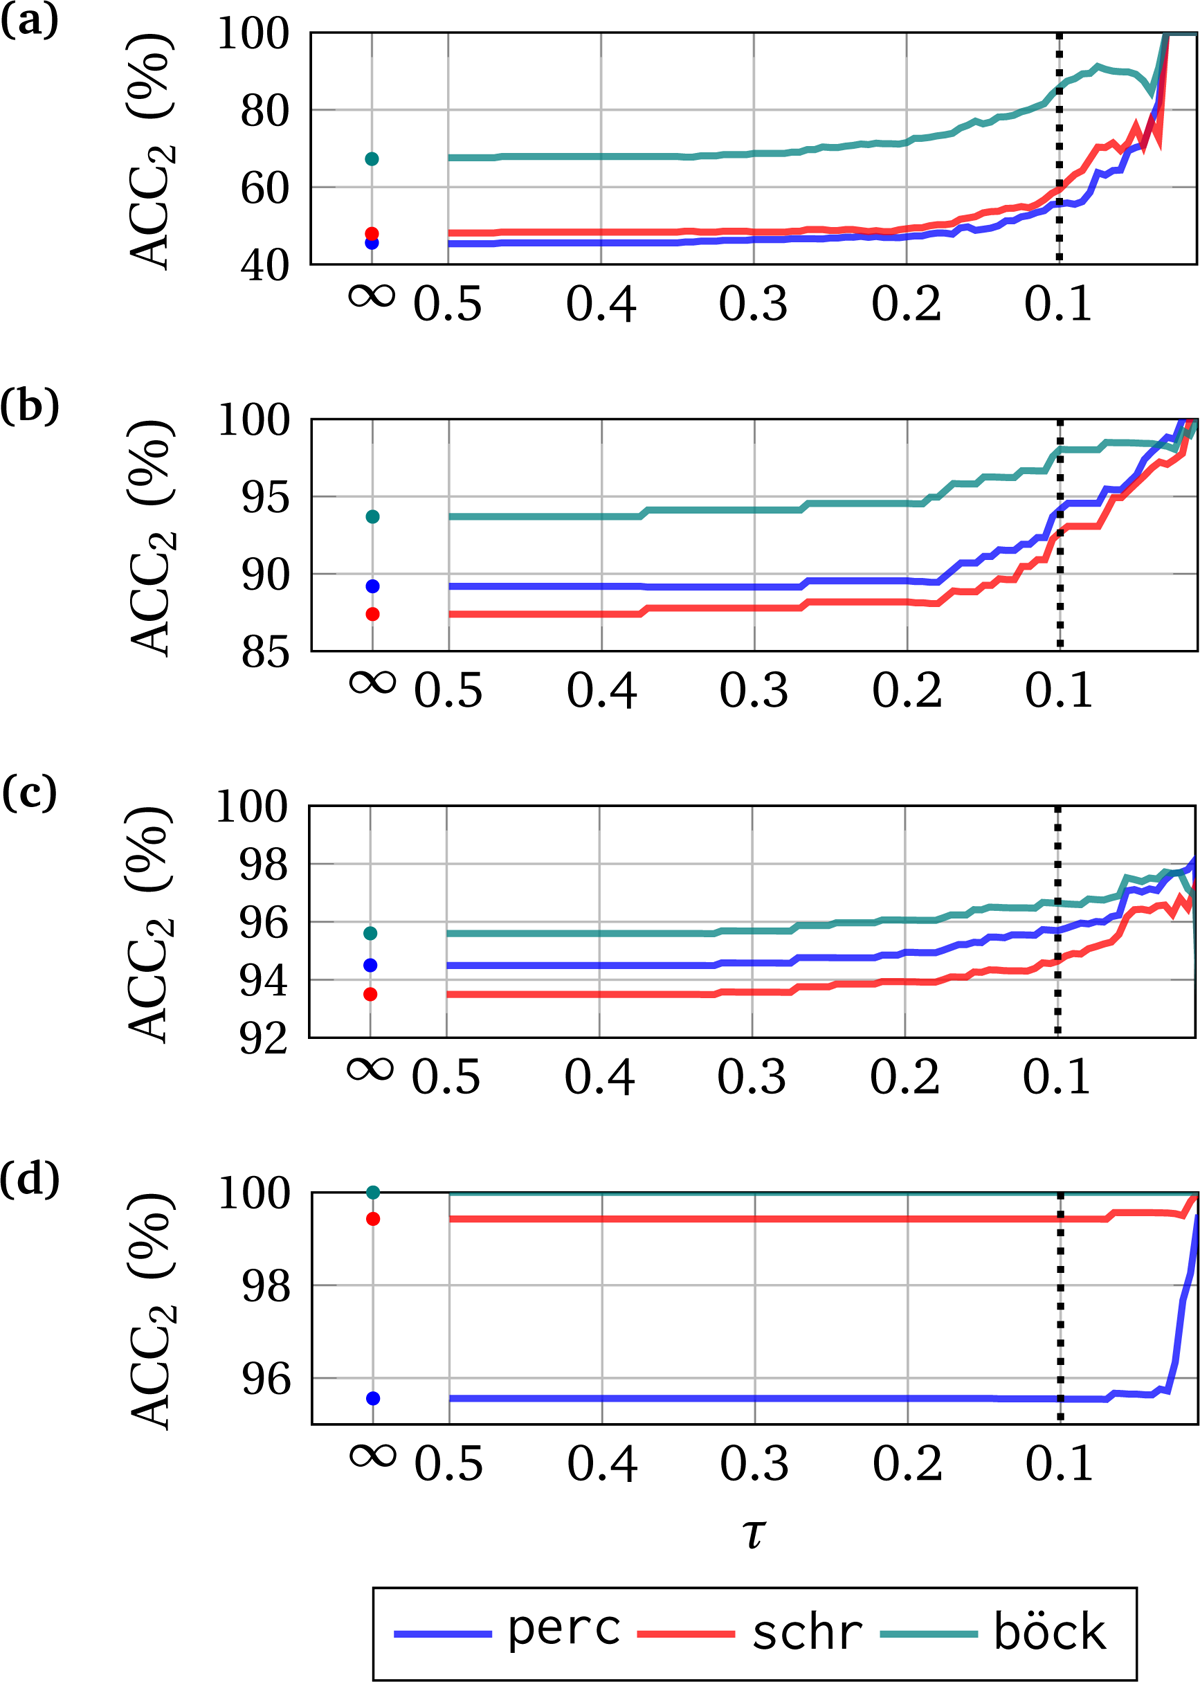
Figure 9
ACC2 for tracks with cvar(t) < τ. Lower τ coincides with higher accuracy. Datasets: (a) SMC (b) Hainsworth (c) GTzan (d) Ballroom. Different y-scales used for clarity.
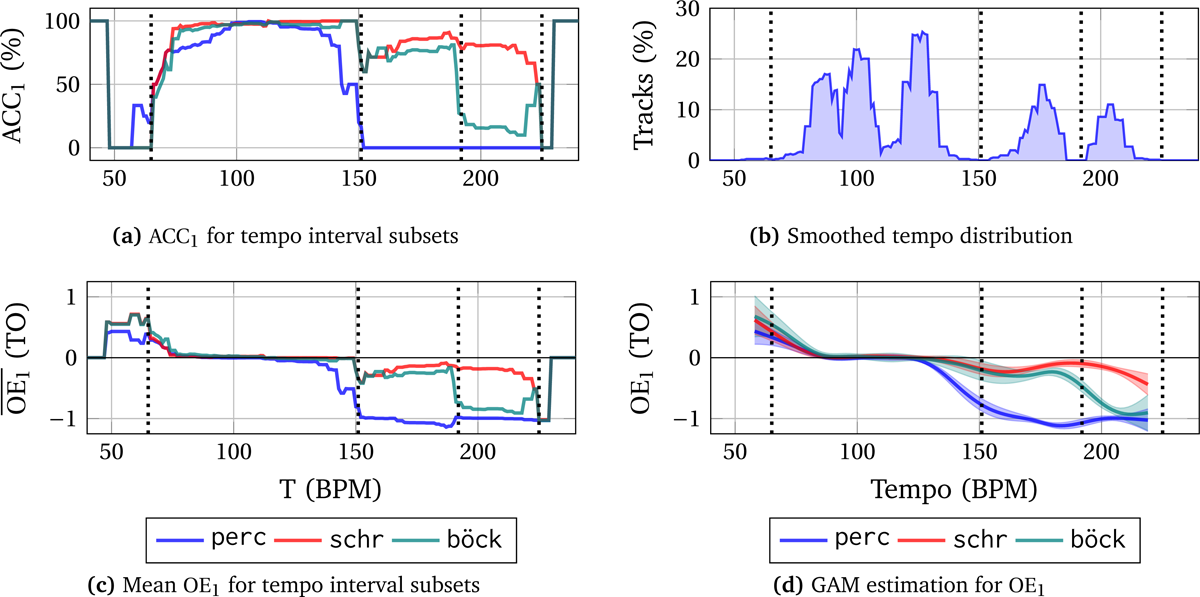
Figure 10
(a), (c) ACC1 and mean OE1 for T ± 10BPM intervals. (b) Smoothed tempo distribution of tracks in Ballroom according to the ground truth from Percival and Tzanetakis (2014). (d) OE1 predictions of generalized additive models (GAM). Shaded areas correspond to 95% confidence intervals.
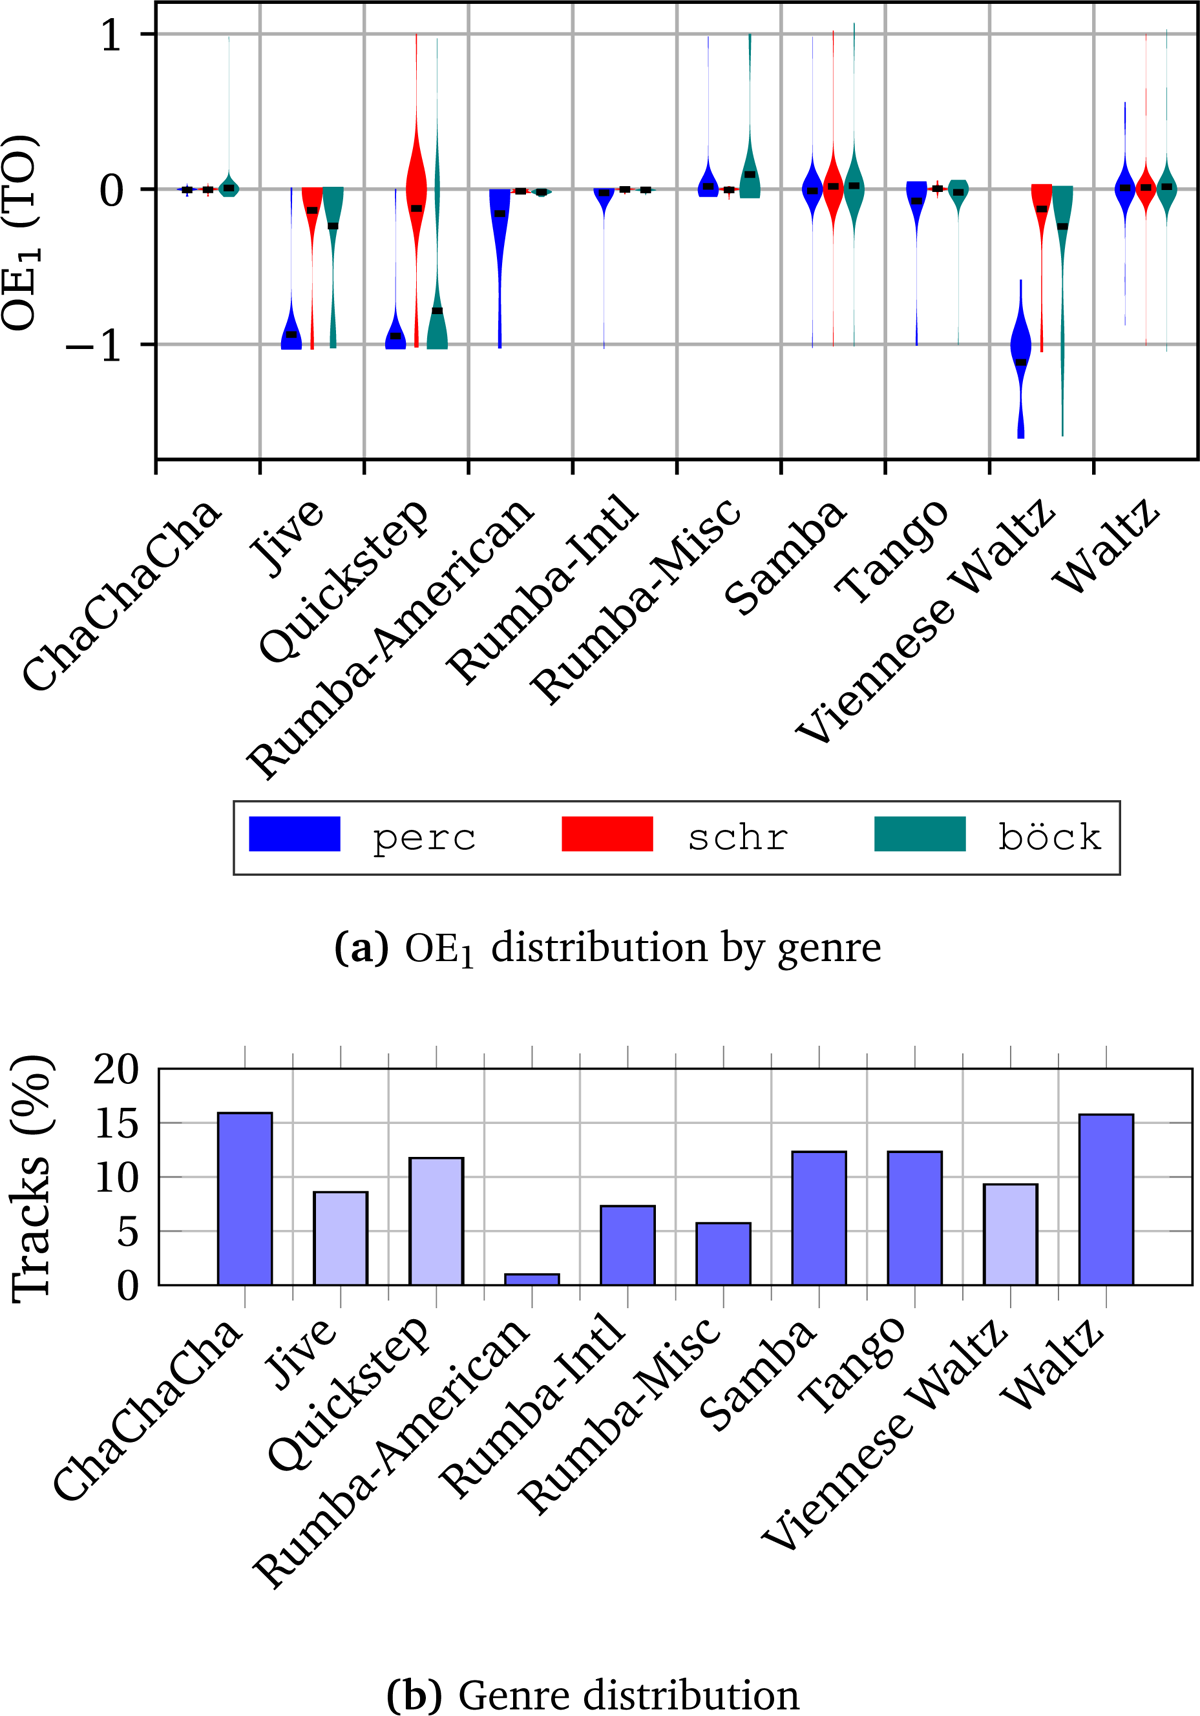
Figure 11
(a) Per genre OE1 distributions based on kernel density estimation (KDE) for tracks from Ballroom using the ground truth from Percival and Tzanetakis (2014). Mean OE1 values are marked in black. (b) Genre distribution in Ballroom.